Fig. 1.
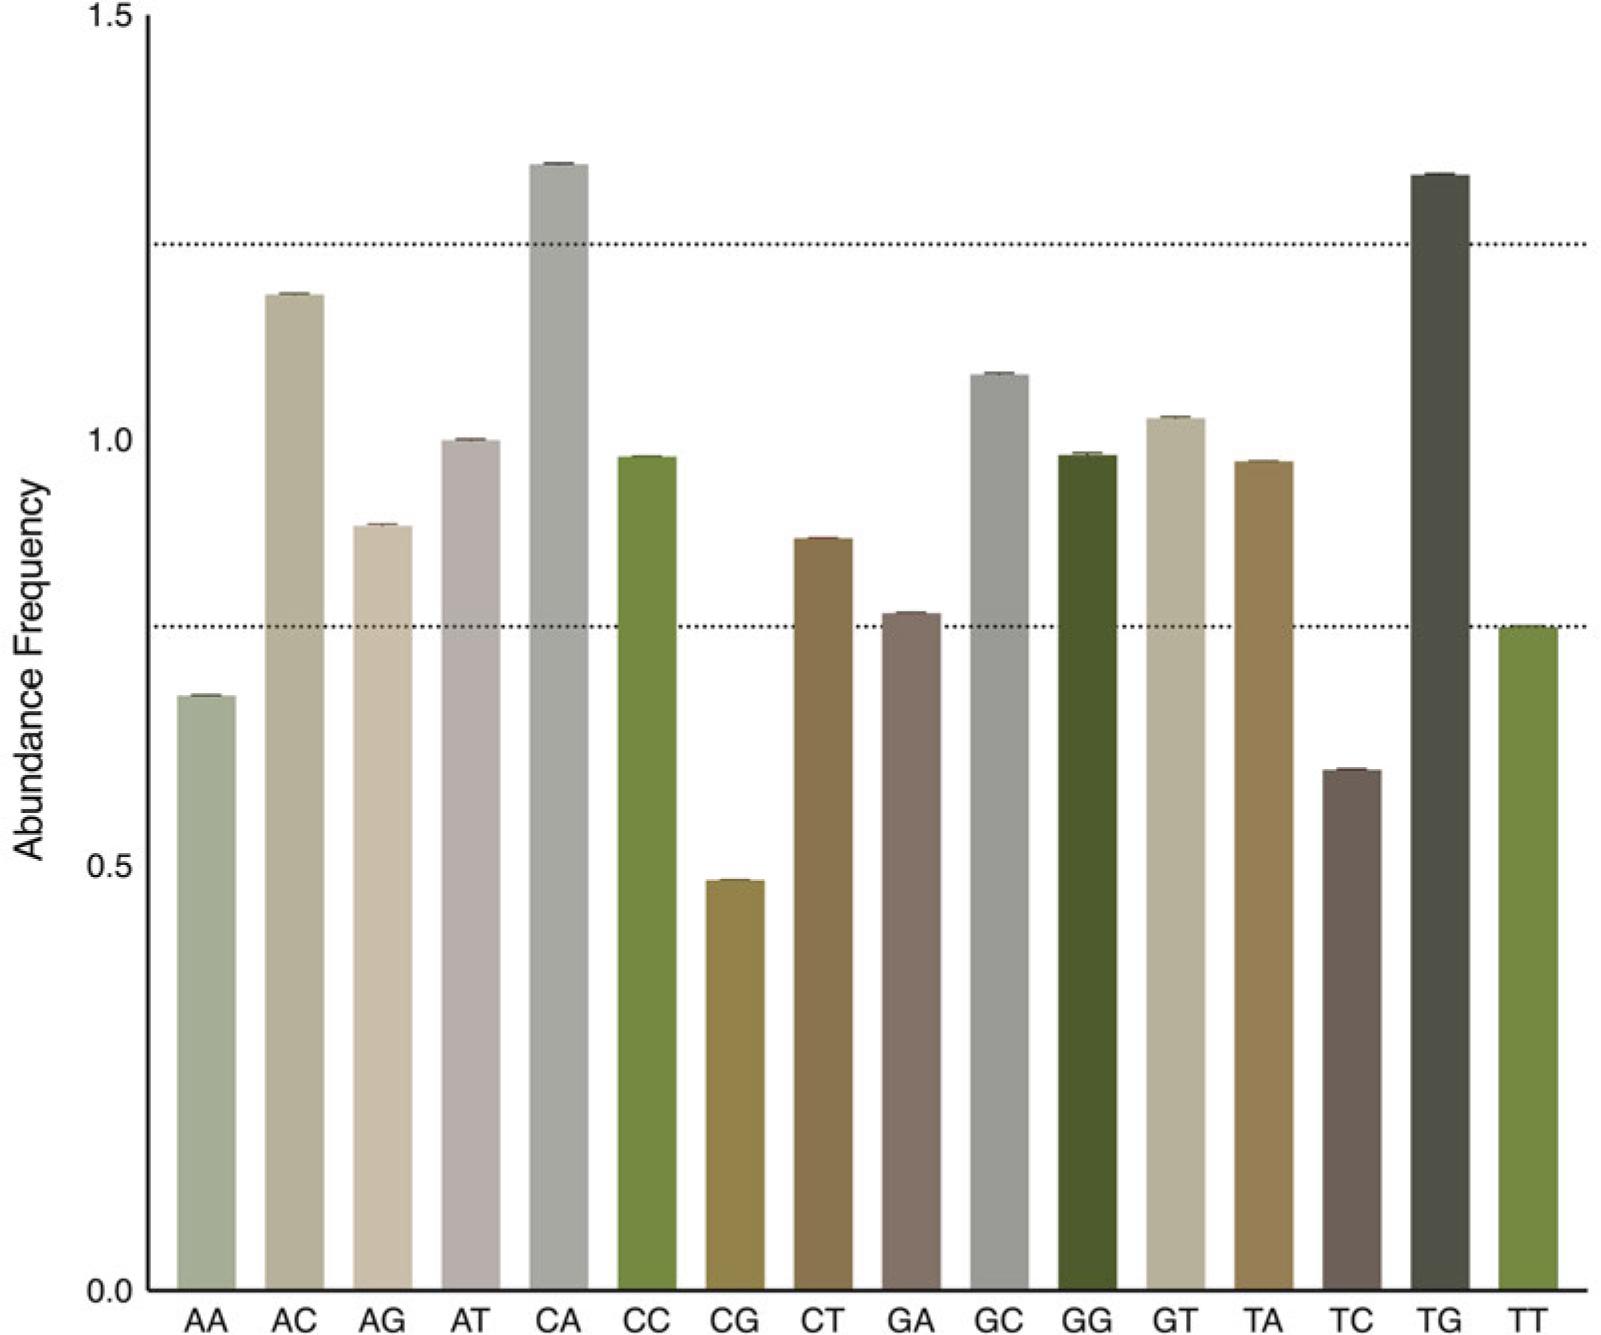
Fig. 2.
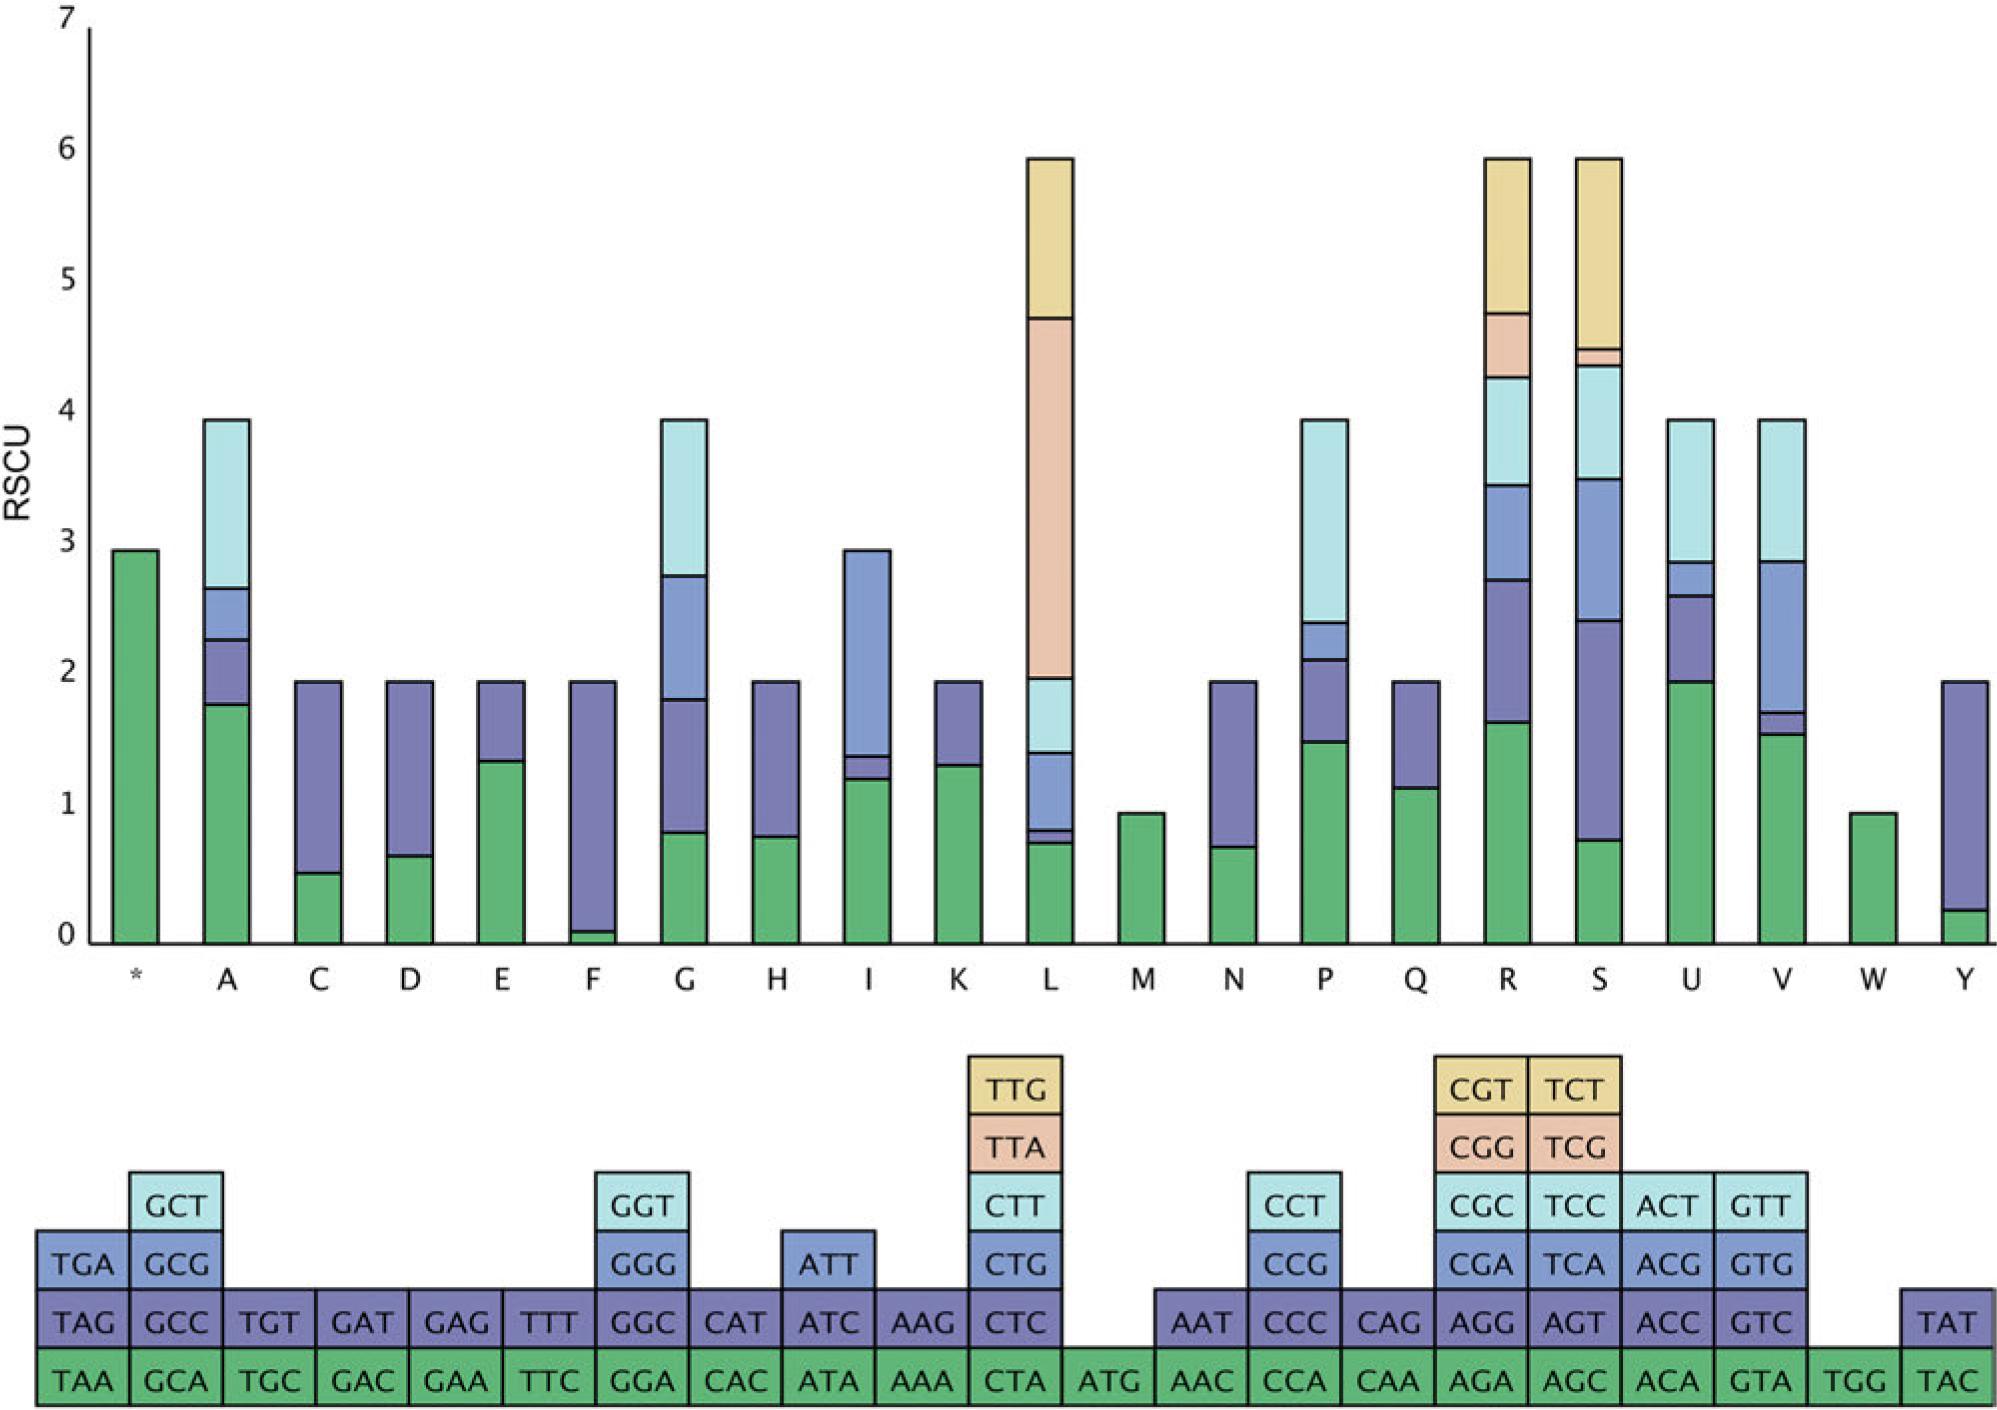
Fig. 3.
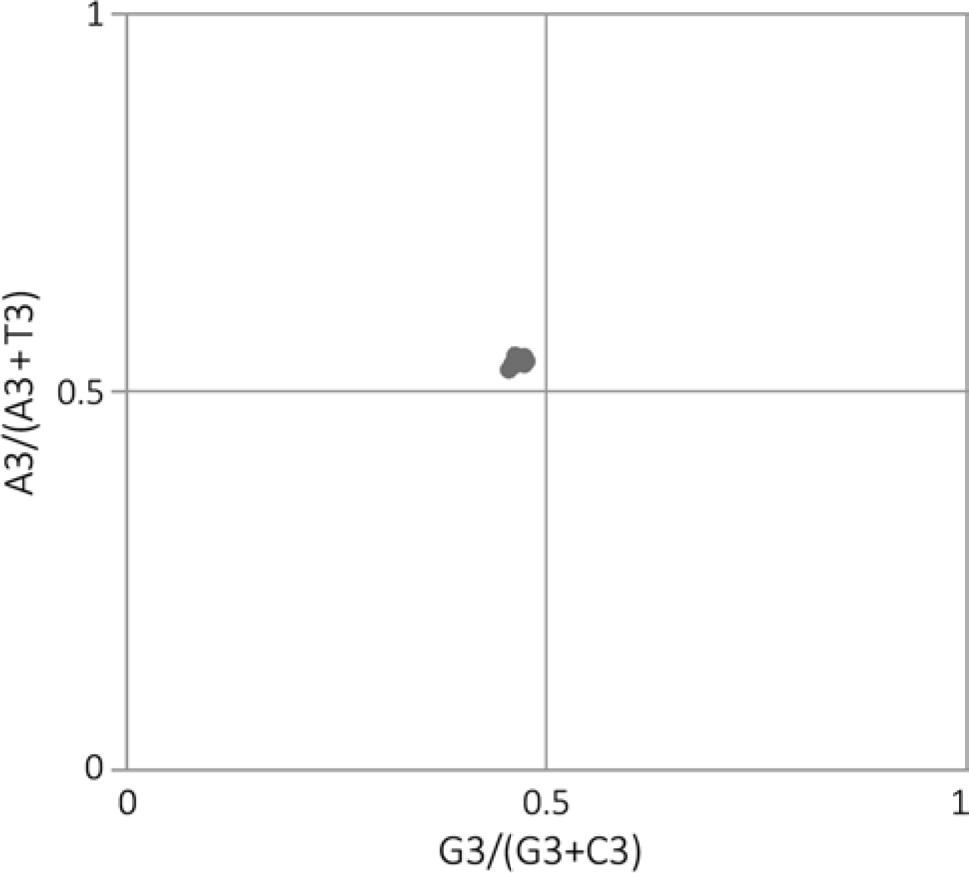
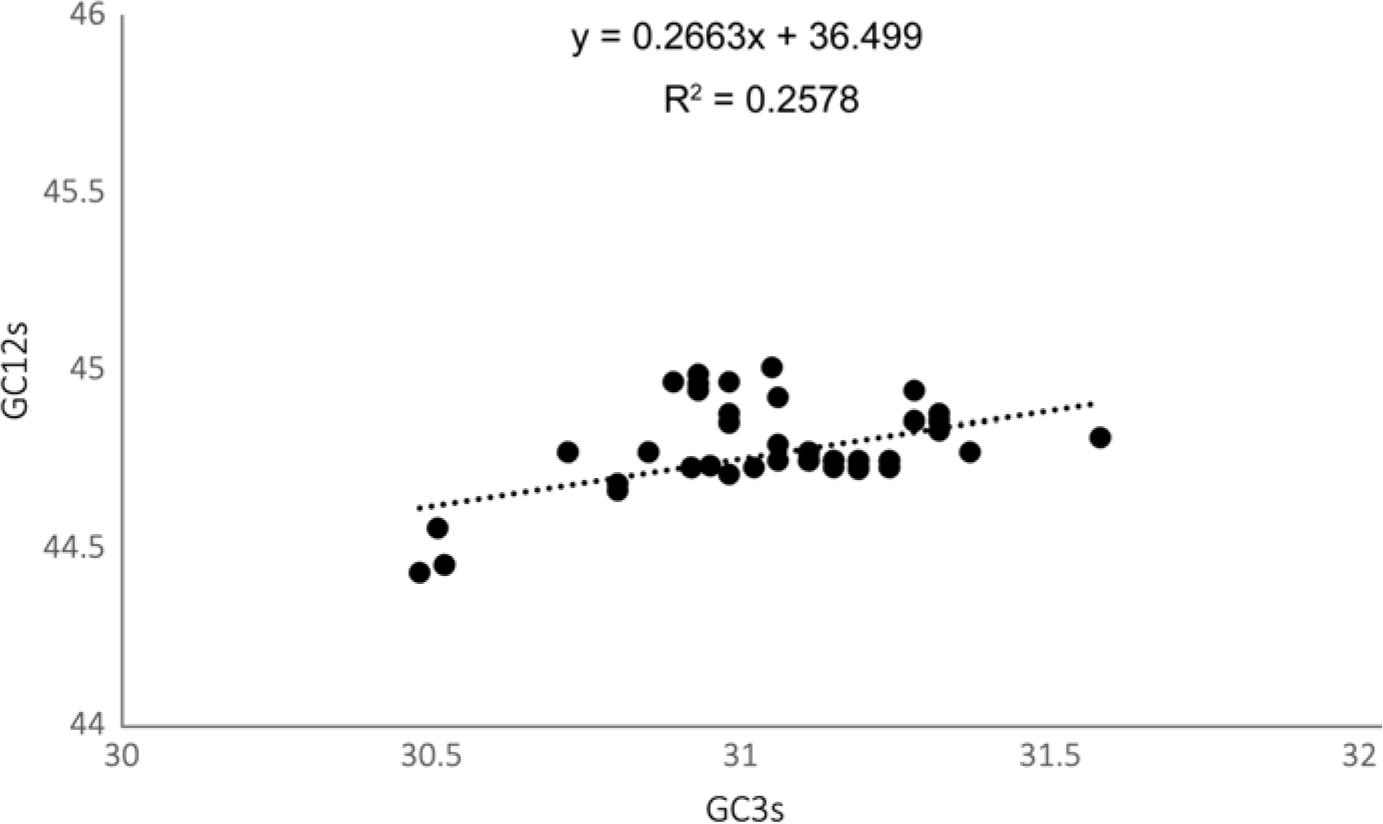
Fig. 4.
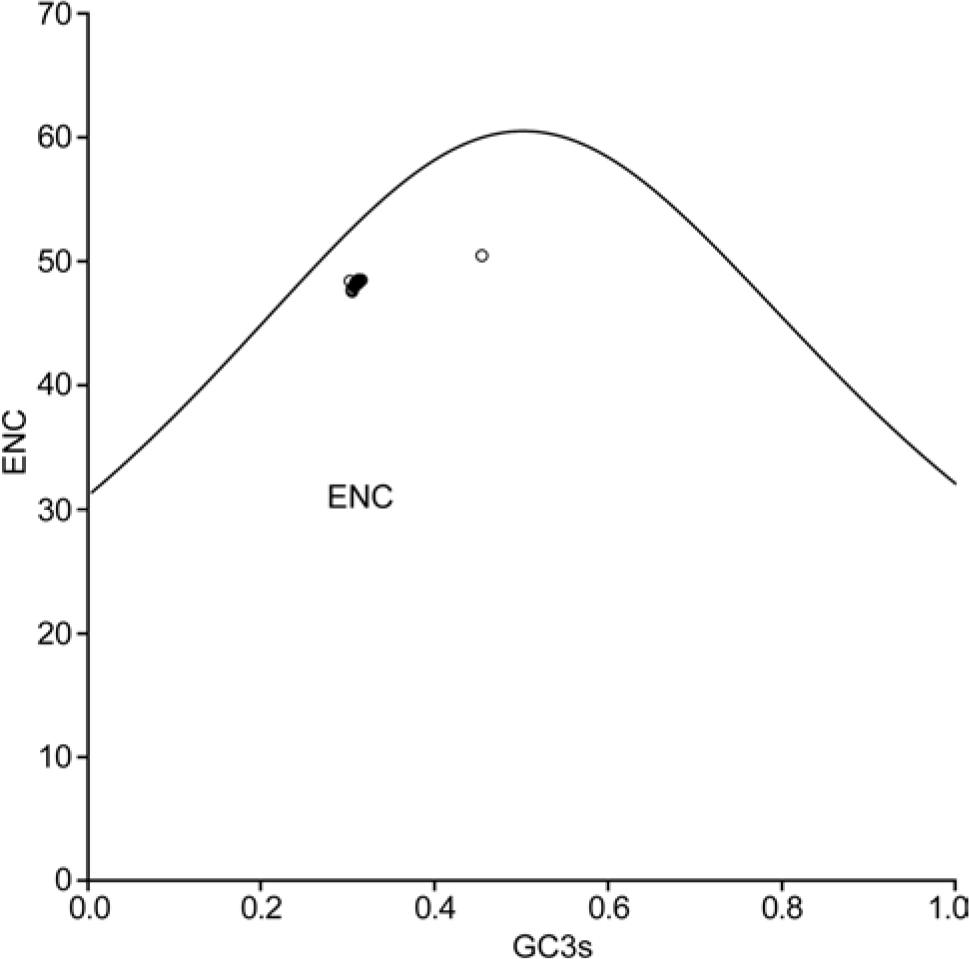
Fig. 5.
Correlation analysis between GC3s, CAI, GRAVY, and AROMO_
| GC3s | CAI | GRAVY | |
|---|---|---|---|
| CAI | –0.036 | ||
| GRAVY | 0.143 | 0.168 | |
| Aromo | 0.818*** | –0.135 | –0.122 |
Frequency of tRNA genes in human cells corresponding to the most preferentially used codons in HPV-51_
| Amino acid | Most preferred codons in HPV-51 | tRNA isotypes in human cells | Total count |
|---|---|---|---|
| Ala (A) | GCG | AGC (22), GGC (0), CGC (4), TGC (8) | 34 |
| Gly (G) | GGC | ACC (0), GCC (14), CCC (5), TCC (9) | 28 |
| Pro (P) | CCG | AGG (9), GGG (0), CGG (4), TGG (7) | 20 |
| Thr (T) | ACG | AGT (9), GGT (0), CGT (5), TGT (6) | 20 |
| Val (V) | GTG | AAC (9), GAC (0), CAC (11), TAC (5) | 25 |
| Ser (S) | TCG | AGA (9), GGA (0), CGA (4), TGA (4), ACT (0), GCT (8) | 25 |
| Arg (R) | AGG | ACG (7), GCG (0), CCG (4), TCG (6), CCT (5), TCT (6) | 28 |
| Leu (L) | CTG | AAG (9), GAG (0), CAG (9), TAG (3), CAA (6), TAA (4) | 31 |
| Phe (F) | TTC | AAA (0), GAA (10) | 10 |
| Asn (N) | AAT | ATT (0), GTT (20) | 20 |
| Lys (K) | AAG | CTT (15), TTT (12) | 27 |
| Asp (D) | GAC | ATC (0), GTC (13) | 13 |
| Glu (E) | GAG | CTC (8), TTC (7) | 15 |
| His (H) | CAC | ATG (0), GTG (10) | 10 |
| Gln (Q) | CAG | CTG (13), TTG (6) | 19 |
| Ile (I) | ATC | AAT (14), GAT (3), TAT (5) | 22 |
| Tyr (Y) | TAT | ATA (0), GTA (13) | 13 |
| Cys (C) | TGC | ACA (0), GCA (29) | 29 |
| Trp (W) | TGG | CCA (7) | 7 |
| Met (M) | ATG | CAT (9/10) | 19 |
Nucleotide composition of complete genomes in HPV-51_
| Genotype | GC1s* | GC2s | GC3s | T3s | C3s | A3s | G3s |
|---|---|---|---|---|---|---|---|
| HPV-51 | 46.23 ± 0.27 | 43.26 ± 0.22 | 31.03 ± 0.24 | 43.36 ± 5.56 | 17.08 ± 2.19 | 44.32 ± 5.68 | 19.59 ± 2.51 |
The Effective Number of Codons (ENC), Codon Adaptation Index (CAI), and Relative Codon Deoptimization Index (RCDI) values of complete genomes in HPV-51_
| Genotype | ENC* | CAI | RCDI |
|---|---|---|---|
| HPV-51 | 48.25 ± 0.20 | 0.72 ± 0.00 | ± 0.01 |