Fig. 1.
Demographic features of the patients_
| Age (Mean ± SD) | 66.4 ± 13.6 |
|---|---|
| Gender (n, %) | |
| Male | 852 (63.8%) |
| Female | 483 (36.2%) |
| Comorbidity (n, %) | |
| Hypertension | 787 (59%) |
| COPD | 714 (53.2%) |
| IHD | 467 (35%) |
| Asthma | 323 (24.2%) |
| CVD | 173 (13%) |
| Malignancy | 87 (6.5%) |
| Bronchiectasis | 66 (4.9%) |
| CRF | 49 (3.7%) |
| Alzheimer | 33 (2.5%) |
| Diabetes | 28 (2.1%) |
| DILD | 18 (1.3%) |
| Hospitalization diagnoses (n, %) | |
| COPD exacerbation | 645 (48.3%) |
| Pneumonia | 435 (32.6%) |
| Asthma attack | 255 (19.1%) |
Viral and Mycoplasma panel PCR results by hospitalization diagnoses_
| COPD n (%) | Pneumonia n (%) | Asthma n (%) | |
|---|---|---|---|
| Influenza A | 72 (11.2) | 47 (10.8) | 31 (12.2) |
| H1N1 | 61 (9.5) | 39 (9) | 25 (9.8) |
| H3N2 | 52 (8.1) | 25 (5.7) | 22 (8.6) |
| Influenza B | 3 (0.5) | 4 (0.9) | 3 (1.2) |
| Other Respiratory Viruses | 98 (15.2) | 68 (15.6) | 56 (22) |
| Adenovirus | 5 (0.8) | 4 (0.9) | 1 (0.4) |
| Human coronavirus | 26 (4) | 17 (3.9) | 14 (5.5) |
| Parainfluenzavirus 1–4 | 8 (1.2) | 2 (0.5) | 7 (2.7) |
| Entero/Rhinovirus | 34 (5.3) | 26 (6) | 19 (7.5) |
| Human bocavirus | 1 (0.2) | 0 | 2 (0.8) |
| Human metapneumovirus | 3 (0.5) | 3 (0.7) | 5 (2) |
| RSV/EU | 22 (3.4) | 16 (3.7) | 9 (3.5) |
| Parecohvirus | 0 | 0 | 0 |
| Bacteria | 0 | 0 | 0 |
| Mycoplasma spp. | 0 | 0 | 0 |
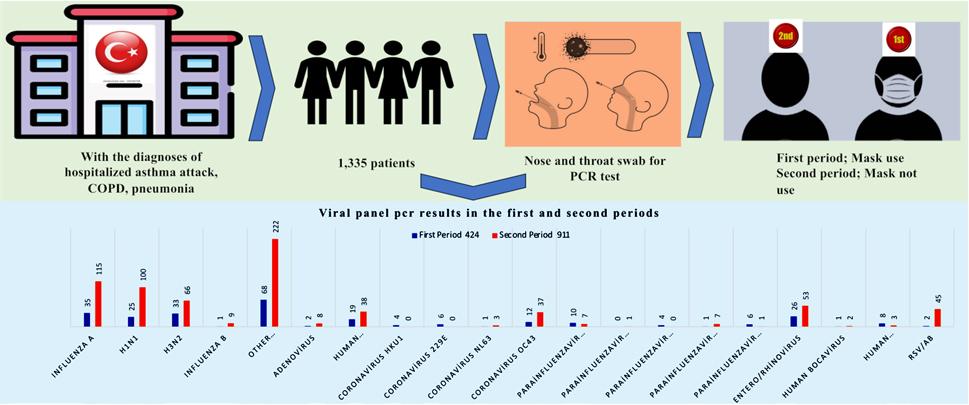
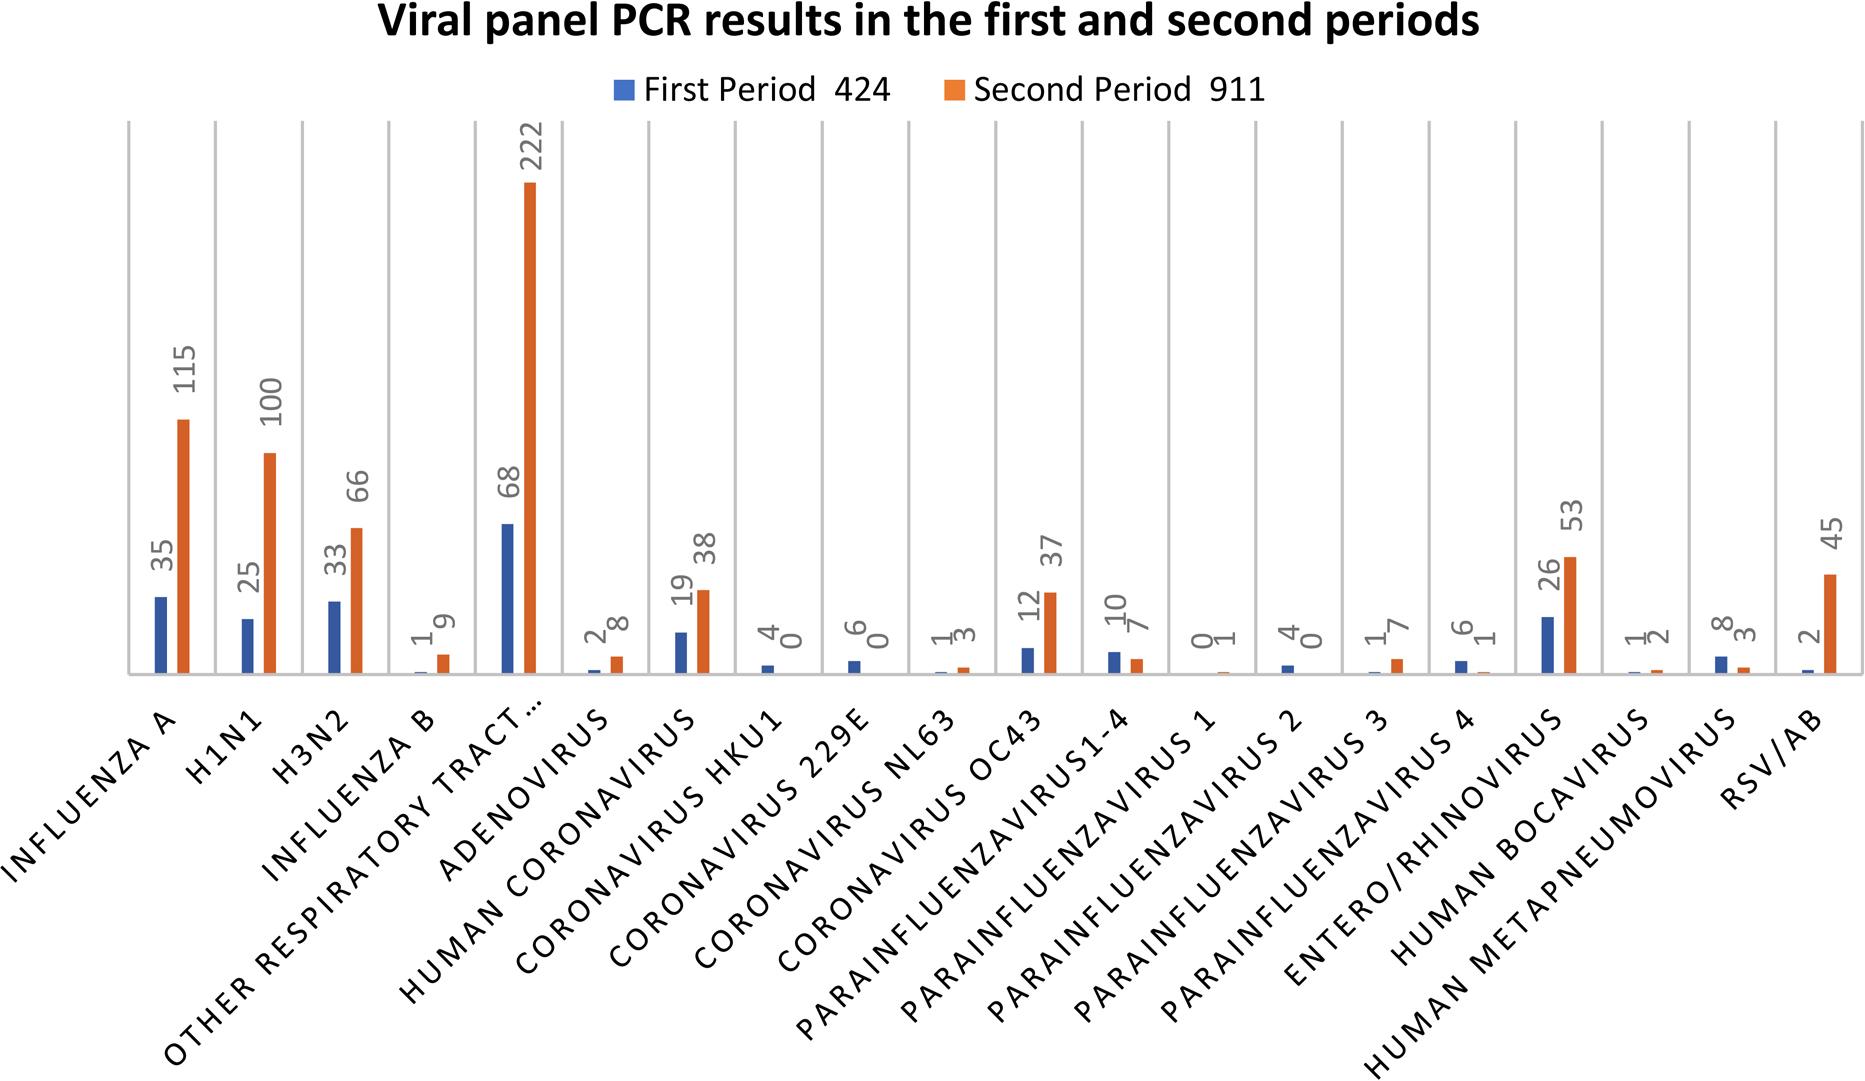
Viral and Mycoplasma panel PCR results in the first and second periods_
| First period (n = 424) n (%) | Second period (n = 911) n (%) | p-value | |
|---|---|---|---|
| Influenza A | 35 (8.3) | 115 (12.6) | 0.019 |
| H1N1 | 25 (5.9) | 100 (11) | 0.003 |
| H3N2 | 33 (7.8) | 66 (7.2) | 0.72 |
| Influenza B | 1 (0.2) | 9 (1) | 0.13 |
| Other Respiratory Tract Viruses | 68 (16) | 222 (116.6) | 0.69 |
| Adenovirus | 2 (0.5) | 8 (0.9) | 0.42 |
| Human Coronavirus | 19 (4.5) | 38 (4.2) | 0.78 |
| Coronavirus HKU1 | 4 (0.9) | 0 | 0.003 |
| Coronavirus 229E | 6 (1.4) | 0 | 0.000 |
| Coronavirus NL63 | 1 (0.2) | 3 (0.3) | 0.77 |
| Coronavirus OC43 | 12 (2.8) | 37 (4.1) | 0.26 |
| Parainfluenzavirus1–4 | 10 (2.4) | 7 (0.7) | 0.016 |
| Parainfluenzavirus 1 | 0 | 1 (0.1) | 0.49 |
| Parainfluenzavirus 2 | 4 (0.9) | 0 | 0.03 |
| Parainfluenzavirus 3 | 1 (0.2) | 7 (0.8) | 0.24 |
| Parainfluenzavirus 4 | 6 (1.4) | 1 (0.1) | 0.02 |
| Entero/Rhinovirus | 26 (6.1) | 53 (5.8) | 0.82 |
| Human Bocavirus | 1 (0.1) | 2 (0.2) | 0.95 |
| Human Metapneumovirus | 8 (1.9) | 3 (0.3) | 0.003 |
| RSV/AB | 2 (0.5) | 45 (4.9) | 0.000 |
| Parecohvirus | 0 | 0 | 0 |
| Bacteria | 0 | 0 | 0 |
| Mycoplasma spp. | 0 | 0 | 0 |
| 116 (23.4) | 379 (41.6) | 0.000 |