Fig. 1.
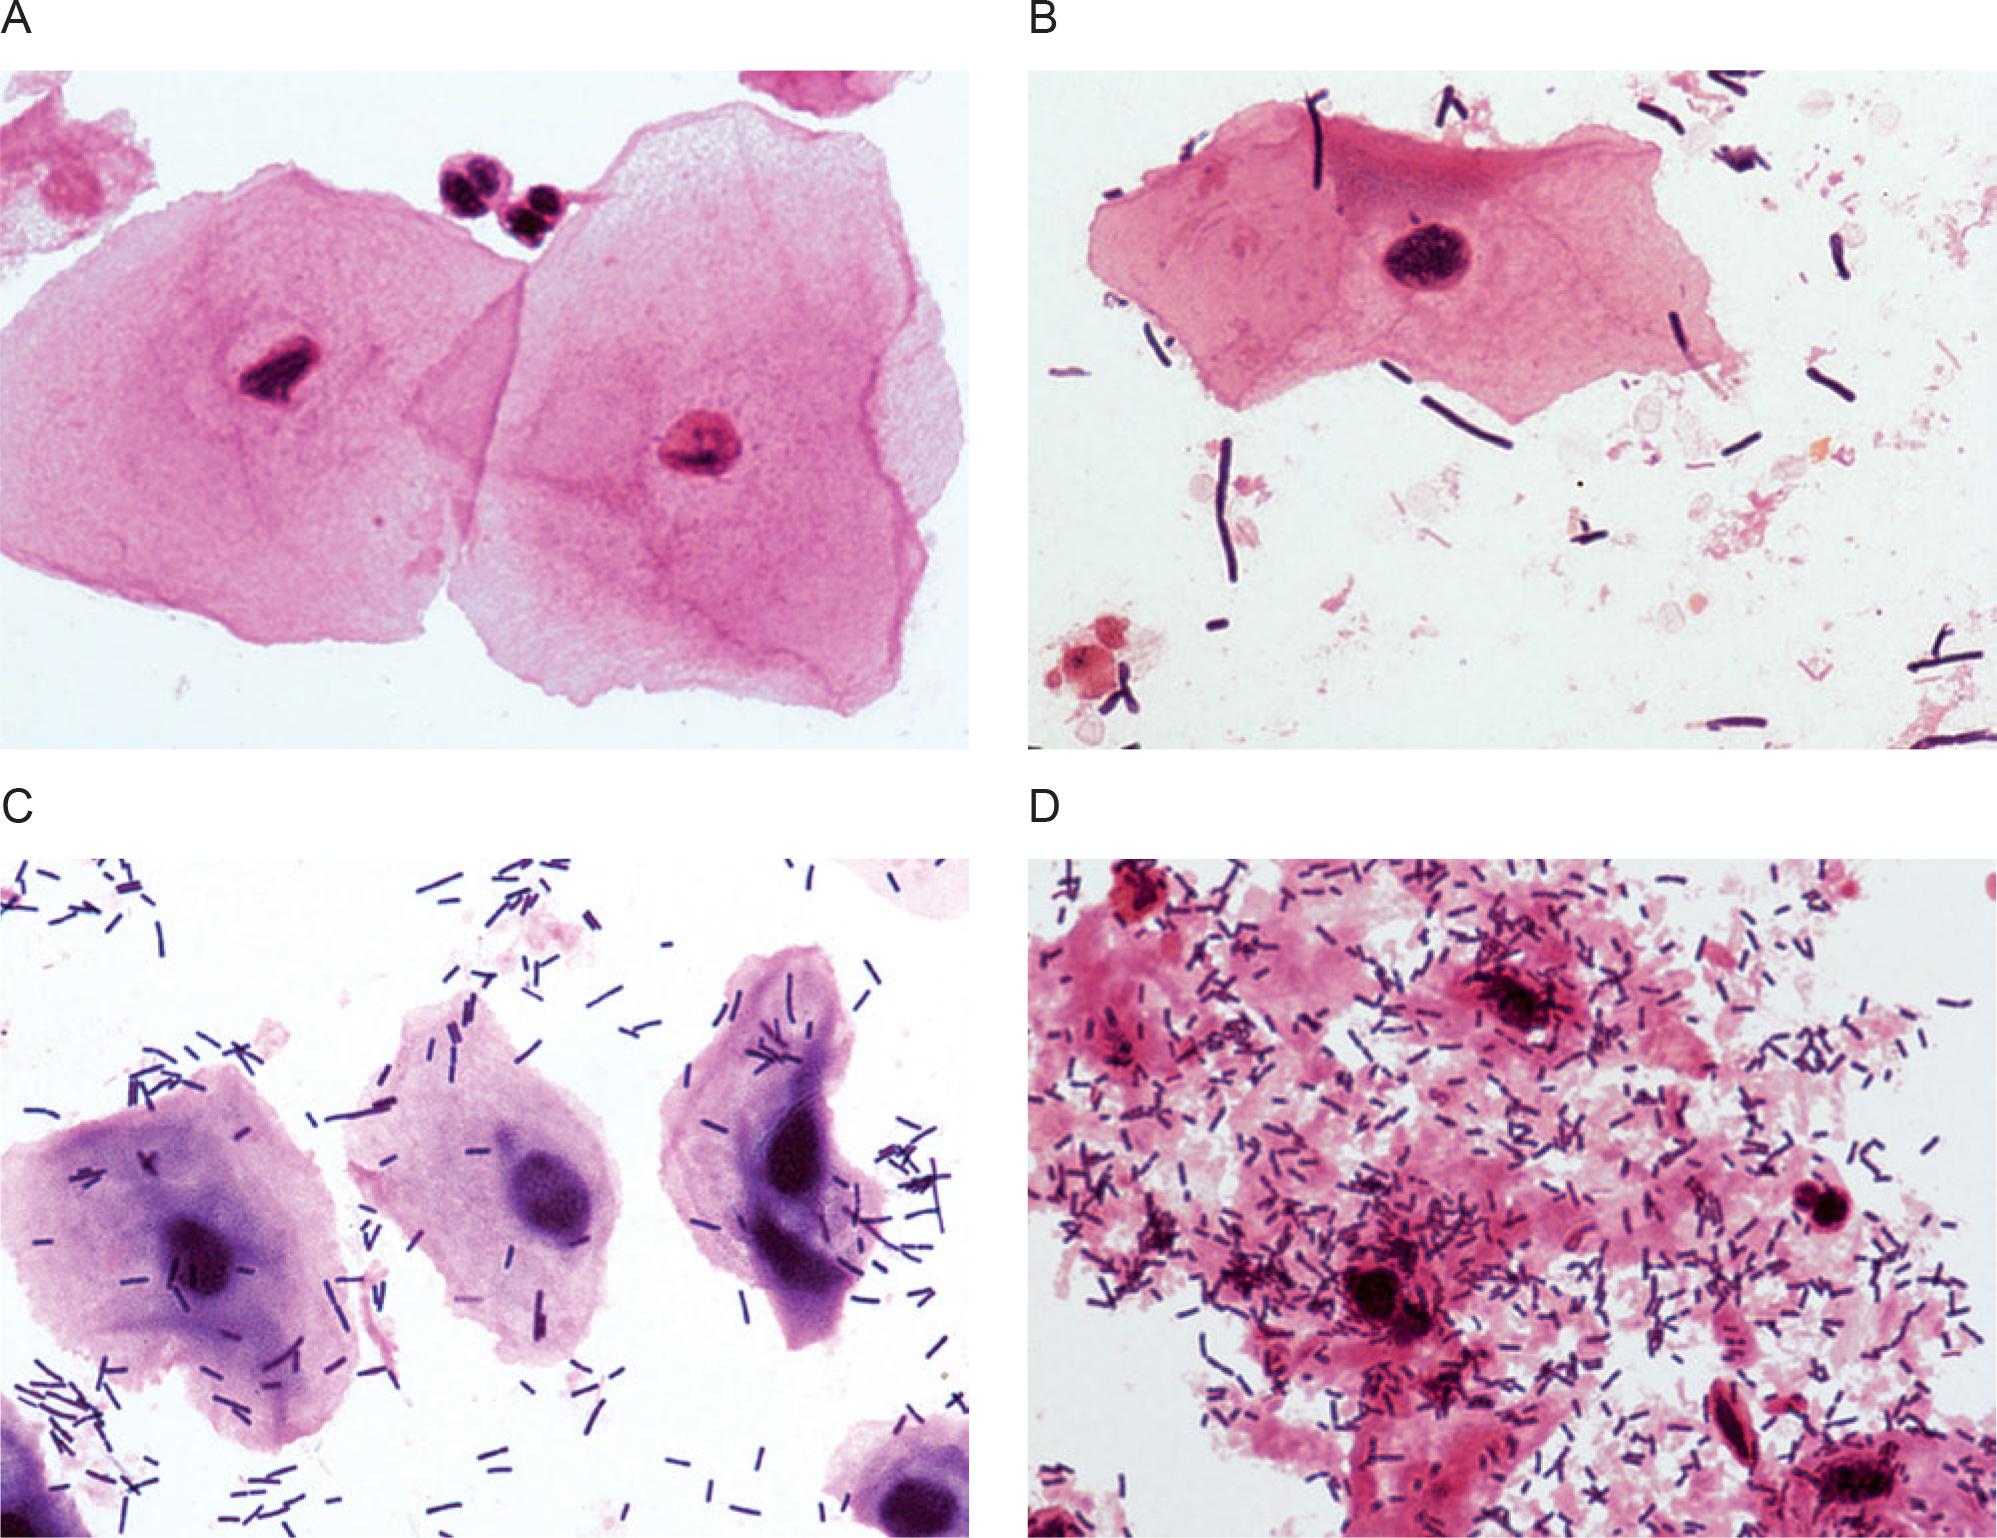
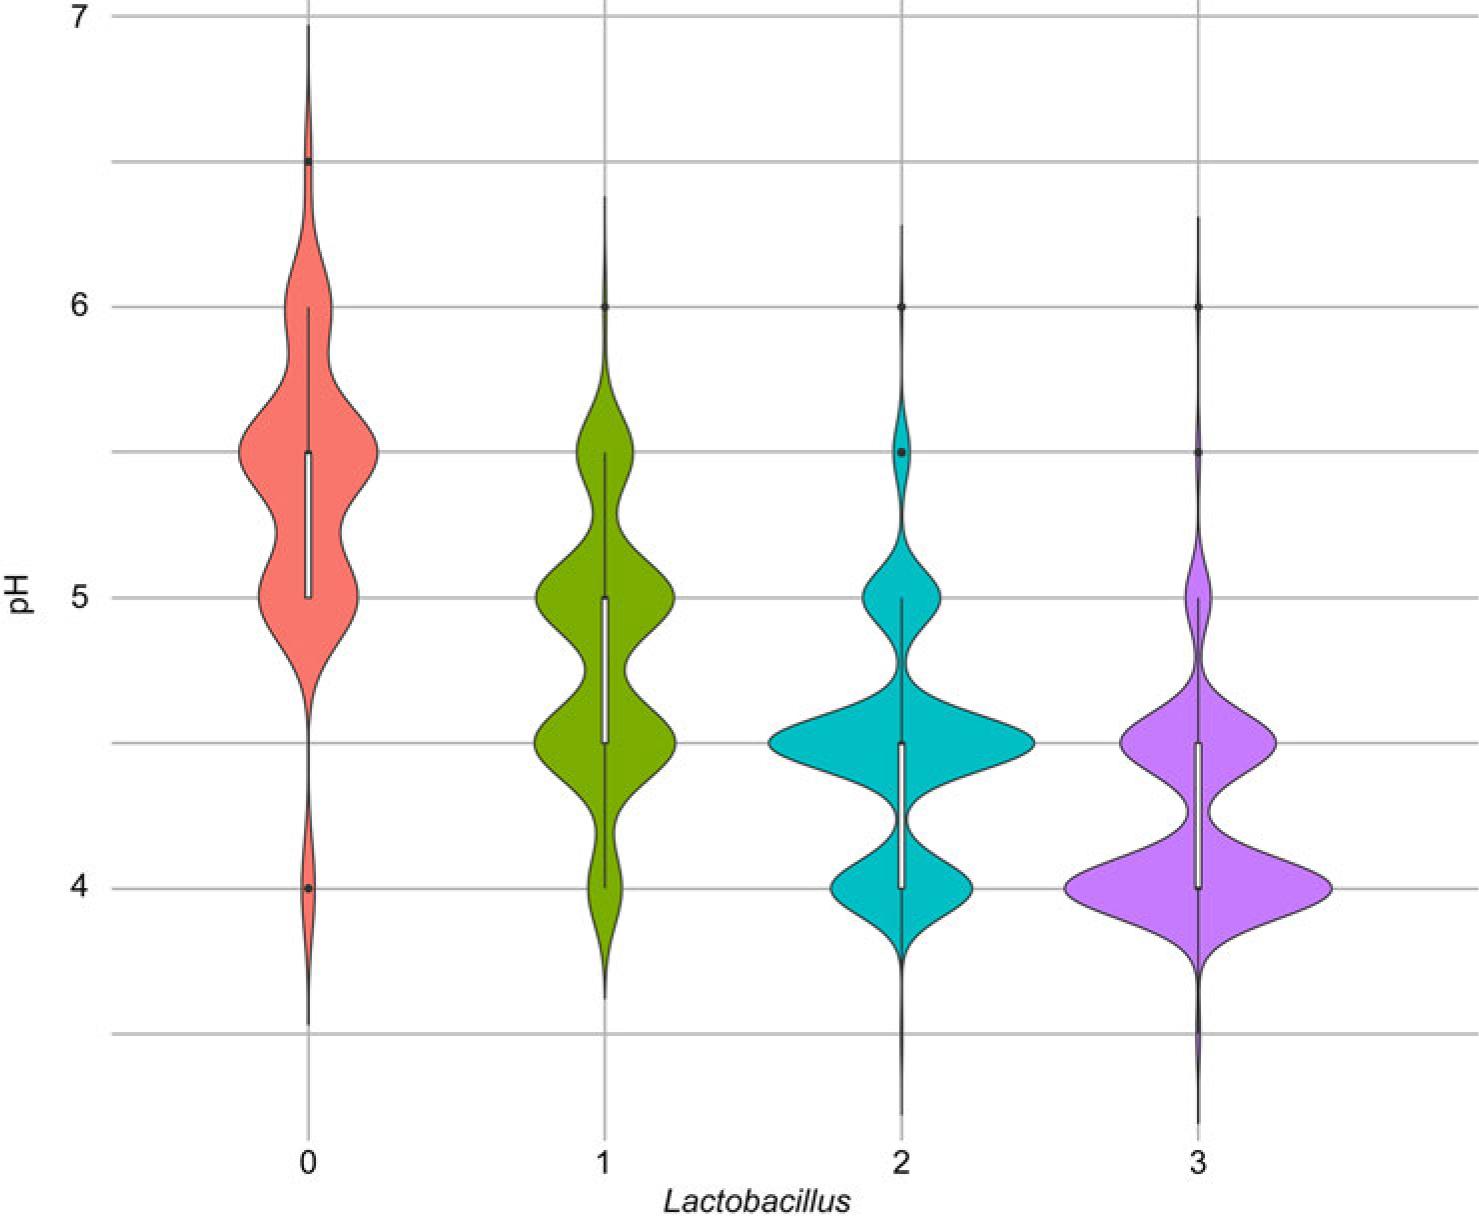
Fig. 2.
Relationship between the presence of Lactobacillus spp_ and other microorganisms_
| Microorganisms | Presence | n (%) | Lactobacillus spp.† | p-value* | |||
|---|---|---|---|---|---|---|---|
| 0 | 1 | 2 | 3 | ||||
| Gardnerella vaginalis | No | 988 (95.1%) | 30 (65.2%) | 108 (81.8%) | 600 (98.2%) | 250 (100%) | < 0.001 |
| Yes | 51 (4.9%) | 16 (34.8%) | 24 (18.2%) | 11 (1.8%) | 0 (0%) | – | |
| Ureaplasma parvum | No | 874 (84.1%) | 36 (78.3%) | 109 (82.6%) | 520 (85.1%) | 209 (83.6%) | 0.542 |
| Yes | 165 (15.9%) | 10 (21.7%) | 23 (17.4%) | 91 (14.9%) | 41 (16.4%) | – | |
| Ureaplasma urealyticum | No | 959 (92.3%) | 40 (87.0%) | 119 (90.2%) | 566 (92.6%) | 234 (93.6%) | 0.299 |
| Yes | 80 (7.7%) | 6 (13.0%) | 13 (9.8%) | 45 (7.4%) | 16 (6.4%) | – | |
| Mycoplasma hominis | No | 1020 (98.2%) | 42 (91.3%) | 129 (97.7%) | 601 (98.4%) | 248 (99.2%) | 0.0153 |
| Yes | 19 (1.8%) | 4 (8.7%) | 3 (2.3%) | 10 (1.6%) | 2 (0.8%) | – | |
| Mycoplasma genitalium | No | 1038 (99.9%) | 45 (97.8%) | 132 (100%) | 611 (100%) | 250 (100%) | 0.0443 |
| Yes | 1 (0.1%) | 1 (2.2%) | 0 (0%) | 0 (0%) | 0 (0%) | – | |
| Chlamydia trachomatis | No | 1031 (99.2%) | 46 (100%) | 131 (99.2%) | 606 (99.2%) | 248 (99.2%) | 1.000 |
| Yes | 8 (0.8%) | 0 (0%) | 1 (0.8%) | 5 (0.8%) | 2 (0.8%) | – | |
| Enterobacterales | No | 984 (94.7%) | 36 (78.3%) | 112 (84.8%) | 590 (96.6%) | 246 (98.4%) | < 0.001 |
| Yes | 55 (5.3%) | 10 (21.7%) | 20 (15.2%) | 21 (3.4%) | 4 (1.6%) | – | |
| Streptococcus group B | No | 958 (92.2%) | 34 (73.9%) | 108 (81.8%) | 571 (93.5%) | 245 (98.0%) | < 0.001 |
| Yes | 81 (7.8%) | 12 (26.1%) | 24 (18.2%) | 40 (6.5%) | 5 (2.0%) | – | |
| Yeast | No | 862 (83.0%) | 39 (84.8%) | 111 (84.1%) | 506 (82.8%) | 206 (82.4%) | 0.976 |
| Yes | 177 (17.0%) | 7 (15.2%) | 21 (15.9%) | 105 (17.2%) | 44 (17.6%) | – | |
| Neisseria gonorhoeae | No | 1039 (100%) | 46 (100%) | 132 (100%) | 611 (100%) | 250 (100%) | – |
| Yes | 0 (0.0%) | 0 (0.0%) | 0 (0.0%) | 0 (0.0%) | 0 (0.0%) | – | |
| Trichomonas vaginalis | No | 1039 (100%) | 46 (100%) | 132 (100%) | 611 (100%) | 250 (100%) | – |
| Yes | 0 (0.0%) | 0 (0.0%) | 0 (0.0%) | 0 (0.0%) | 0 (0.0%) | – | |
The pH values in women with and without the occurrence of microorganisms_
| Microorganisms | Not prevalent | Prevalent | p* | pH > 4.5 | p** | ||
|---|---|---|---|---|---|---|---|
| n | Q2 (Q1–Q3) | n | Q2 (Q1–Q3) | OR (95% CI)** | |||
| Lactobacillus spp. | 46 | 5.5 (5.0; 5.5) | 993 | 4.5 (4.0; 4.5) | < 0.001 | 0.01 (0.00; 0.05) | < 0.001 |
| Gardnerella vaginalis | 988 | 4.5 (4.0; 4.5) | 51 | 5.0 (5.0; 5.5) | < 0.001 | 12.18 (6.31; 23.48) | < 0.001 |
| Ureaplasma parvum | 874 | 4.5 (4.0; 4.5) | 165 | 4.5 (4.5; 5.0) | < 0.001 | 1.74 (1.21; 2.50) | 0.003 |
| Ureaplasma urealyticum | 959 | 4.5 (4.0; 4.5) | 80 | 4.5 (4.4; 5.0) | 0.009 | 2.36 (1.47; 3.78) | < 0.001 |
| Mycoplasma hominis | 1020 | 4.5 (4.0; 4.5) | 19 | 4.5 (4.5; 5.0) | 0.014 | 2.88 (1.18; 7.01) | 0.020 |
| Mycoplasma genitalium | 1038 | 4.5 (4.0; 4.5) | 1 | 5.0 (5.0; 5.0) | 0.203 | 11.50 (0.46; 284.64) | 0.136 |
| Chlamydia trachomatis | 1031 | 4.5 (4.0; 4.5) | 8 | 4.5 (4.4; 4.6) | 0.698 | 1.27 (0.29; 5.52) | 0.748 |
| Enterobacterales | 984 | 4.5 (4.0; 4.5) | 55 | 5.0 (4.5; 5.0) | < 0.001 | 6.10 (3.47; 10.74) | < 0.001 |
| Streptococcus group B | 958 | 4.5 (4.0; 4.5) | 81 | 5.0 (4.5; 5.0) | < 0.001 | 5.06 (3.17; 8.06) | < 0.001 |
| Yeast | 862 | 4.5 (4.0; 4.5) | 177 | 4.5 (4.5; 5.0) | 0.001 | 1.66 (1.16; 2.37) | 0.005 |
Occurrence of individual microorganisms in women with and without symptoms qualified for the study and the microbiological methods used_
| Microorganisms | Method | Total | Without symptoms (n = 752) | With symptoms (n = 287) | p-value* | OR# (95% CI) | p-value** | |
|---|---|---|---|---|---|---|---|---|
| n (%) | n (%) | n (%) | ||||||
| Lactobacillus spp.† | 0 | microscopic | 46 (4.4%) | 19 (2.5%) | 27 (9.4%) | < 0.001 | 1 (REF.) | – |
| 1 | 132 (12.7%) | 90 (12.0%) | 42 (14.6%) | 0.33 (0.17; 0.66) | 0.002 | |||
| 2 | 611 (58.8%) | 451 (60.0%) | 160 (55.7%) | 0.25 (0.14; 0.46) | < 0.001 | |||
| 3 | 250 (24.1%) | 192 (25.5%) | 58 (20.2%) | 0.22 (0.11; 0.41) | < 0.001 | |||
| Gardnerella vaginalis | culture, microscopic | 51 (4.9%) | 11 (1.5%) | 40 (13.9%) | < 0.001 | 10.55 (5.40; 20.63) | < 0.001 | |
| Ureaplasma parvum | PCR | 165 (15.9%) | 81 (10.8%) | 84 (29.3%) | < 0.001 | 3.42 (2.43; 4.82) | < 0.001 | |
| Ureaplasma urealyticum | PCR | 80 (7.7%) | 27 (3.6%) | 53 (18.5%) | < 0.001 | 6.02 (3.71; 9.75) | < 0.001 | |
| Mycoplasma hominis | PCR | 19 (1.8%) | 0 (0%) | 19 (6.6%) | < 0.001 | 109.30 (6.58; 1,816.53) | 0.001 | |
| Mycoplasma genitalium | PCR | 1 (0.1%) | 0 (0%) | 1 (0.3%) | 0.276 | 7.88 (0.32; 193.98) | 0.207 | |
| Chlamydia trachomatis | PCR | 8 (0.8%) | 1 (0.1%) | 7 (2.4%) | < 0.001 | 13.40 (2.31; 77.74) | 0.004 | |
| Enterobacterales | culture | 55 (5.3%) | 35 (4.7%) | 20 (7.0%) | 0.162 | 1.55 (0.88; 2.72) | 0.127 | |
| Streptococcus group B | culture | 81 (7.8%) | 57 (7.6%) | 24 (8.4%) | 0.698 | 1.12 (0.69; 1.84) | 0.641 | |
| Yeast | culture, microscopic | 177 (17.0%) | 100 (13.3%) | 77 (26.8%) | < 0.001 | 2.39 (1.71; 3.34) | < 0.001 | |
| Neisseria gonorrhoeae | culture | 0 (0.0%) | 0 (0.0%) | 0 (0.0%) | – | – | – | |
| Trichomonas vaginalis | culture | 0 (0.0%) | 0 (0.0%) | 0 (0.0%) | – | – | – | |
Relationship between the occurrence microorganisms and symptoms_
| Microorganisms | Model 1 | Model 2 | Model 3 | ||||
|---|---|---|---|---|---|---|---|
| OR# (95% CI) | p-value** | OR# (95% CI) | p-value** | OR# (95% CI) | p-value** | ||
| Lactobacillus spp.† | 1 | 0.31 (0.15; 0.61) | < 0.001 | 0.42 (0.20; 0.87) | 0.019 | 0.33 (0.16; 0.69) | 0.003 |
| 2 | 0.23 (0.12; 0.43) | < 0.001 | 0.38 (0.19; 0.76) | 0.006 | 0.27 (0.13; 0.54) | < 0.001 | |
| 3 | 0.20 (0.10; 0.38) | < 0.001 | 0.38 (0.18; 0.81) | 0.012 | 0.23 (0.10; 0.50) | < 0.001 | |
| Gardnerella vaginalis | 10.47 (5.36; 20.47) | < 0.001 | 7.83 (3.93; 15.61) | < 0.001 | 10.03 (4.92; 20.47) | < 0.001 | |
| Ureaplasma parvum | 3.40 (2.42; 4.79) | < 0.001 | 3.18 (2.25; 4.50) | < 0.001 | 2.93 (2.06; 4.16) | < 0.001 | |
| Ureaplasma urealyticum | 5.98 (3.69; 9.69) | < 0.001 | 5.69 (3.49; 9.28) | < 0.001 | 5.56 (3.40; 9.09) | < 0.001 | |
| Mycoplasma hominis | 111.18 (6.71; 1,842.58) | 0.001 | 98.35 (5.93; 1,631.18) | 0.001 | 94.56 (5.72; 1,563.34) | 0.001 | |
| Chlamydia trachomatis | 13.21 (2.28; 76.60) | 0.004 | 13.56 (2.31; 79.70) | 0.004 | 10.12 (1.69; 60.80) | 0.011 | |
| Yeast | 2.38 (1.70; 3.32) | < 0.001 | 2.24 (1.59; 3.14) | < 0.001 | 1.93 (1.36; 2.74) | < 0.001 | |
The association between presence of Lactobacillus and other microorganisms – multivariable logistic regression models_
| Microorganisms | Lactobacillus as ordered variable† | Lactobacillus as dichotomous variable†† | ||||
|---|---|---|---|---|---|---|
| Per 1 category level increase | Not present | Present | Not present | Present | ||
| Model 1 | Model 2 | Model 1 | Model 2 | |||
| Yeast | 1.04 (0.83; 1.30) | 1.32 (1.02; 1.71) | 1 (REF.) | 0.97 (0.43; 2.18) | 1 (REF.) | 1.69 (0.70; 4.07) |
| Enterobacterales | 0.35 (0.25; 0.48) | 0.54 (0.37; 0.81) | 1 (REF.) | 0.19 (0.09; 0.40) | 1 (REF.) | 0.78 (0.31; 1.97) |
| Streptococcus group B | 0.40 (0.30; 0.52) | 0.63 (0.45; 0.89) | 1 (REF.) | 0.23 (0.11; 0.47) | 1 (REF.) | 0.99 (0.42; 2.29) |
| Gardnerella_vaginalis | 0.14 (0.09; 0.21) | 0.20 (0.12; 0.32) | 1 (REF.) | 0.05 (0.02; 0.11) | 1 (REF.) | 0.21 (0.09; 0.51) |
| Chlamydia_trachomatis | 1.12 (0.45; 2.79) | 1.39 (0.52; 3.75) | 1 (REF.) | 0.67 (0.04; 11.0) | 1 (REF.) | 1.19 (0.06; 24.33) |
| Mycoplasma_hominis | 0.47 (0.28; 0.78) | 0.61 (0.32; 1.16) | 1 (REF.) | 0.16 (0.05; 0.49) | 1 (REF.) | 0.32 (0.08; 1.32) |
| Ureaplasma_parvum | 0.91 (0.72; 1.13) | 1.16 (0.89; 1.50) | 1 (REF.) | 0.58 (0.28; 1.19) | 1 (REF.) | 1.02 (0.46; 2.26) |
| Ureaplasma_urealyticum | 0.75 (0.56; 1.01) | 0.88 (0.62; 1.25) | 1 (REF.) | 0.45 (0.19; 1.07) | 1 (REF.) | 0.70 (0.26; 1.90) |