
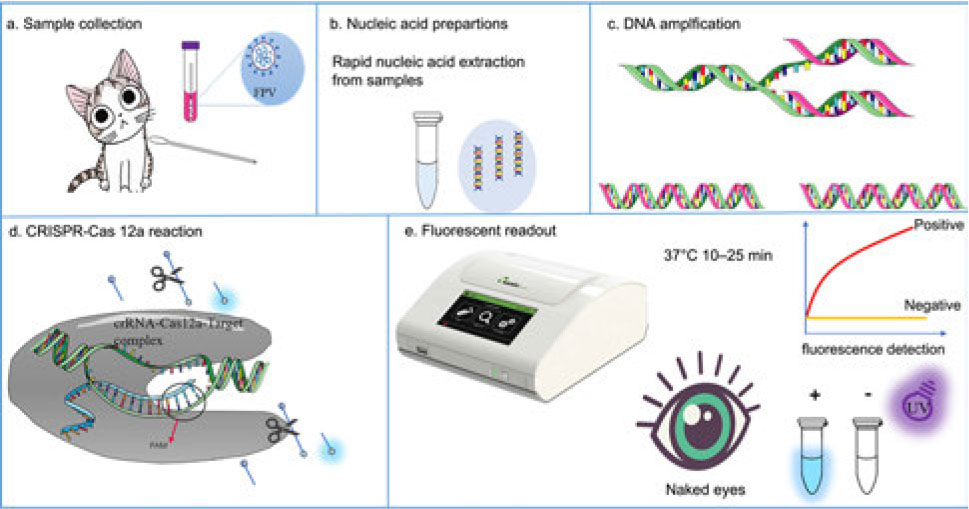
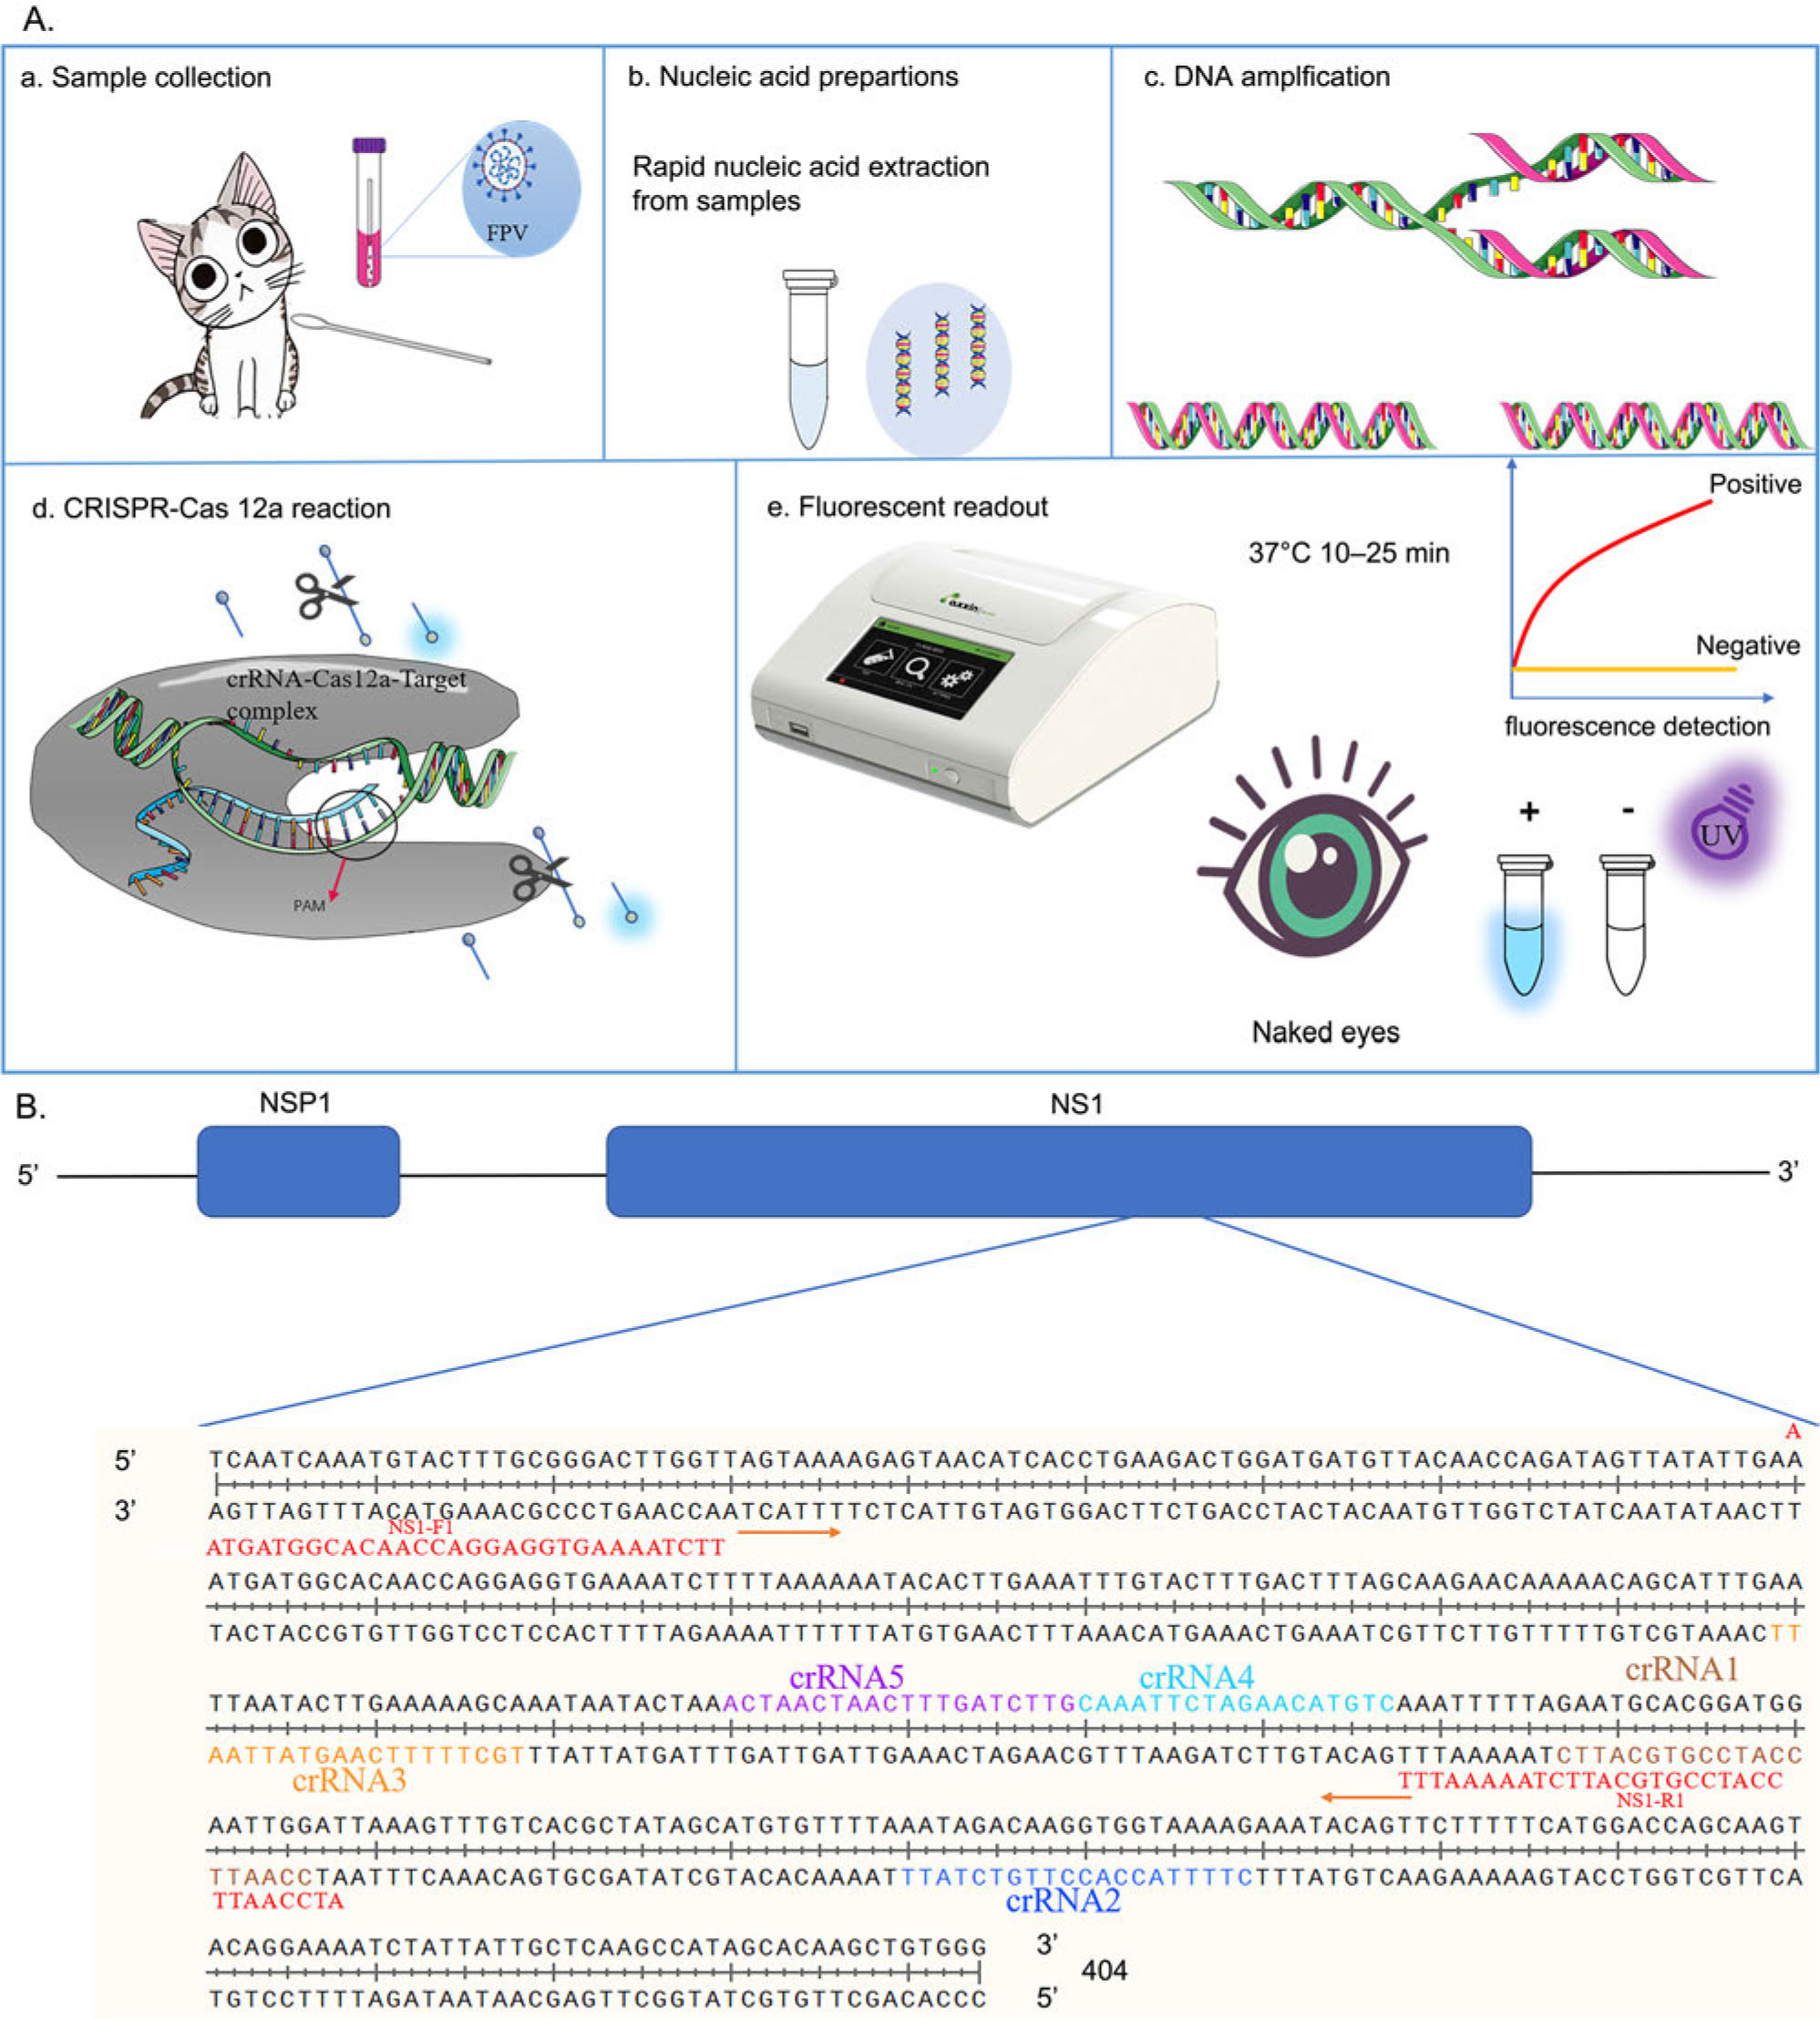
Fig. 1.
The schematic flow of RPA-Cas12a-based fluorescence assay for the detection of feline parvovirus virus (FPV) by combining recombinase polymerase amplification (RPA) and CRISPR/Cas12a (A). The genomic DNA of FPV was extracted from clinical samples and amplified using RPA to prepare double-stranded DNA (dsDNA) at 37°C. Then, CRISPR/Cas12a was activated by the complex of amplified products of the target gene, Cas12a, and crRNA, and the single-stranded DNA molecules (ssDNA reporter) were cut to produce fluorescence signals. Finally, the readout of the RPA-Cas12a-fluorescence assay was obtained using real-time or end-point fluorescence and naked eyes using the corresponding simple device. Visualization of primers for RPA and crRNA spacer sites to detect Cas12a within the target nonstructural protein 1 (NS1) gene of FPV genome (B). Primers and crRNA are indicated by red and yellow colored text, respectively.
Table I
The oligonucleotide sequences for primers and crRNA for the RPA-Cas12a-based fluorescence assay of FPV.
| Oligonucleotide name | Sequence (5′–3′) |
|---|---|
| NS1-F1 | AATGATGGCACAACCAGGAGGTGAAAATCTT |
| NS1-R1 | ATCCAATTCCATCCGTGCATTCTAAAAATTT |
| NS1-F2 | TTAGAATGCACGGATGGAATTGGATTAAAG |
| NS1-R2 | CCACAGCTTGTGCTATGGCTTGAGCAATAA |
| NS1-F3 | TGATGGCACAACCAGGAGGTGAAAATCTTT |
| NS1-R3 | AATCCAATTCCATCCGTGCATTCTAAAAAT |
| NS1-F4 | TTTAGAATGCACGGATGGAATTGGATTAAAG |
| NS1-R4 | CACAGCTTGTGCTATGGCTTGAGCAATAAT |
| ssDNA reporter | FAM-TTATTATT-BHQ |
| crRNA1-F | GAAATTAATACGACTCACTATAGTAATTTCTACTAAGTGTAGATGAATGCACGGATGGAATTGG |
| crRNA1-R | CCAATTCCATCCGTGCATTCATCTACACTTAGTAGAAATTACTATAGTGAGTCGTATTAATTTC |
| crRNA2-F | GAAATTAATACGACTCACTATAGTAATTTCTACTAAGTGTAGATAATAGACAAGGTGGTAAAAG |
| crRNA2-R | CTTTTACCACCTTGTCTATTATCTACACTTAGTAGAAATTACTATAGTGAGTCGTATTAATTTC |
| crRNA3-F | GAAATTAATACGACTCACTATAGTAATTTCTACTAAGTGTAGATAATTAATACTTGAAAAAGCA |
| crRNA3-R | TGCTTTTTCAAGTATTAATTATCTACACTTAGTAGAAATTACTATAGTGAGTCGTATTAATTTC |
| crRNA4-F | GAAATTAATACGACTCACTATAGTAATTTCTACTAAGTGTAGATGACATGTTCTAGAATTTGCA |
| crRNA4-R | TGCAAATTCTAGAACATGTCATCTACACTTAGTAGAAATTACTATAGTGAGTCGTATTAATTTC |
| crRNA5-F | GAAATTAATACGACTCACTATAGTAATTTCTACTAAGTGTAGATCAAGATCAAAGTTAGTTAGT |
| crRNA5-R | ACTAACTAACTTTGATCTTGATCTACACTTAGTAGAAATTACTATAGTGAGTCGTATTAATTTC |
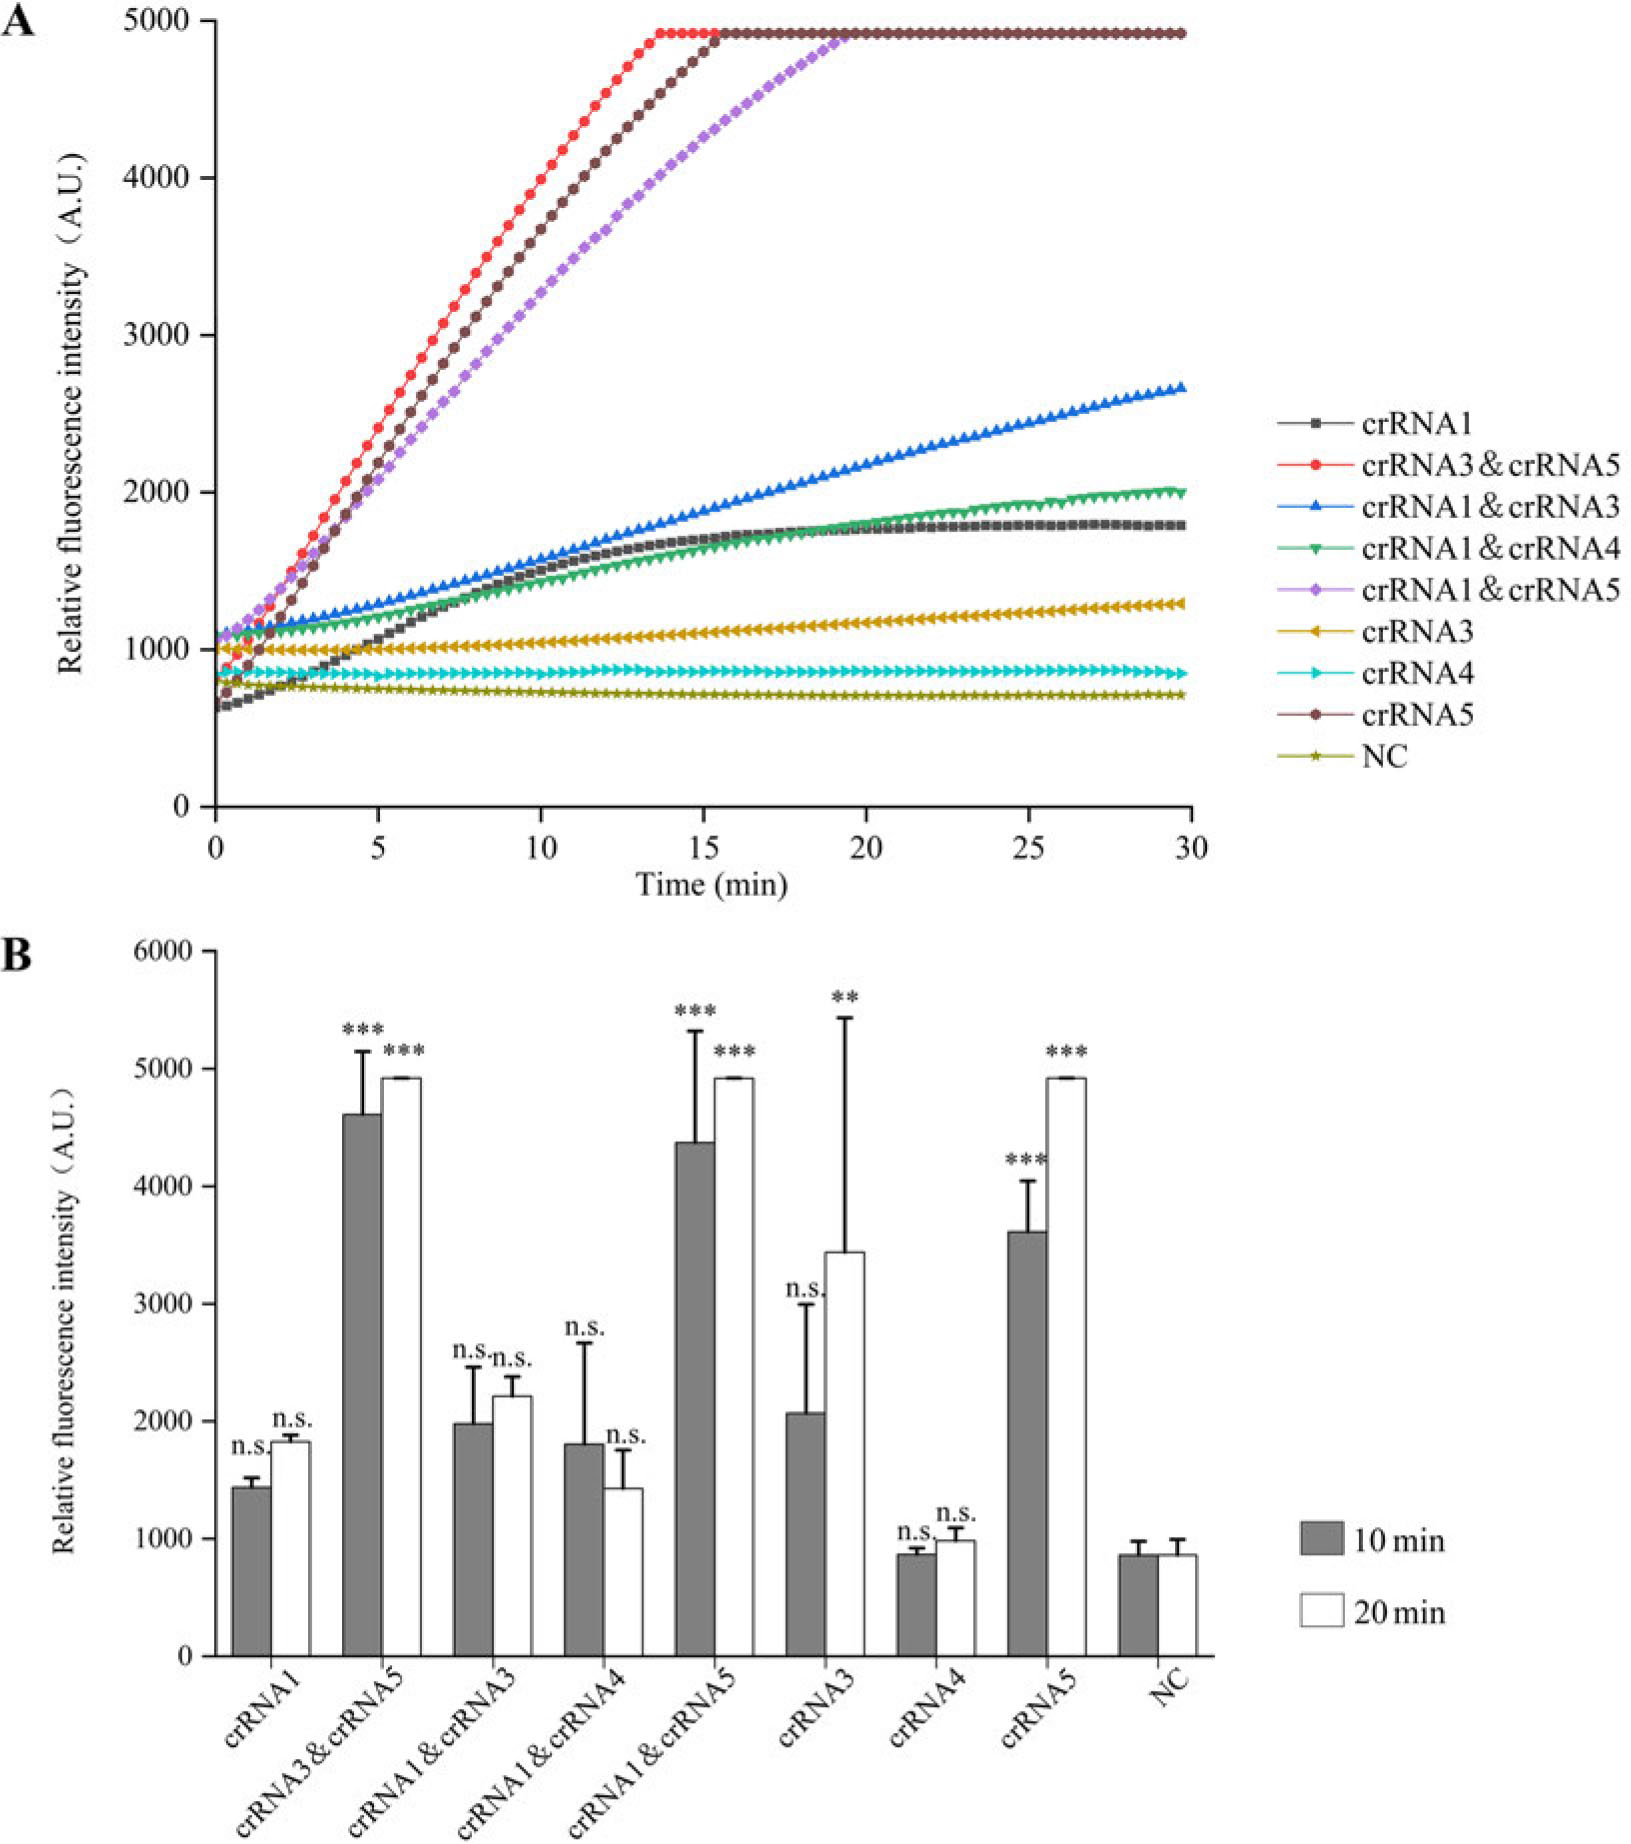
Fig. 2.
Examination of optimal crRNA for RPA-Cas12a-based fluorescence assay for the detection of FPV.
The fluorescence readouts of RPA-Cas12a-fluorescence real-time (A) and end-point (B) assay were shown using different crRNA or a combination of crRNA for 30 min at 37°C, respectively. Error bars represent the standard deviation of the data (n = 3). Statistical analysis was applied to evaluate the statistical significance between treated groups and the negative control (NC).
**p < 0.05, ***p < 0.001, and n.s. – no significant differences
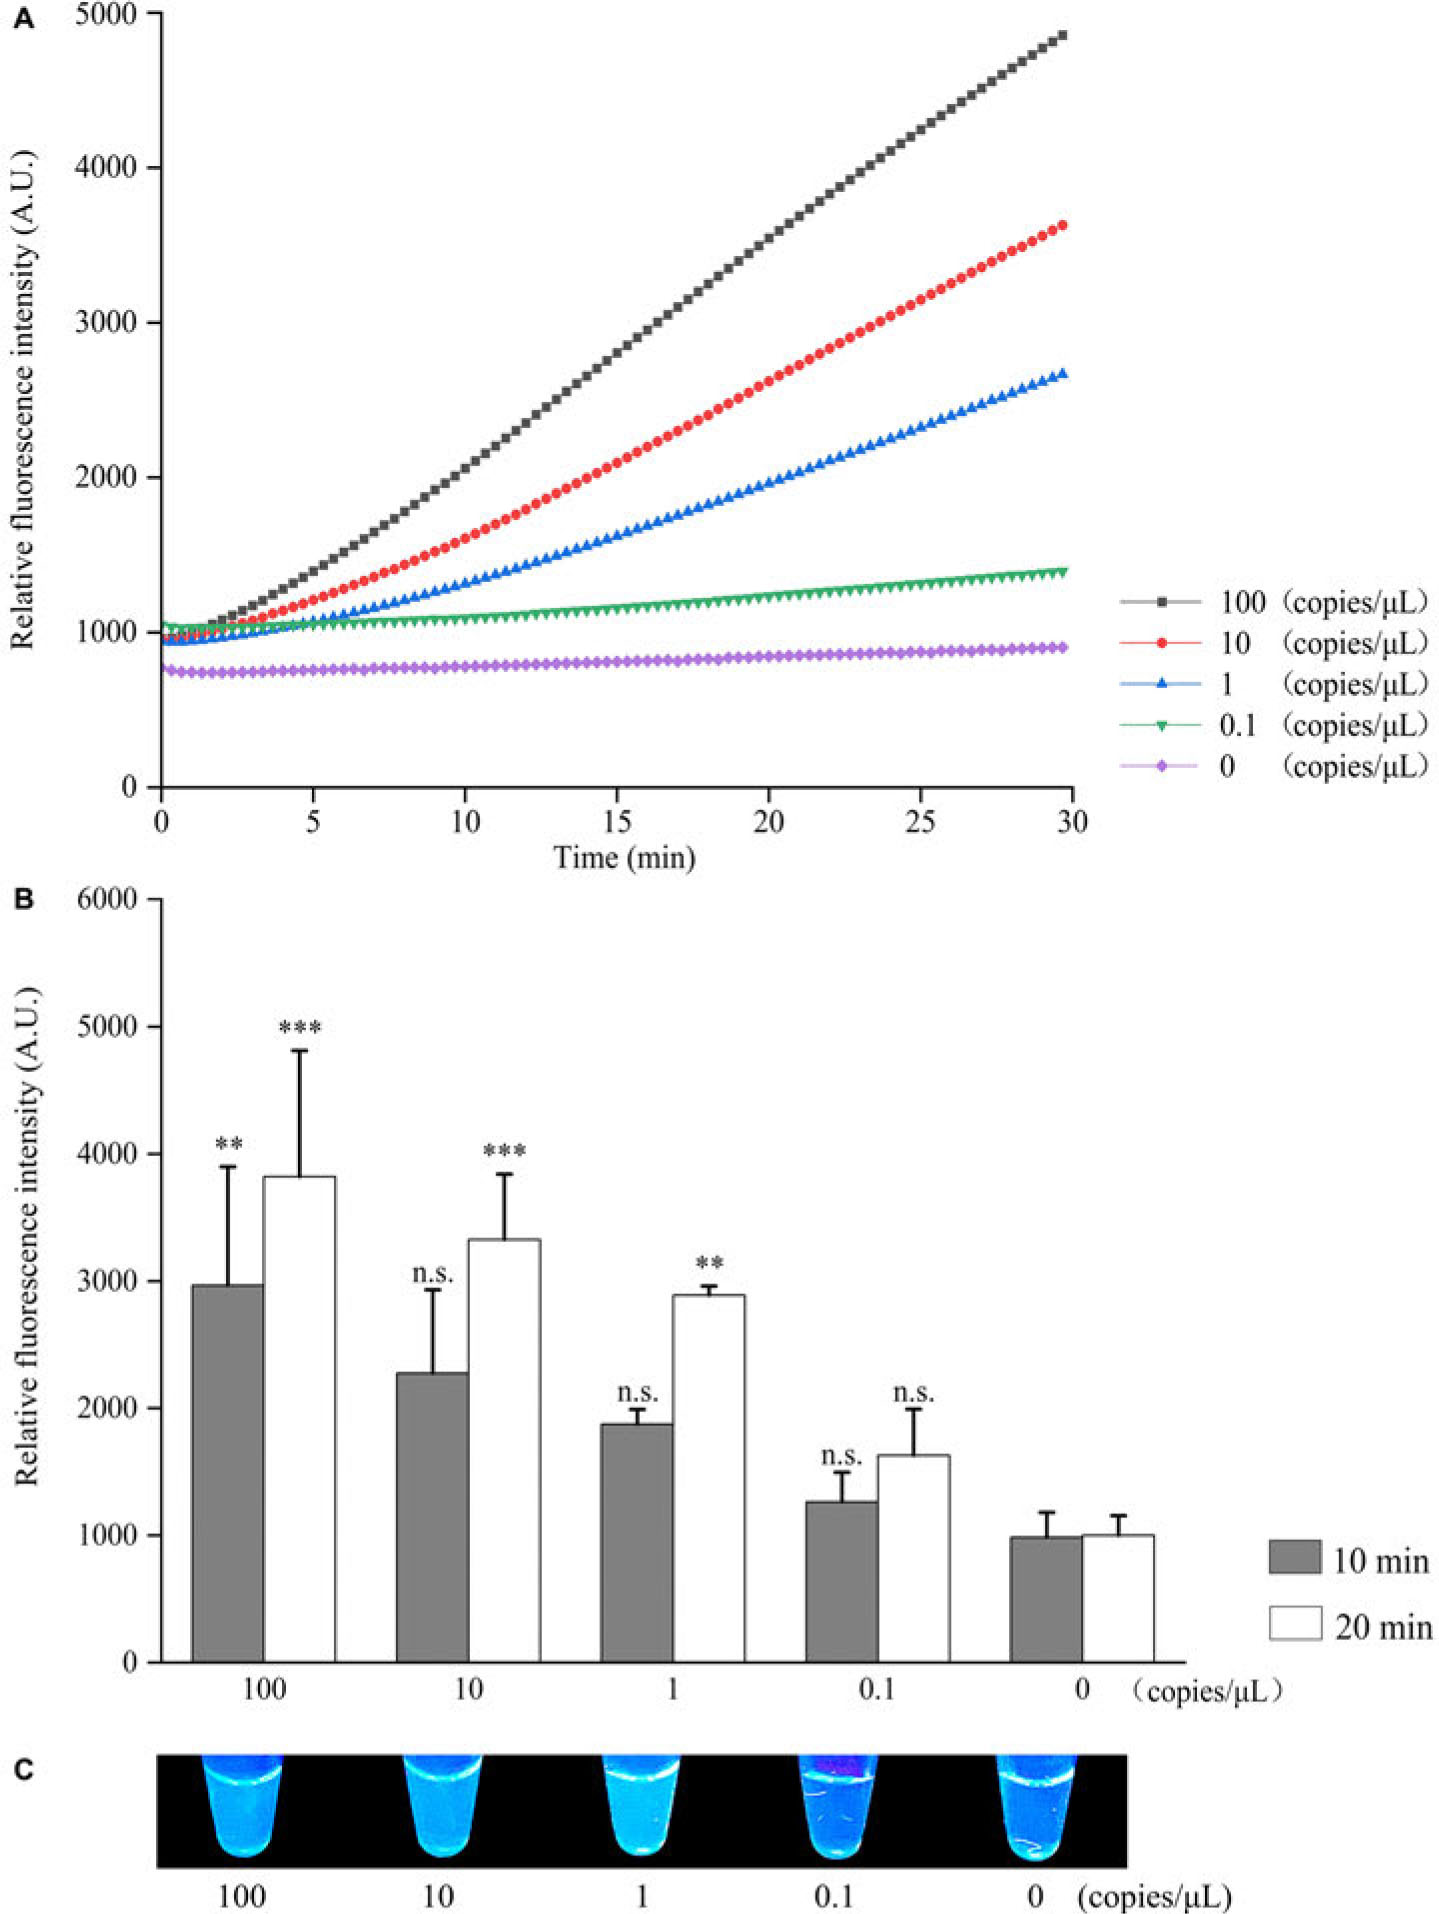
Fig. 3.
Examination of sensitivity of RPA-Cas12a-based fluorescence assay. An increase in the fluorescence intensity with increasing the template concentration of the target gene from 0.1 to 100 copies/μl was observed according to real-time (A) and end-point (B) fluorescence readouts. In addition, the color shift between 1 or higher and 0.1 or lower copies/μl was visualized by the naked eye (C). Error bars represent the standard deviation of the data (n = 3).
Statistical analysis was used to assess the difference between treated groups and the corresponding time point of negative control (NC).
**p < 0.05, *** p < 0.001, and n.s. – no significant differences
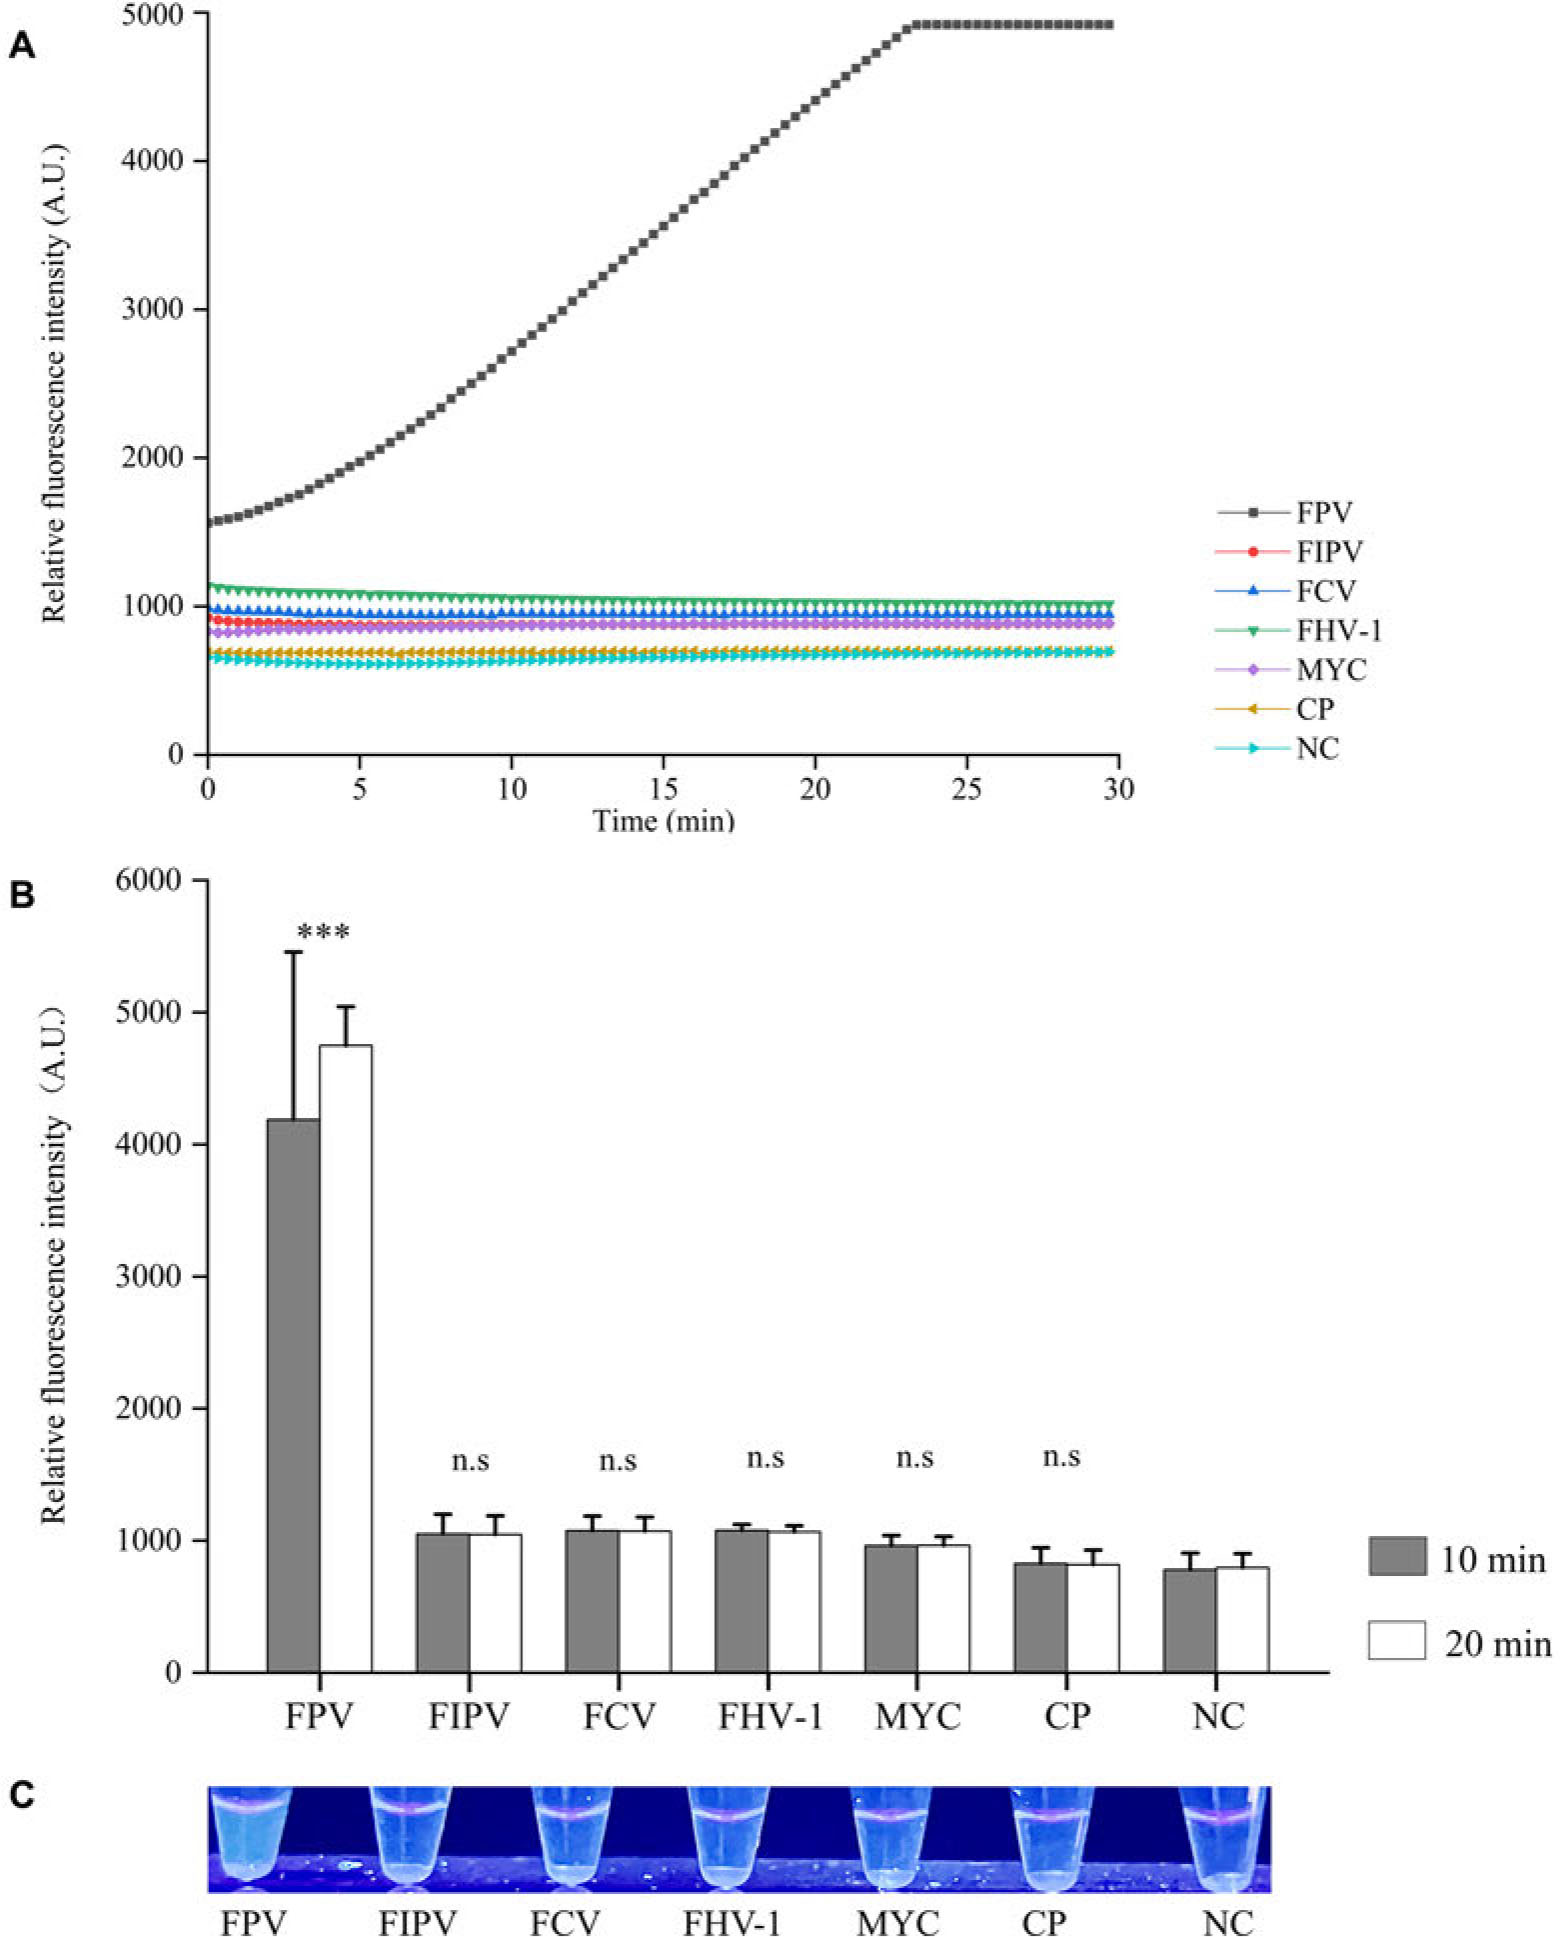
Fig. 4.
Assessment of specificity of RPA-Cas12a-based fluorescence assay. The specificity of RPA-Cas12a-based fluorescence assay for FPV detection was investigated using genomic DNA extracted from FPV, feline calicivirus/Cat/Shanghai/01/2021 (FCV), feline herpesvirus-1/Cat/Shanghai/01/2014 (FHV-1), feline infectious peritonitis virus VR-990 (FIPV), feline Mycoplasma felis ATCC® 23391™ (MYC), and Chlamydia psittaci ATCC® VR-120™ (CP) as the template. Only FPV produced fluorescence signals according to real-time (A), end-point (B) fluorescence, and the naked eye (C) readouts. Error bars indicate the standard deviations of the data (n = 3). Statistical analysis was used to examine the difference between treated groups and negative control (NC). ***p < 0.001, and n.s. – no significant differences
Table II
Statistical analysis of FPV detection in clinical samples using the RPA-Cas12a-based fluorescence assay and qPCR. The difference was statistically significant, as determined via the DiagnosticTest using openepi software.
| qPCR | Positive | Negative | Total | Consistency rate | |
|---|---|---|---|---|---|
| RPA-Cas12a-based fluorescence | Positive | 28 | 0 | 28 | 96.67% |
| Negative | 2 | 30 | 32 | ||
| Total | 30 | 30 | 60 | ||