
Fig. 1
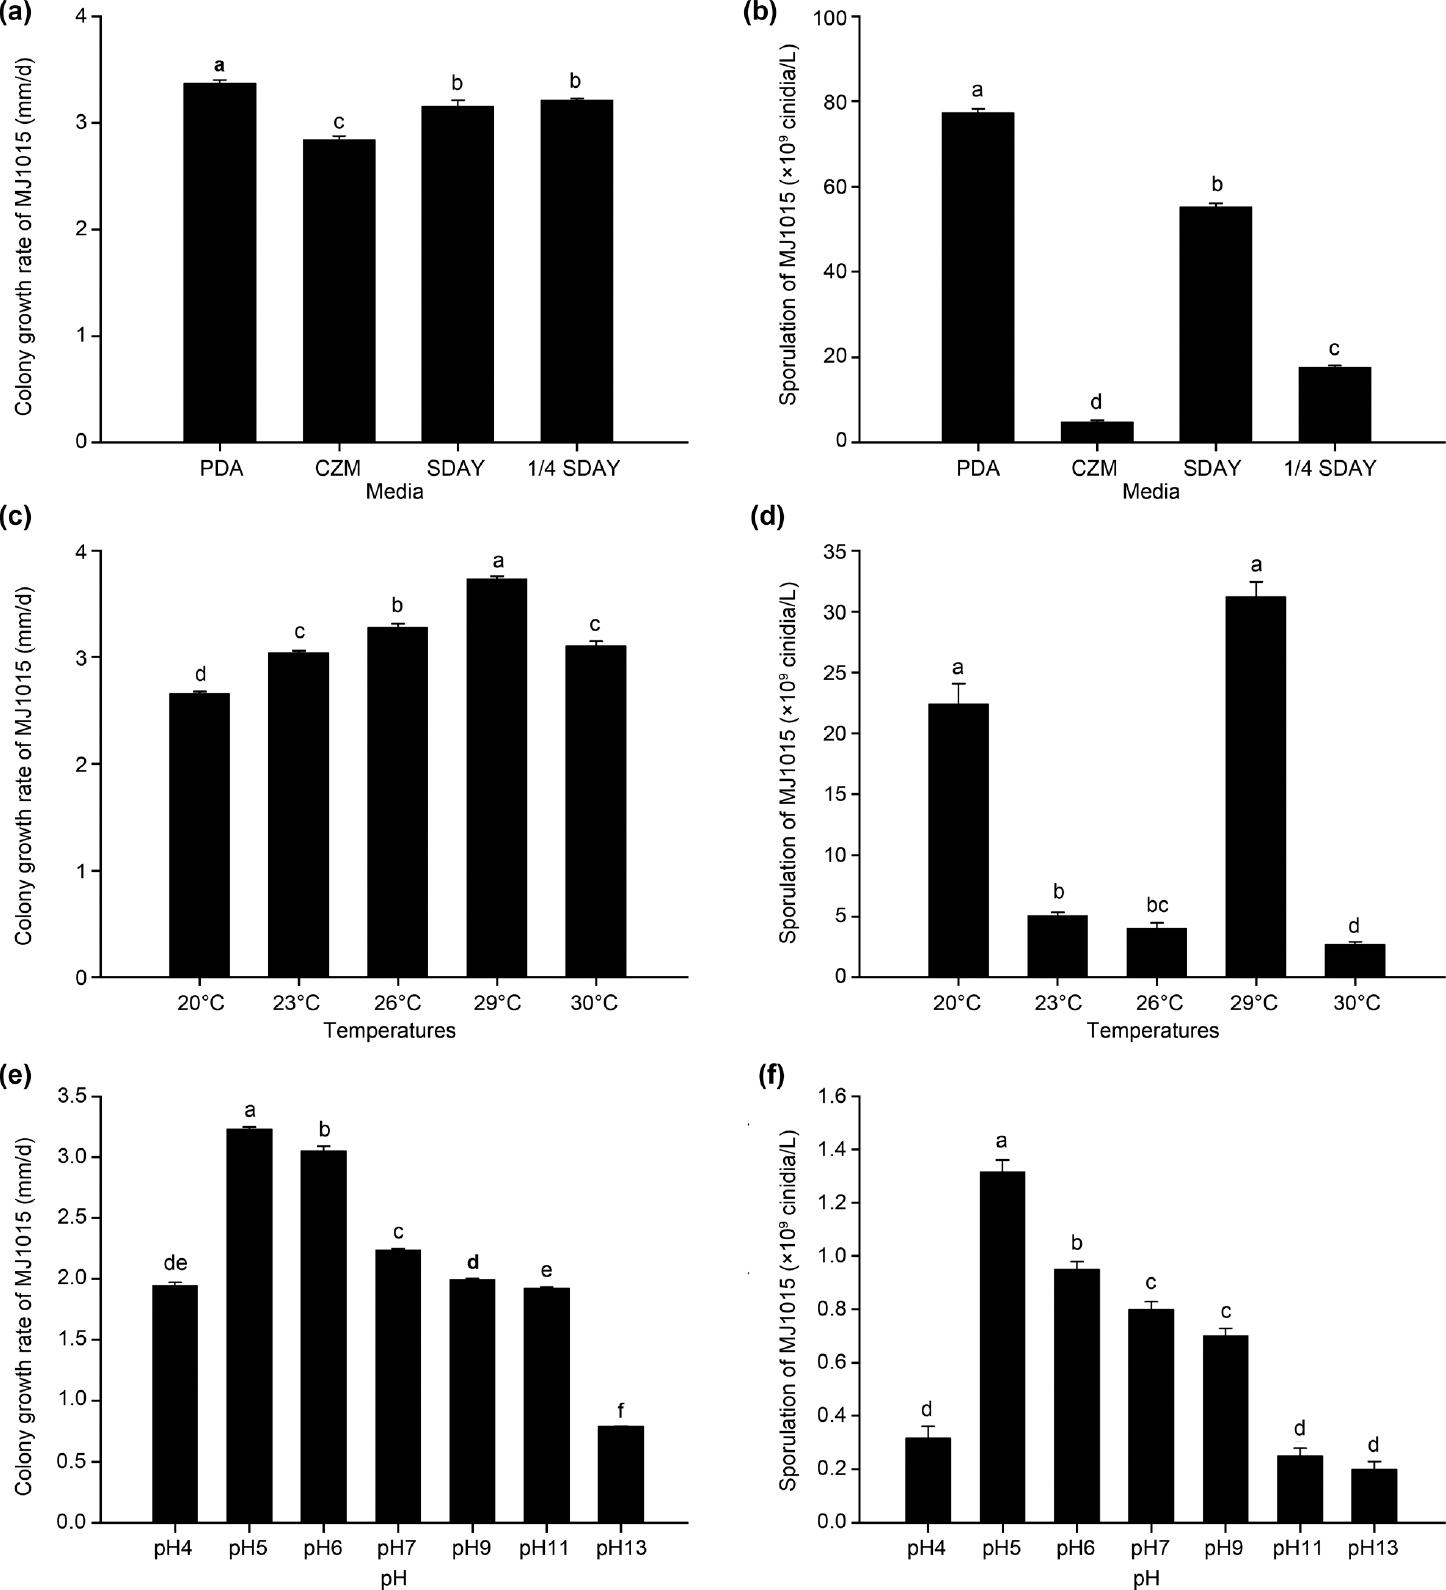
Fig. 2
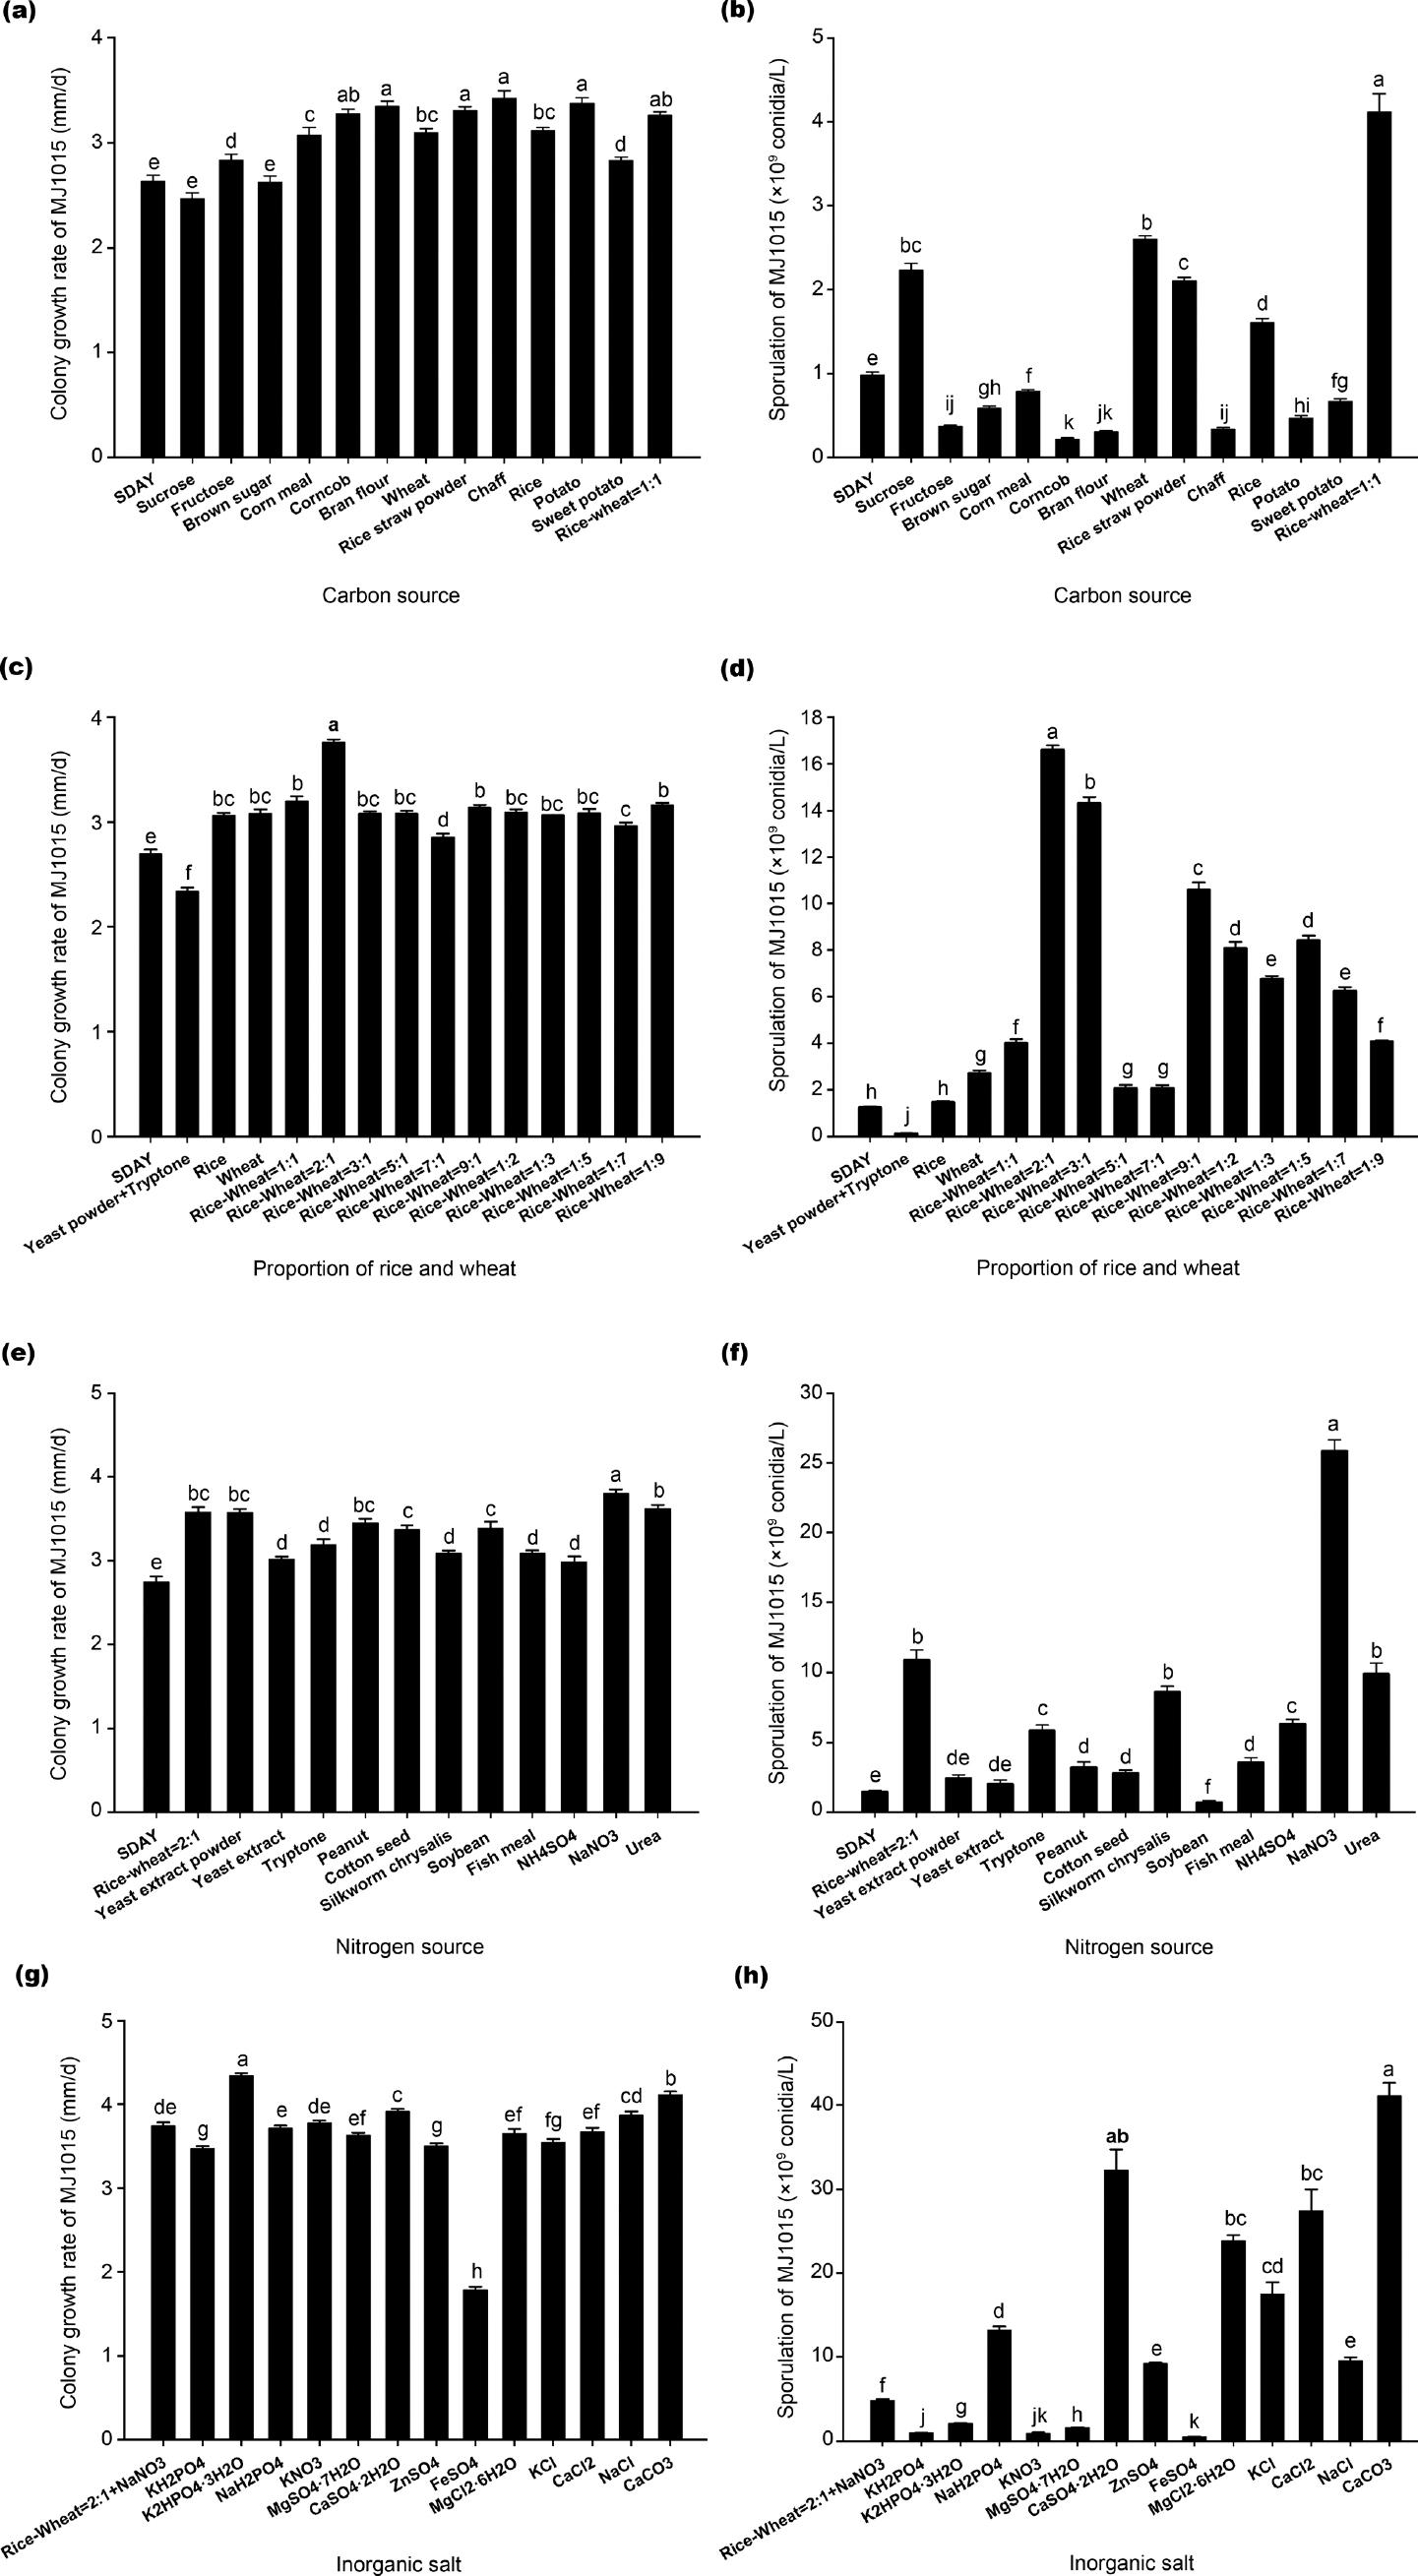
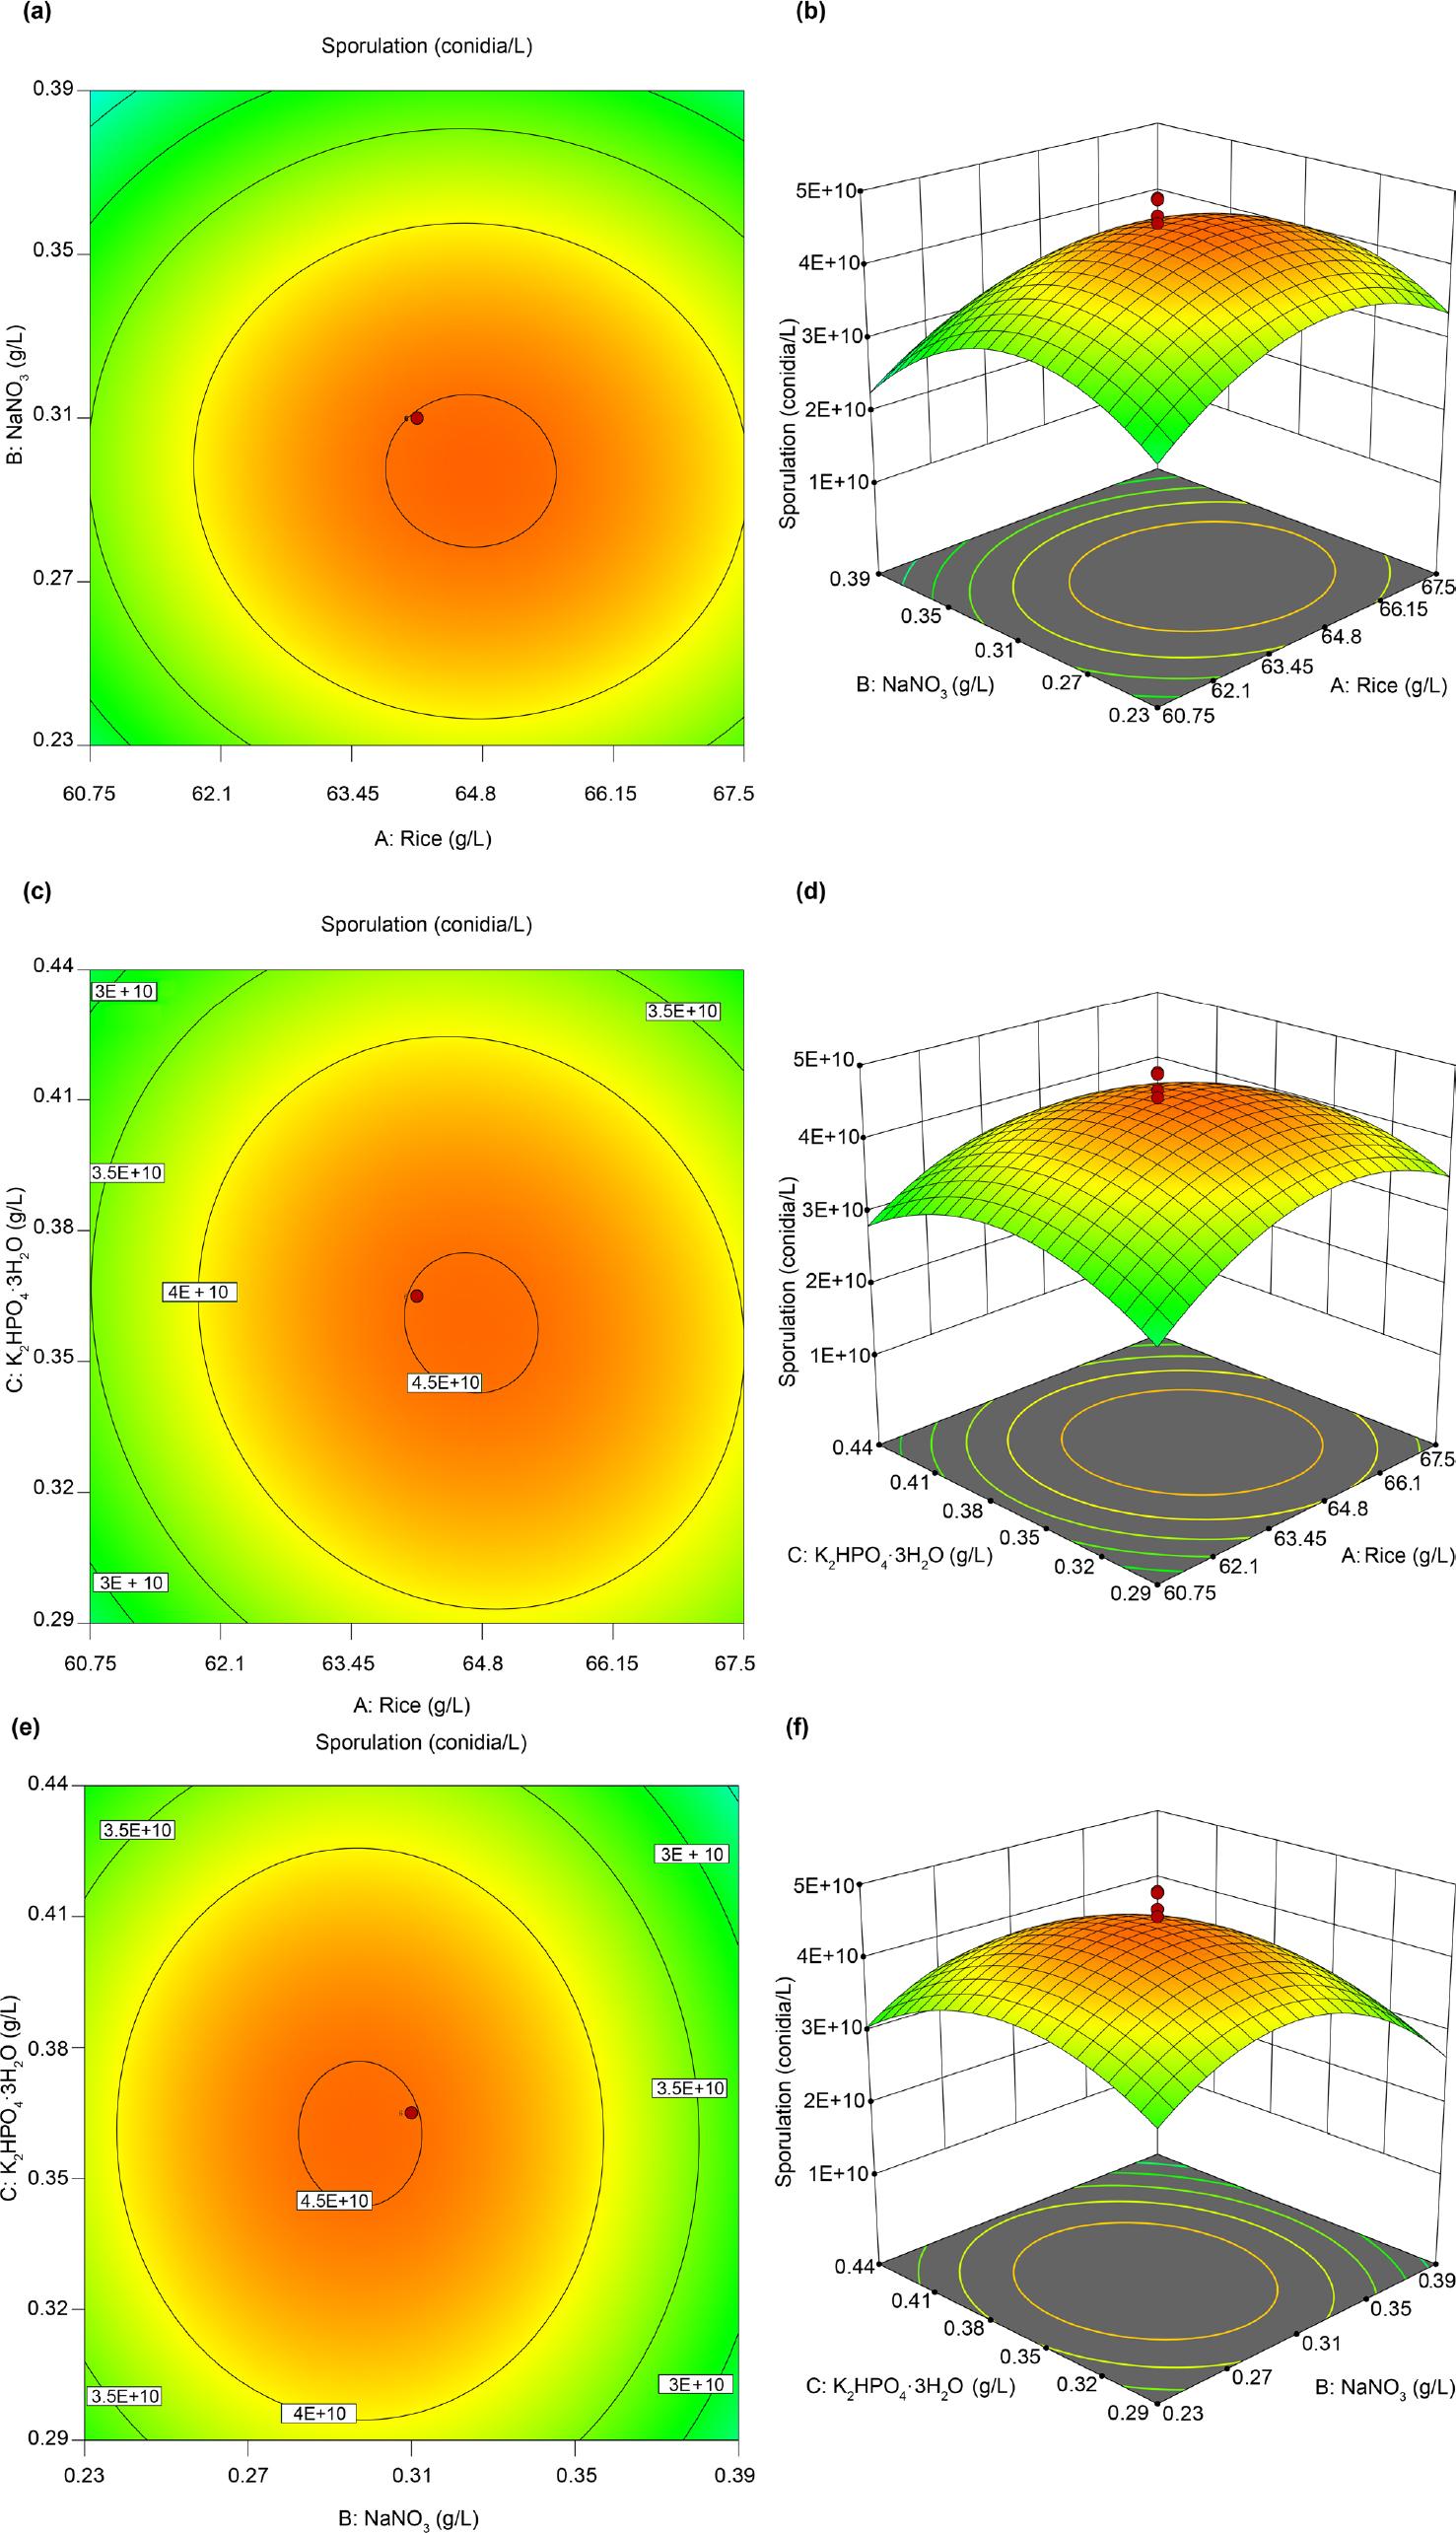
Fig. 3
Plackett-Burman design and response values_
| Order | Variable code | Y Sporulation (conidia/l) 1 × 10⁹ | |||||||
|---|---|---|---|---|---|---|---|---|---|
| X1 | X2 | X3 | X4 | X5 | X6 | X7 | X8 | ||
| 1 | 1 | 1 | −1 | 1 | 1 | 1 | −1 | −1 | 22.370 ± 1.833 |
| 2 | −1 | 1 | 1 | −1 | 1 | 1 | 1 | −1 | 2.860 ± 0.282 |
| 3 | 1 | −1 | 1 | 1 | −1 | 1 | 1 | 1 | 4.267 ± 0.466 |
| 4 | −1 | 1 | −1 | 1 | 1 | −1 | 1 | 1 | 0.923 ± 0.117 |
| 5 | −1 | −1 | 1 | −1 | 1 | 1 | −1 | 1 | 9.043 ± 1.283 |
| 6 | −1 | −1 | −1 | 1 | −1 | 1 | 1 | −1 | 1.487 ± 0.289 |
| 7 | 1 | −1 | −1 | −1 | 1 | −1 | 1 | 1 | 33.453 ± 3.836 |
| 8 | 1 | 1 | −1 | −1 | −1 | 1 | −1 | 1 | 30.840 ± 2.155 |
| 9 | 1 | 1 | 1 | −1 | −1 | −1 | 1 | −1 | 11.113 ± 0.934 |
| 10 | −1 | 1 | 1 | 1 | −1 | −1 | −1 | 1 | 5.773 ± 0.636 |
| 11 | 1 | −1 | 1 | 1 | 1 | −1 | −1 | −1 | 6.950 ± 0.865 |
| 12 | −1 | −1 | −1 | −1 | −1 | −1 | −1 | −1 | 5.650 ± 1.211 |
| 13 | 0 | 0 | 0 | 0 | 0 | 0 | 0 | 0 | 10.628 ± 1.353 |
| 14 | 0 | 0 | 0 | 0 | 0 | 0 | 0 | 0 | 13.027 ± 1.477 |
| 15 | 0 | 0 | 0 | 0 | 0 | 0 | 0 | 0 | 19.129 ± 1.886 |
Results of regression analysis of Plackett-Burman design_
| Source | Factor | df | Sporulation (Y) | |||
|---|---|---|---|---|---|---|
| Sum of squares | Mean square | F-value | p-value | |||
| Model | 5 | 11.69 | 2.34 | 7.84 | 0.0060** | |
| X1 | 0.7365 | 1 | 6.51 | 6.51 | 21.81 | 0.0016** |
| X2 | 0.0313 | 1 | 0.0117 | 0.0117 | 0.0393 | 0.8477 |
| X4 | -0.4789 | 1 | 2.75 | 2.75 | 9.22 | 0.0162* |
| X5 | 0.0448 | 1 | 0.0241 | 0.0241 | 0.0807 | 0.7836 |
| X7 | -0.4468 | 1 | 2.40 | 2.40 | 8.03 | 0.0220* |
| Residual | 8 | 2.39 | 0.2985 | |||
| Cor total | 14 | 15.30 | ||||
Range of different factors investigated with Plackett-Burman design_
| Symbol | Variables | Experimental value | |
|---|---|---|---|
| Low (−1) | High (+1) | ||
| X1 | Rice (g/l) | 27 | 33.75 |
| X2 | Wheat (g/l) | 13 | 16.25 |
| X3 | Virtual 1 | −1 | 1 |
| X4 | NaNO3 (g/l) | 1 | 1.25 |
| X5 | CaCO3 (g/l) | 1 | 1.25 |
| X6 | Virtual 2 | −1 | 1 |
| X7 | K2HPO4 · 3H.O (g/l) | 1 | 1 .25 |
| X8 | Virtual 3 | −1 | 1 |
Experimental design and results of steepest ascent path_
| Level of factor | Factor coded value | Factor actual value | Sporulation (conidia/l) 1 × 10⁹ | ||||
|---|---|---|---|---|---|---|---|
| Rice | NaNO3 | K2HPO4 · 3H2O | Rice | NaNO3 | K2HPO4 · 3H2O | ||
| Step lengthΔ | 1 | 0.125 | 0.125 | 3.375 | 0.125 | 0.125 | n.d. |
| Origin | 0 | 0.000 | 0.000 | 30.375 | 1.125 | 1.125 | 10.627 ± 0.342 |
| Origin + 1Δ | 1 | 0.125 | 0.125 | 33.750 | 1.044 | 1.049 | 9.043 ± 0.532 |
| Origin + 2Δ | 2 | 0.250 | 0.250 | 37.125 | 0.962 | 0.973 | 5.273 ± 0.136 |
| Origin + 3Δ | 3 | 0.375 | 0.375 | 40.500 | 0.881 | 0.898 | 4.837 ± 0.229 |
| Origin + 4Δ | 4 | 0.500 | 0.500 | 43.875 | 0.800 | 0.822 | 1.880 ± 0.218 |
| Origin + 5Δ | 5 | 0.625 | 0.625 | 47.250 | 0.719 | 0.746 | 0.730 ± 0.063 |
| Origin + 6Δ | 6 | 0.750 | 0.750 | 50.625 | 0.637 | 0.670 | 0.620 ± 0.008 |
| Origin + 7Δ | 7 | 0.875 | 0.875 | 54.000 | 0.556 | 0.594 | 29.487 ± 0.546 |
| Origin + 8Δ | 8 | 1.000 | 1.000 | 57.375 | 0.475 | 0.518 | 28.773 ± 0.540 |
| Origin + 9Δ | 9 | 1.125 | 1.125 | 60.750 | 0.393 | 0.443 | 35.627 ± 1.806 |
| Origin + 10Δ | 10 | 1.250 | 1.250 | 64.125 | 0.312 | 0.367 | 47.587 ± 4.056 |
| Origin + 11Δ | 11 | 1.375 | 1.375 | 67.500 | 0.231 | 0.291 | 9.917 ± 0.451 |
| Origin + 12Δ | 12 | 1.500 | 1.500 | 70.875 | 0.150 | 0.215 | 2.420 ± 0.079 |
| Origin + 13Δ | 13 | 1.625 | 1.625 | 74.250 | 0.068 | 0.139 | 3.967 ± 0.138 |
Response surface central composite design and corresponding results_
| Run | Coded variable level | Y Sporulation (conidia/l) 1 × 10⁹ | ||
|---|---|---|---|---|
| A | B | C | ||
| 1 | −1 | −1 | −1 | 1.95 + 0.108 |
| 2 | 1 | −1 | −1 | 2.75 + 0.085 |
| 3 | −1 | 1 | −1 | 1.60 + 0.070 |
| 4 | 1 | 1 | −1 | 2.34 + 0.098 |
| 5 | −1 | −1 | 1 | 1.75 + 0.060 |
| 6 | 1 | −1 | 1 | 2.16 + 0.117 |
| 7 | −1 | 1 | 1 | 1.45 + 0.062 |
| 8 | 1 | 1 | 1 | 1.55 + 0.076 |
| 9 | −1.6818 | 0 | 0 | 2.13 + 0.061 |
| 10 | 1.6818 | 0 | 0 | 2.91 + 0.077 |
| 11 | 0 | −1.6818 | 0 | 2.70 + 0.102 |
| 12 | 0 | 1.6818 | 0 | 1.23 + 0.038 |
| 13 | 0 | 0 | −1.6818 | 2.58 + 0.076 |
| 14 | 0 | 0 | 1.6818 | 2.85 + 0.059 |
| 15 | 0 | 0 | 0 | 4.90 + 0.077 |
| 16 | 0 | 0 | 0 | 4.88 + 0.088 |
| 17 | 0 | 0 | 0 | 4.67 + 0.119 |
| 18 | 0 | 0 | 0 | 4.25 + 0.110 |
| 19 | 0 | 0 | 0 | 4.57 + 0.085 |
| 20 | 0 | 0 | 0 | 3.70 + 0.082 |
Response surface optimization results validation_
| Medium | Colony growth (mm/d) | Sporulation (conidia/l) 1 × 10¹⁰ |
|---|---|---|
| New medium | 4.46 ± 0.04 | 4.54 ± 0.16 |
| SDAY | 2.41 ± 0.03 | 0.10 ± 0.02 |
| PDA | 2.28 ± 0.03 | 0.47 ± 0.04 |
ANOVA for response surface quadratic polynomial model_
| Source | df | Sporulation (Y) | ||||
|---|---|---|---|---|---|---|
| Sum of squares | Mean square | F-value | p-value | |||
| Model | 9 | 2.668 × 10²¹ | 2.965 × 10²⁰ | 15.93 | < 0.0001 | significant |
| A-Rice | 1 | 8.275 × 10¹⁹ | 8.275 × 10¹⁹ | 4.450 | 0.0612 | |
| B-NaNO3 | 1 | 1.256 × 10²⁰ | 1.256 × 10²⁰ | 6.750 | 0.0266 | |
| C-K2HPO4 · 3H2O | 1 | 1.180 × 10¹⁹ | 1.180 × 10¹⁹ | 0.6336 | 0.4445 | |
| AB | 1 | 1.650 × 10¹⁸ | 1.650 × 10¹⁸ | 0.0886 | 0.7720 | |
| AC | 1 | 1.343 × 10¹⁹ | 1.343 × 10¹⁹ | 0.7126 | 0.4155 | |
| BC | 1 | 3.335 × 10¹⁷ | 3.335 × 10¹⁷ | 0.0179 | 0.8962 | |
| A2 | 1 | 8.529 × 10²⁰ | 8.529 × 10²⁰ | 45.810 | < 0.0001 | |
| B2 | 1 | 1.339 × 10²¹ | 1.339 × 10²¹ | 71.900 | < 0.0001 | |
| C2 | 1 | 7.069 × 10²⁰ | 7.069 × 10¹⁸ | 37.970 | 0.0001 | |
| Residual | 10 | 1.862 × 10²⁰ | 1.862 × 10¹⁹ | |||
| Lack of fit | 5 | 8.170 × 10¹⁹ | 1.634 × 10¹⁹ | 0.7821 | 0.6030 | not significant |
| Pure error | 5 | 1.045 × 10²⁰ | 2.089 × 10¹⁹ | |||
| Cor Total | 19 | 2.855 × 10²¹ | ||||
| R2 | 0.9348 | |||||
| Adjusted R2 | 0.8761 | |||||
Factors and levels of response surface central composite design_
| Symbol | Variables | Code level | ||||
| −1.6828 | −1 | 0 | 1 | 1.6818 | ||
| A | Rice (g/l) | 58.4489 | 60.75 | 64.125 | 67.50 | 69.8011 |
| B | NaNO3 (g/l) | 0.1755 | 0.23 | 0.31 | 0.39 | 0.44459 |
| C | K2HPO4 · 3H2O (g/l) | 0.2389 | 0.29 | 0.365 | 0.44 | 0.49119 |