
Fig. 1.
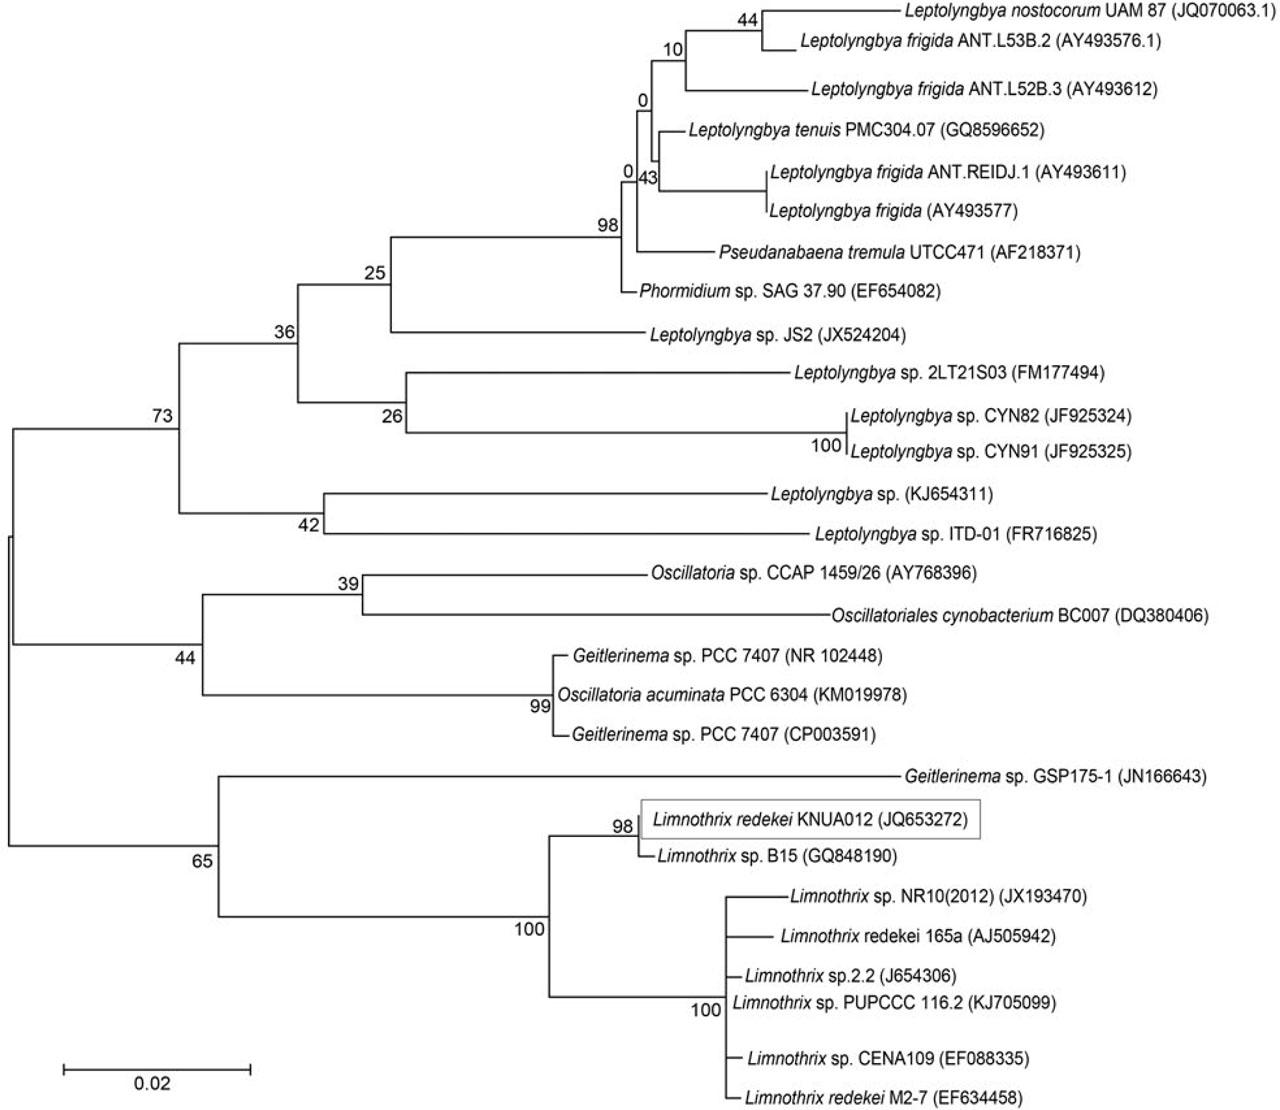
Fig. 2.
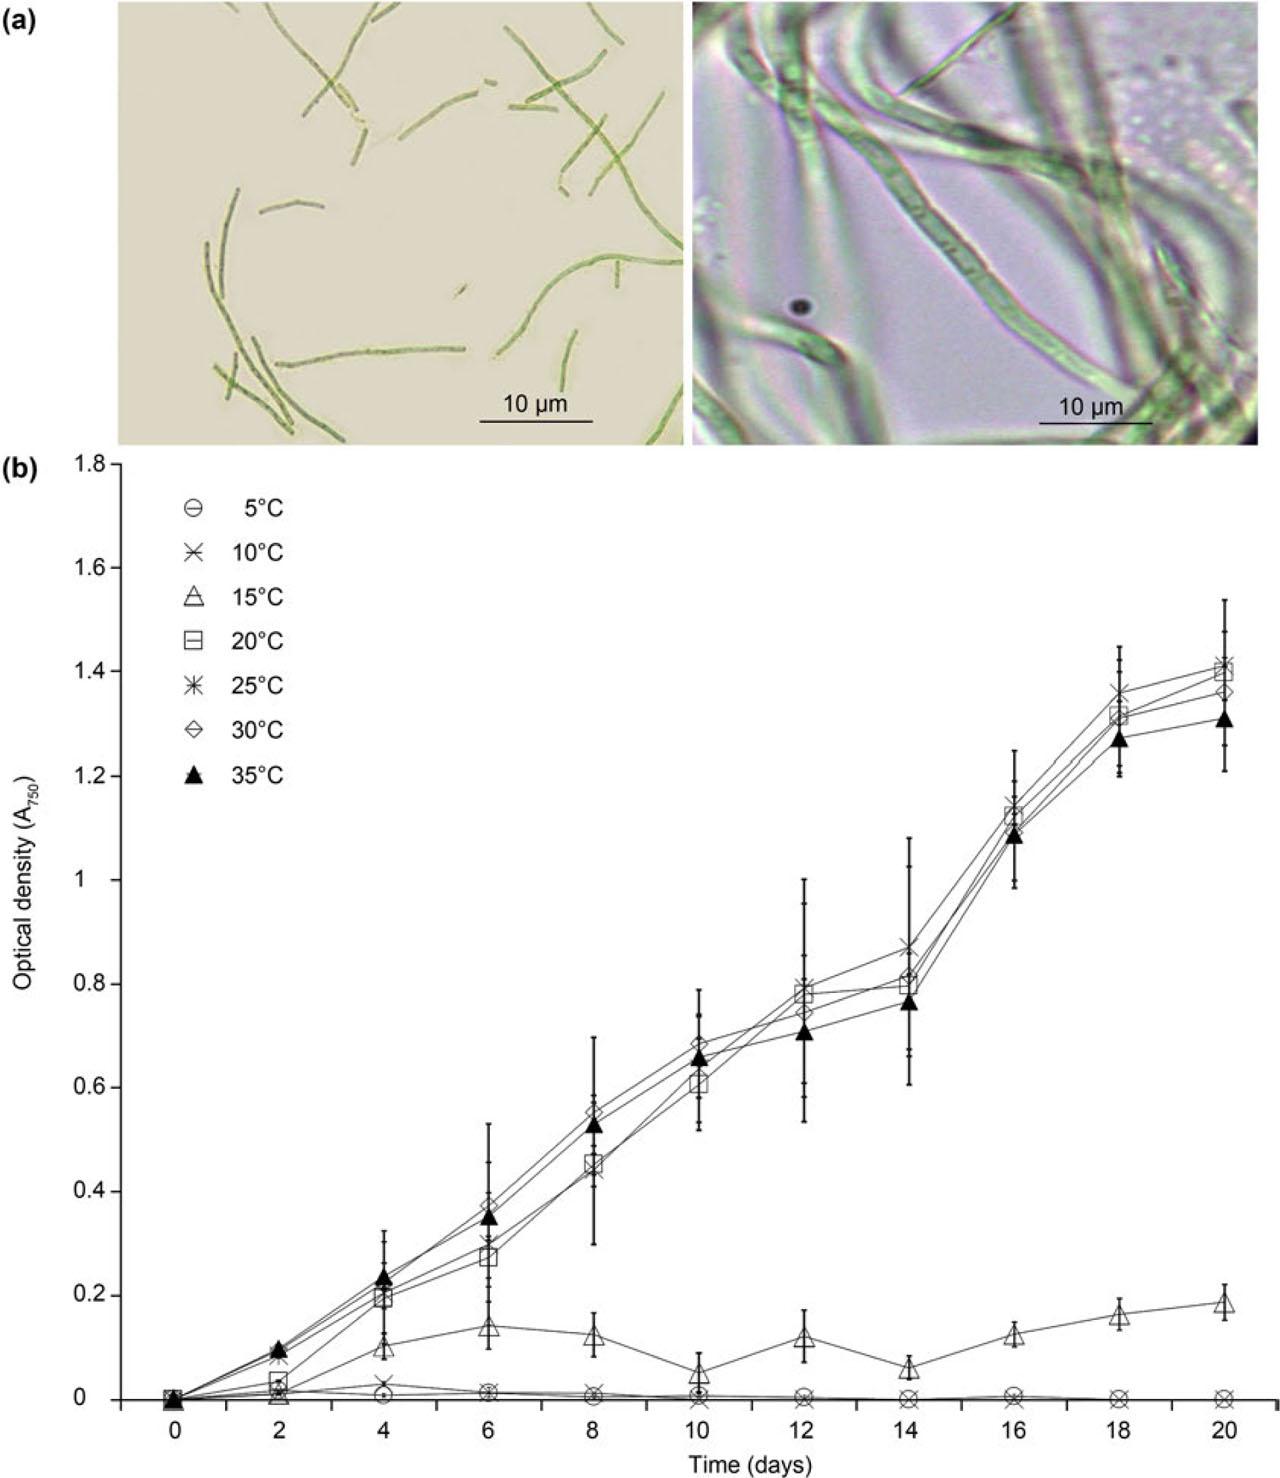
Fig. 3.
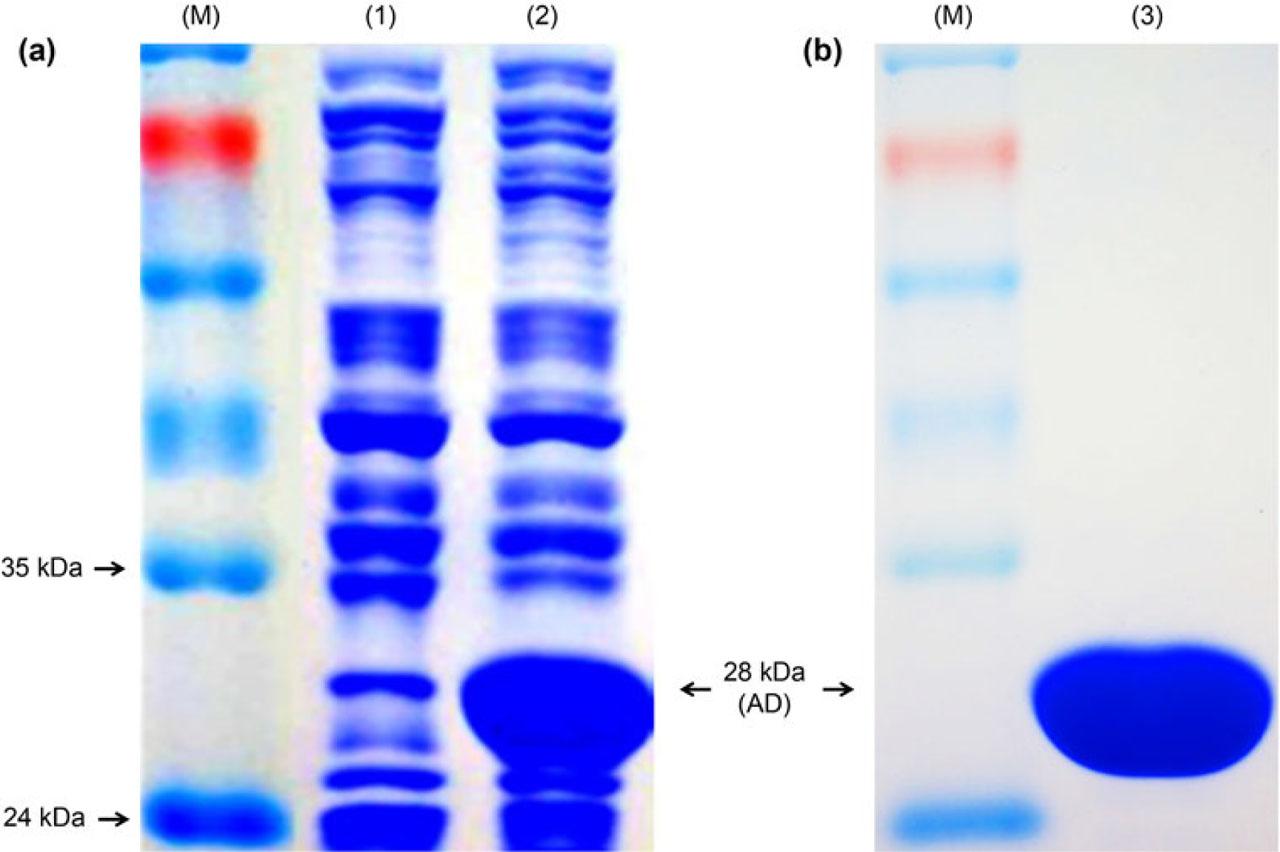
Fig. 4.
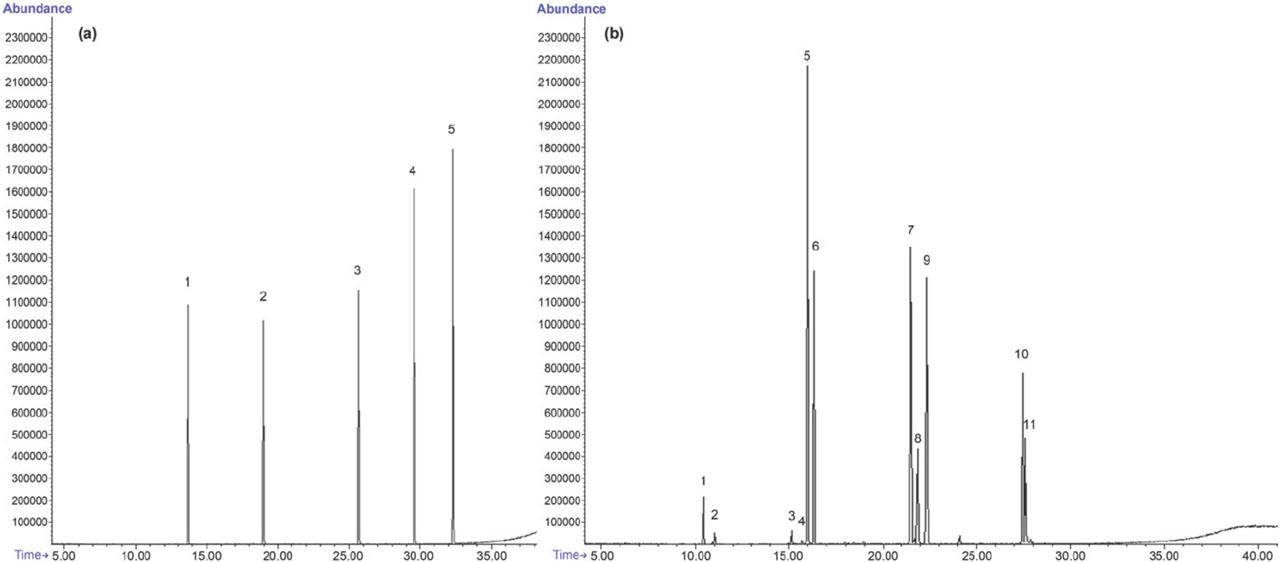
GC/MS results showing the alkanes and major fatty acids present in Limnothrix redekei KNUA012, Escherichia coli cells transformed with pET28-AD, and the empty vector pET28_
| Peak no. | Component name | pET28 empty vector (% w/w) | KNUA012 (% w/w) | pET28-AD (% w/w) |
|---|---|---|---|---|
| 1 | Pentadecane | 0.87 ± 0.52 | 2.40 ± 0.85 | 1.78 ± 0.38 |
| 2 | Dodecanoic acid methyl ester | 0.18 ± 0.05 | 0.54 ± 0.21 | 0.25 ± 0.08 |
| 3 | 8-Heptadecene | 0.54 ± 0.07 | 0.62 ± 0.23 | 1.09 ± 0.31 |
| 4 | Heptadecane | 1.07 ± 0.17 | 1.15 ± 0.42 | 1.86 ± 0.52 |
| 5 | Methyl Z-11-tetradecenoate | 21.7 ± 1.52 | 22.1 ± 1.03 | 23.6 ± 1.59 |
| 6 | Tetradecanoic acid methyl ester | 11.2 ± 1.31 | 11.2 ± 1.07 | 15.7 ± 1.41 |
| 7 | 9-Hexadecenoic acid methyl ester | 2.62 ± 0.84 | 21.3 ± 1.51 | 8.63 ± 1.52 |
| 8 | Palmitoleic acid methyl ester | 2.35 ± 0.53 | 5.37 ± 1.03 | 3.82 ± 0.82 |
| 9 | Hexadecanoic acid methyl ester | 2.06 ± 0.51 | 21.7 ± 1.85 | 7.82 ± 1.31 |
| 10 | 9-Octadecenoic acid methyl ester | 3.64 ± 0.85 | 9.31 ± 1.37 | 6.83 ± 1.46 |
| 11 | Octadecanoic acid methyl ester | 0.84 ± 0.06 | 1.04 ± 0.52 | 1.83 ± 0.82 |