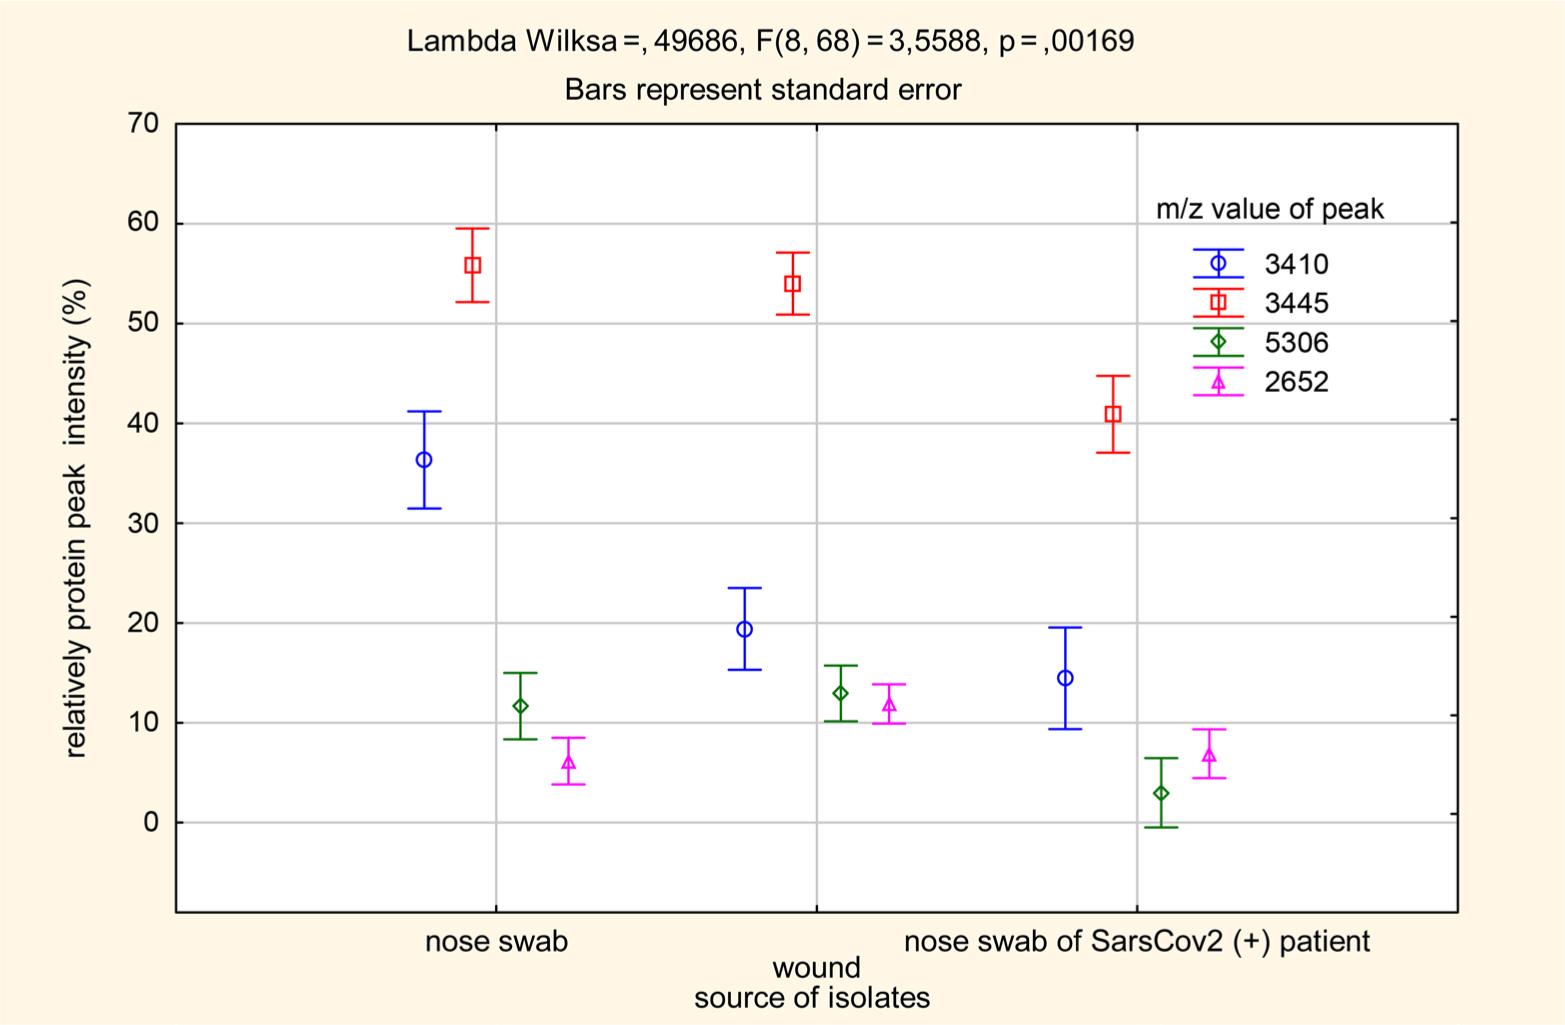
Have a personal or library account? Click to login
Changes in the Protein Profile in Staphylococcal Strains from Patients Infected with the SARS-CoV-2 Virus Cover

Changes in the Protein Profile in Staphylococcal Strains from Patients Infected with the SARS-CoV-2 Virus

Open Access
|Feb 2023

Figures & Tables

Fig. 1.

Classification and Regression Trees of the strains studied by the protein presence and relative amount of particular protein. Red boxes represent the identified categories, while vertical bars are the source of strains.

Fig. 2.

ANOVA comparison of relative protein peak intensity in isolates from different groups of patients.

Characteristics of the protein peaks identified in the study_ The m/z value refers to the mass/charge ratio_

m/zLiteratureRelative peak intensity
2,151This studyN = 7Med 14
2,430This studyN = 6Med 11.5
2,515This studyN = 14Med 11.5
2,652This studyN = 23Med 14
2,750This studyN = 8Med 15.5
2,770Sauget et al. 2017N = 24Med 15
2,869This studyN = 23Med 13
2,895This studyN = 2Med 15
3,005Jackson et al. 2005;Østergaard et al. 2010;Böhme et al. 2012;Josten et al. 2013N = 15Med 26
3,177This studyN = 12Med 13,5
3,212This studyN = 17Med 16
3,410This studyN = 30Med 25
3,445Bernardo et al. 2002;Østergaard et al. 2010;Böhme et al. 2012;Josten et al. 2013N = 40Med 49
3,785This studyN = 9Med 11
4,307This studyN = 40Med 28
4,458Østergaard et al. 2010;N = 6Med 13
4,594Østergaard et al. 2010;N = 3Med 11
4,819Østergaard et al. 2010;Sauget et al. 2017Med 30.5N = 28
5,035Bernardo et al. 2002;Jackson et al. 2005;Østergaard et al. 2010;Böhme et al. 2012;Josten et al. 2013N = 36Med 36.6
5,306Sauget et al. 2017N = 19Med 17
5,528Bernardo et al. 2002;Østergaard et al. 2010;Böhme et al. 2012;Josten et al. 2013;Jackson et al. 2020N = 30Med 43.5
5,554Sauget et al. 2017N = 6Med 23
6,032Østergaard et al. 2010N = 3Med 23
6,357This studyN = 29Med 13
6,426Østergaard et al. 2010N = 10Med 11
6,575Jackson et al. 2005;Østergaard et al. 2010;Böhme et al. 2012;Josten et al. 2013N = 17Med 12
6,820Sauget et al. 2017N = 38Med 54
6,892Østergaard et al. 2010;Böhme et al. 2012Med 100N = 40
9,632Østergaard et al. 2010;Sauget et al. 2017N = 26Med 28

Clinical characteristics of patients_

Age(median)Oxygensaturation(median)CRP(median)Diabetes(n of patients)Hypertension(n of patients)n
Patients hospitalized due to SARS-CoV-2 infection719061,46812
Patients with wound infection (diabetes, SARS-CoV-2 negative)64N/AN/A17N/A17
S. aureus carriers (diabetes)58N/AN/A11N/A11
DOI: https://doi.org/10.33073/pjm-2023-001 | Journal eISSN: 2544-4646 | Journal ISSN: 1733-1331
Language: English
Page range: 93 - 99
Submitted on: Sep 23, 2022
Accepted on: Dec 3, 2022
Published on: Feb 21, 2023
Published by: Polish Society of Microbiologists
In partnership with: Paradigm Publishing Services
Publication frequency: 4 issues per year

© 2023 TOMASZ JARZEMBOWSKI, LIDIA PIECHOWICZ, MAREK BRONK, ANNA PAŁUBICKA, ŁUKASZ NAUMIUK, published by Polish Society of Microbiologists
This work is licensed under the Creative Commons Attribution-NonCommercial-NoDerivatives 4.0 License.