
Fig. 1
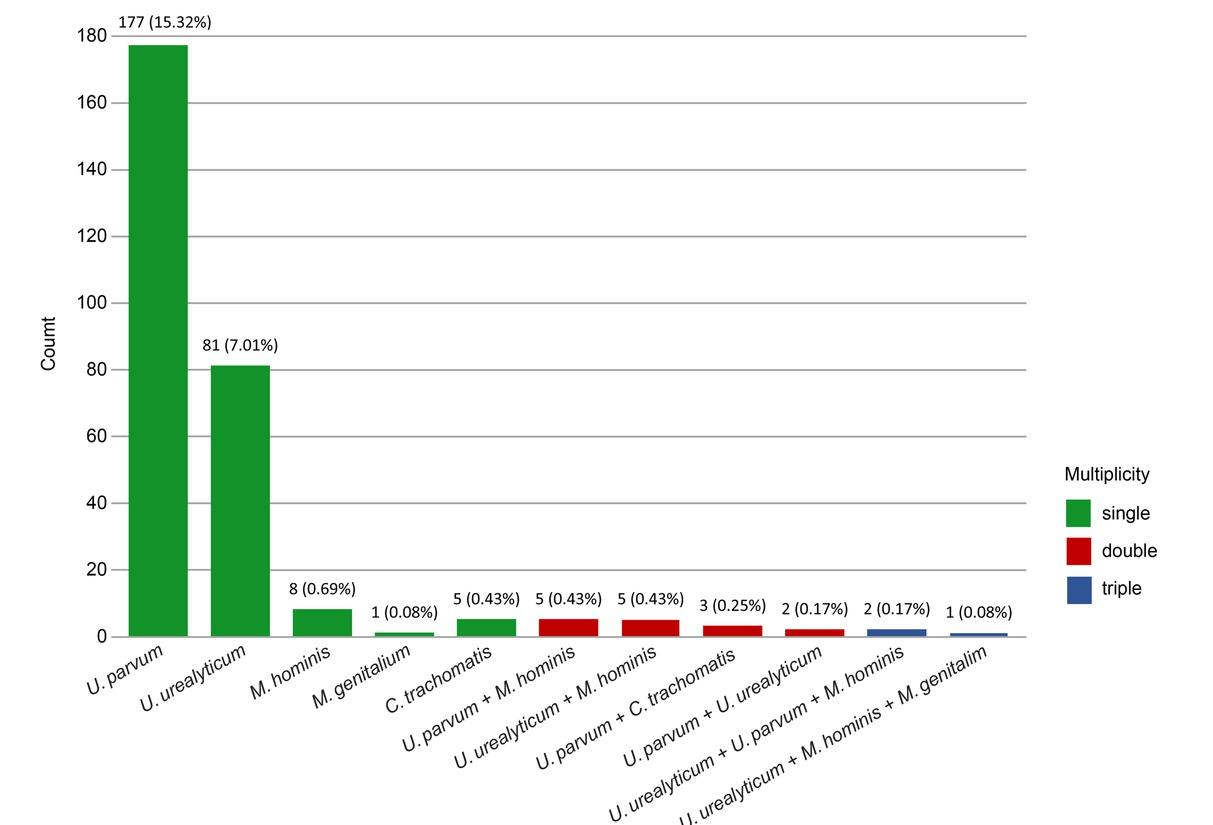
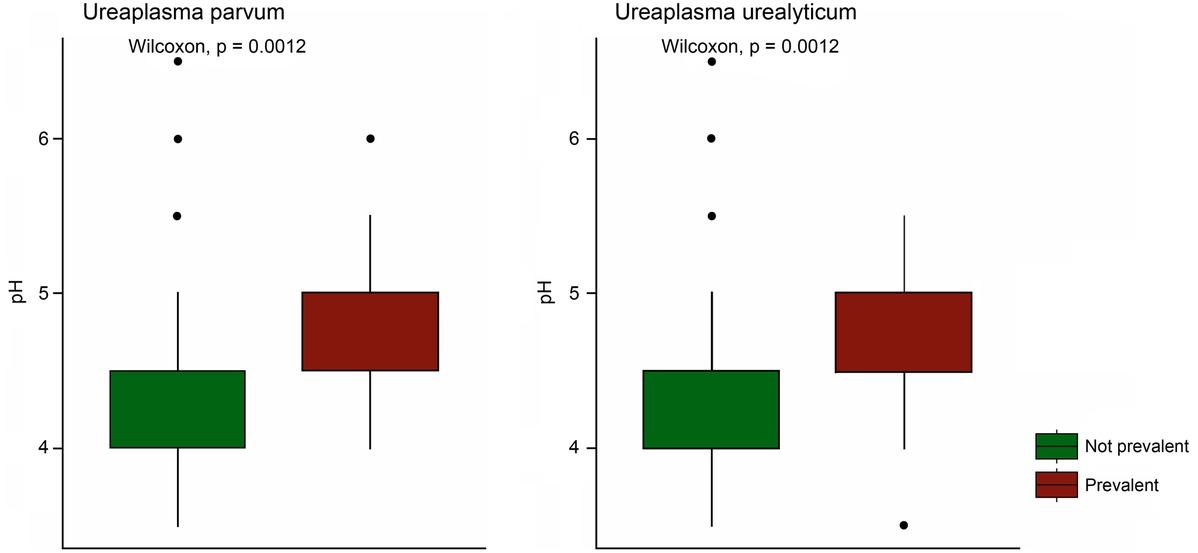
Fig. 2
Relationship between the presence of U_ urealyticum and other microorganisms_
| Microorganisms | Without Ureaplasma urealyticum (n = 1,066) | With Ureaplasma urealyticum (n = 89) | p* | OR*** (95% CI) | p** |
|---|---|---|---|---|---|
| n (%) | n (%) | ||||
| Lactobacillus spp. | 1,024 (96.1) | 83 (9 3.3) | 0.319 | 0.57 | 0.203 |
| Garderella vaginalis | 43 (4 .0) | 13 (1 4.6) | < 0.001 | 4.07 | < 0.001 |
| Chlamydia trachomatis | 8 (0.8) | 0 (0.0) | 1.000# | 0.00 | 0.412 |
| Mycoplasma hominis | 13 (1.2) | 8 (9.0) | < 0.001# | 8 | < 0.001 |
| Mycoplasma genitalium | 1 (0.1) | 1 (1.1) | 0.148# | 5.98 | 0.025 |
| Ureaplasma parvum | 185 (1 7.4) | 2 (2 .2) | < 0.001 | 0.11 | < 0.001 |
| Aerobic bacteria | 137 (1 2.9) | 16 (1 8.0) | 0.227 | 1.48 | 0.171 |
| Yeast | 173 (1 6.2) | 19 (2 1.3) | 0.272 | 1.40 | 0.213 |
| Streptococcus group B | 77 (7 .2) | 11 (1 2.4) | 0.122 | 1.81 | 0.083 |
Association between the prevalence of microorganisms and clinical symptoms – multivariable analyses_ The fully adjusted model and the most parsimonious model_
| Microorganisms | Model 1* | Model 2** | ||
|---|---|---|---|---|
| OR*** (95% CI) | p** | OR*** (95% CI) | p** | |
| Ureaplasma parvum | 3.06 | < 0.001 | 3.07 | < 0.001 |
| Ureaplasma urealyticum | 5.25 | < 0.001 | 5.20 | < 0.001 |
| Mycoplasma hominis | 49.30 | 0.006 | 48.97 | 0.007 |
| Chlamydia trachomatis | 10.03 | 0.012 | 10.04 | 0.012 |
| Lactobacillus spp. | 0.47 | 0.045 | 0.48 | 0.033 |
| Gardnerella vaginalis | 3.92 | < 0.001 | 3.87 | < 0.001 |
| Yeast | 1.73 | 0.002 | 1.73 | 0.002 |
| DF | 12 | 7 | ||
| AICc | 207.5 | 197.8 | ||
| ΔAICc | 9.7 | 0.0 | ||
The prevalence of specific microorganisms across groups of women manifesting or not clinical symptoms_
| Microorganisms | Microbiological method | Total | Without symptoms (n = 756) | With symptoms (n = 399) | p* | OR*** (95% CI) | p** |
|---|---|---|---|---|---|---|---|
| n (%) | n (%) | n (%) | |||||
| Lactobacillus spp. | microscopic | 1,107 (95.8) | 737 (97.5) | 370 (92.7) | < 0.001 | 0.33 | < 0.001 |
| Gardnerella vaginalis | microscopic, culture | 56 (4.8) | 11 (1.5) | 45 (11.3) | < 0.001 | 8.32 | < 0.001 |
| Ureaplasma spp. | PCR | 276 (23.9) | 108 (14.3) | 166 (41.6) | < 0.001 | 4.26 | < 0.001 |
| Ureaplasma parvum | PCR | 187 (16.2) | 81 (10.7) | 106 (26.6) | < 0.001 | 3.01 | < 0.001 |
| Ureaplasma urealyticum | PCR | 89 (7.7) | 27 (3.6) | 62 (15.5) | < 0.001 | 4.91 | < 0.001 |
| Mycoplasma hominis | PCR | 21 (1.8) | 0 (0.0) | 21 (5.3) | < 0.001# | 85.94 | 0.002 |
| Mycoplasma genitalium | PCR | 2 (0.2) | 0 (0.0) | 2 (0.5) | 0.119# | 9.62 | 0.146 |
| Chlamydia trachomatis | PCR | 8 (0.7) | 1 (0.1) | 7 (1.8) | 0.003# | 9.62 | 0.012 |
| Aerobic bacteria (with GBS) | culture | 153 (13.2) | 95 (12.6) | 58 (14.5) | 0.396 | 1.19 | 0.339 |
| Streptococcus group B (GBS) | culture | 88 (7.6) | 57 (7.5) | 31 (7.8) | 0.981 | 1.04 | 0.865 |
| Yeast | microscopic, culture | 192 (16.6) | 100 (13.2) | 92 (23.1) | < 0.001 | 1.97 | < 0.001 |
| Neisseria gonorrhoeae | culture | – | – | – | – | – | |
| Trichomonas vaginalis | culture | – | – | – | – | – |
Relationship between the detection of Ureaplasma spp_ and pH > 4_5 regarding Gardnerella vaginalis coinfections_
| pH ≤ 4.5 n (%) | pH > 4.5 n (%) | OR*** (95% CI) | p** | |
|---|---|---|---|---|
| Ureaplasma spp. | 180 (1 5.6%) | 94 (8 .1%) | 2.1 | < 0.005 |
| Ureaplasma Garnerella vaginalis spp. without coinfection | 173 (15.7%) | 65 (5.9%) | 1.60 | 0.004 |
Distribution of vaginal pH values in women with and without the presence of specific microorganisms_
| Microorganisms | Not prevalent | Prevalent | p* | pH > 4.5 OR (95% CI)** | p** | ||
|---|---|---|---|---|---|---|---|
| n | Q2 (Q1-Q3) | n | Q2 (Q1-Q3) | ||||
| Lactobacillus spp. | 48 | 5.5 (5.0–5.5) | 1,107 | 4.5 (4.0–4.5) | < 0.001 | 0.01 (0.00–0.05) | < 0.001 |
| Gardnerella vaginalis | 1,099 | 4.5 (4.0–4.5) | 56 | 5.0 (4.9–5.5) | < 0.001 | 11.18 (6.05–20.65) | < 0.001 |
| Ureaplasma spp. | 881 | 4.5 (4.0–4.5) | 274 | 4.5 (4.5–5.0) | < 0.001 | 2.09 (1.55–2.82) | < 0.001 |
| Ureaplasma parvum | 968 | 4.5 (4.0–4.5) | 187 | 4.5 (4.5–5.0) | 0.001 | 1.71 (1.21–2.41) | 0.002 |
| Ureaplasma urealyticum | 1,066 | 4.5 (4.0–4.5) | 89 | 4.5 (4.5–5.0) | 0.004 | 2.42 (1.55–3.78) | < 0.001 |
| Mycoplasma hominis | 1,134 | 4.5 (4.0–4.5) | 21 | 4.5 (4.5–5.0) | 0.008 | 3.07 (1.31–7.16) | 0.010 |
| Aerobic bacteria (with GBS) | 1,002 | 4.5 (4.0–4.5) | 153 | 5.0 (4.5–5.0) | < 0.001 | 7.44 (5.17–10.69) | < 0.001 |
| Streptococcus group B | 1,067 | 4.5 (4.0–4.5) | 88 | 5.0 (4.5–5.1) | < 0.001 | 5.89 (3.76–9.24) | < 0.001 |
| Yeast | 963 | 4.5 (4.0–4.5) | 192 | 4.5 (4.5–5.0) | 0.003 | 1.49 (1.06–2.10) | 0.023 |
Relationship between the presence of U_ parvum and other microorganisms_
| Microorganisms | Without Ureaplasma parvum (n = 968) | With Ureaplasma parvum (n = 187) | p* | OR*** (95% CI) | p** |
|---|---|---|---|---|---|
| n (%) | n (%) | ||||
| Lactobacillus spp. | 930 (9 6.1) | 177 (9 4.7) | 0.489 | 0.72 | 0.372 |
| Garderella vaginalis | 32 (3 .3) | 24 (1 2.8) | < 0.001 | 4.30 | < 0.001 |
| Chlamydia trachomatis | 5 (0.5) | 3 (1.6) | 0.125# | 2.60 | 0.101 |
| Mycoplasma hominis | 14 (1.4) | 7 (3.7) | 0.064# | 2.65 | 0.0313 |
| Mycoplasma genitalium | 2 (0.2) | 0 (0.0) | 1.000# | 0.00 | 0.534 |
| Ureaplasma urealyticum | 87 (9 .0) | 2 (1 .1) | < 0.001 | 0.11 | < 0.001 |
| Aerobic bacteria | 134 (1 3.8) | 19 (1 0.2) | 0.214 | 0.70 | 0.174 |
| Yeast | 150 (1 5.5) | 42 (2 2.5) | 0.025 | 1.58 | 0.019 |
| Streptococcus group B | 82 (8 .5) | 6 (3 .2) | 0.020 | 0.36 | 0.017 |
Association between the prevalence of microorganisms and pH > 4_5 – multivariable analyses_ The fully adjusted model and the most parsimonious model_
| Microorganisms | Model 1* | Model 2** | ||
|---|---|---|---|---|
| OR (95% CI) | p*** | OR (95% CI) | p*** | |
| Ureaplasma parvum | 1.81 (1.21–2.73) | 0.004 | 1.86 (1.24–2.79) | 0.003 |
| Ureaplasma urealyticum | 2.23 (1.31–3.78) | 0.003 | 2.32 (1.37–3.92) | 0.002 |
| Lactobacillus spp. | 0.03 (0.01–0.11) | < 0.001 | 0.03 (0.01–0.11) | < 0.001 |
| Gardnerella vaginalis | 5.91 (2.91–12.00) | < 0.001 | 6.54 (3.25–13.18) | < 0.001 |
| Aerobic bacteria (with GBS) | 7.31 (4.14–12.91) | < 0.001 | 6.85 (4.61–10.18) | < 0.001 |
| DF | 11 | 5 | ||
| AICc | 287.7 | 275.0 | ||
| ΔAICc | 12.7 | 0.0 | ||