
Fig. 1
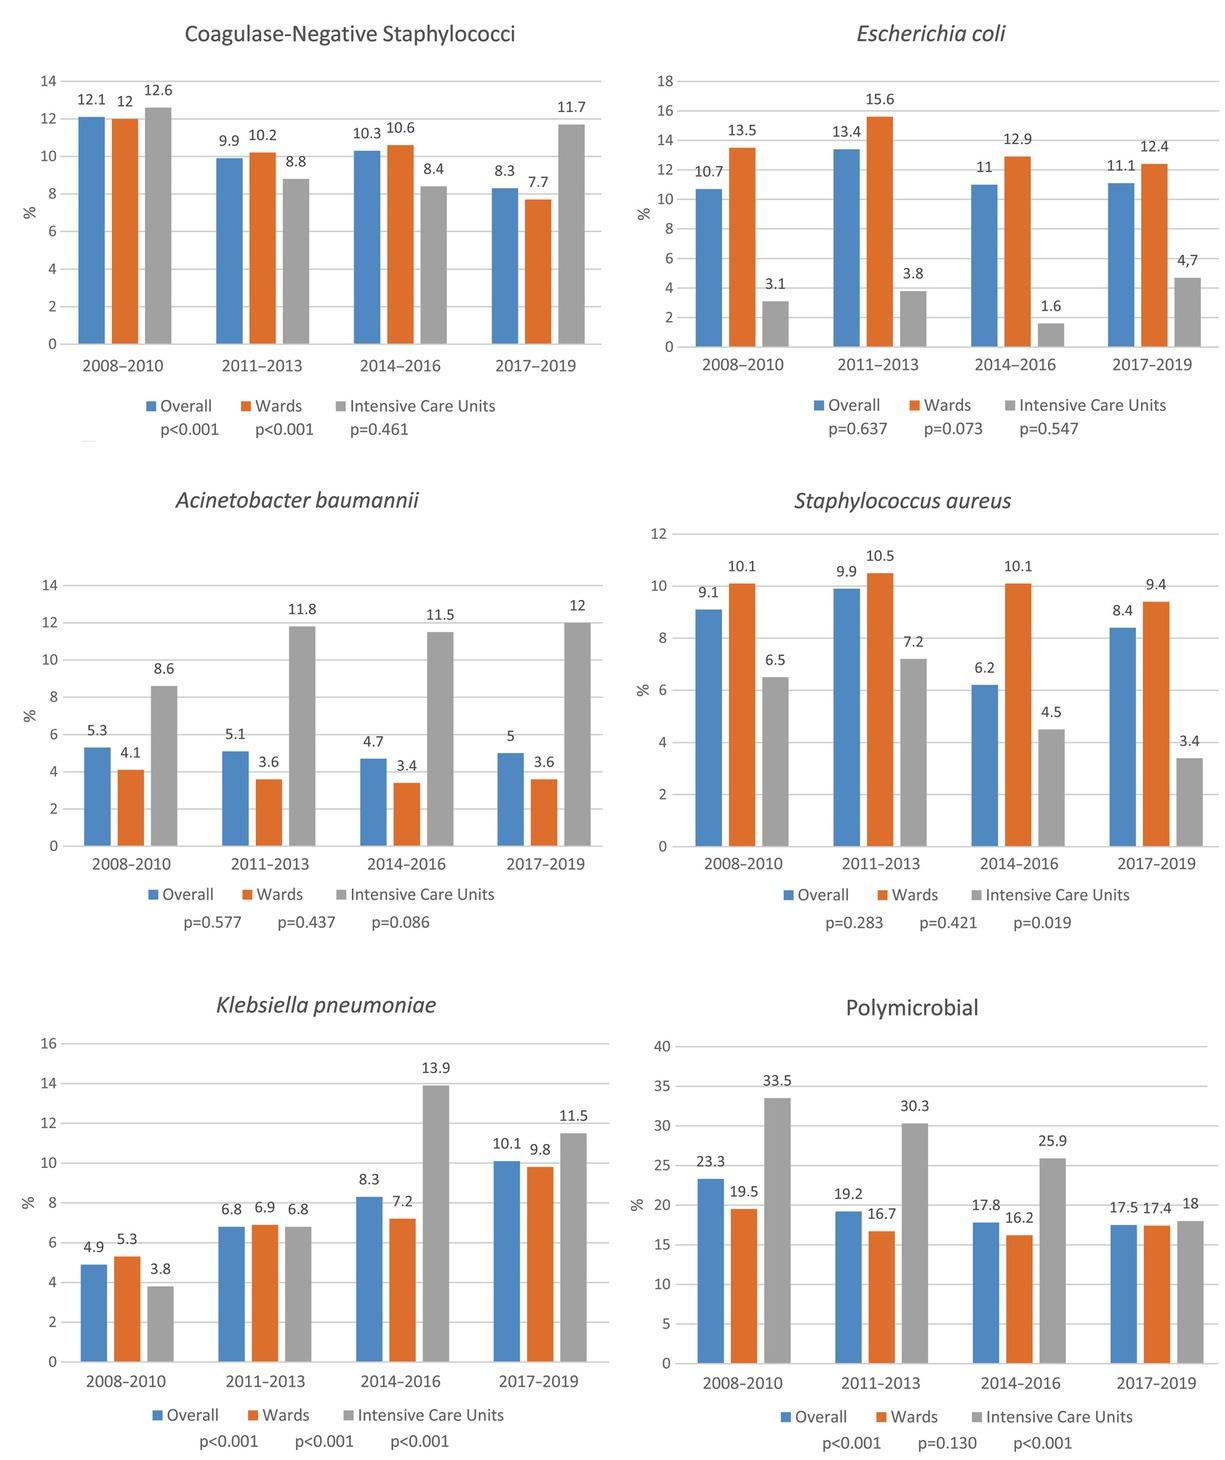
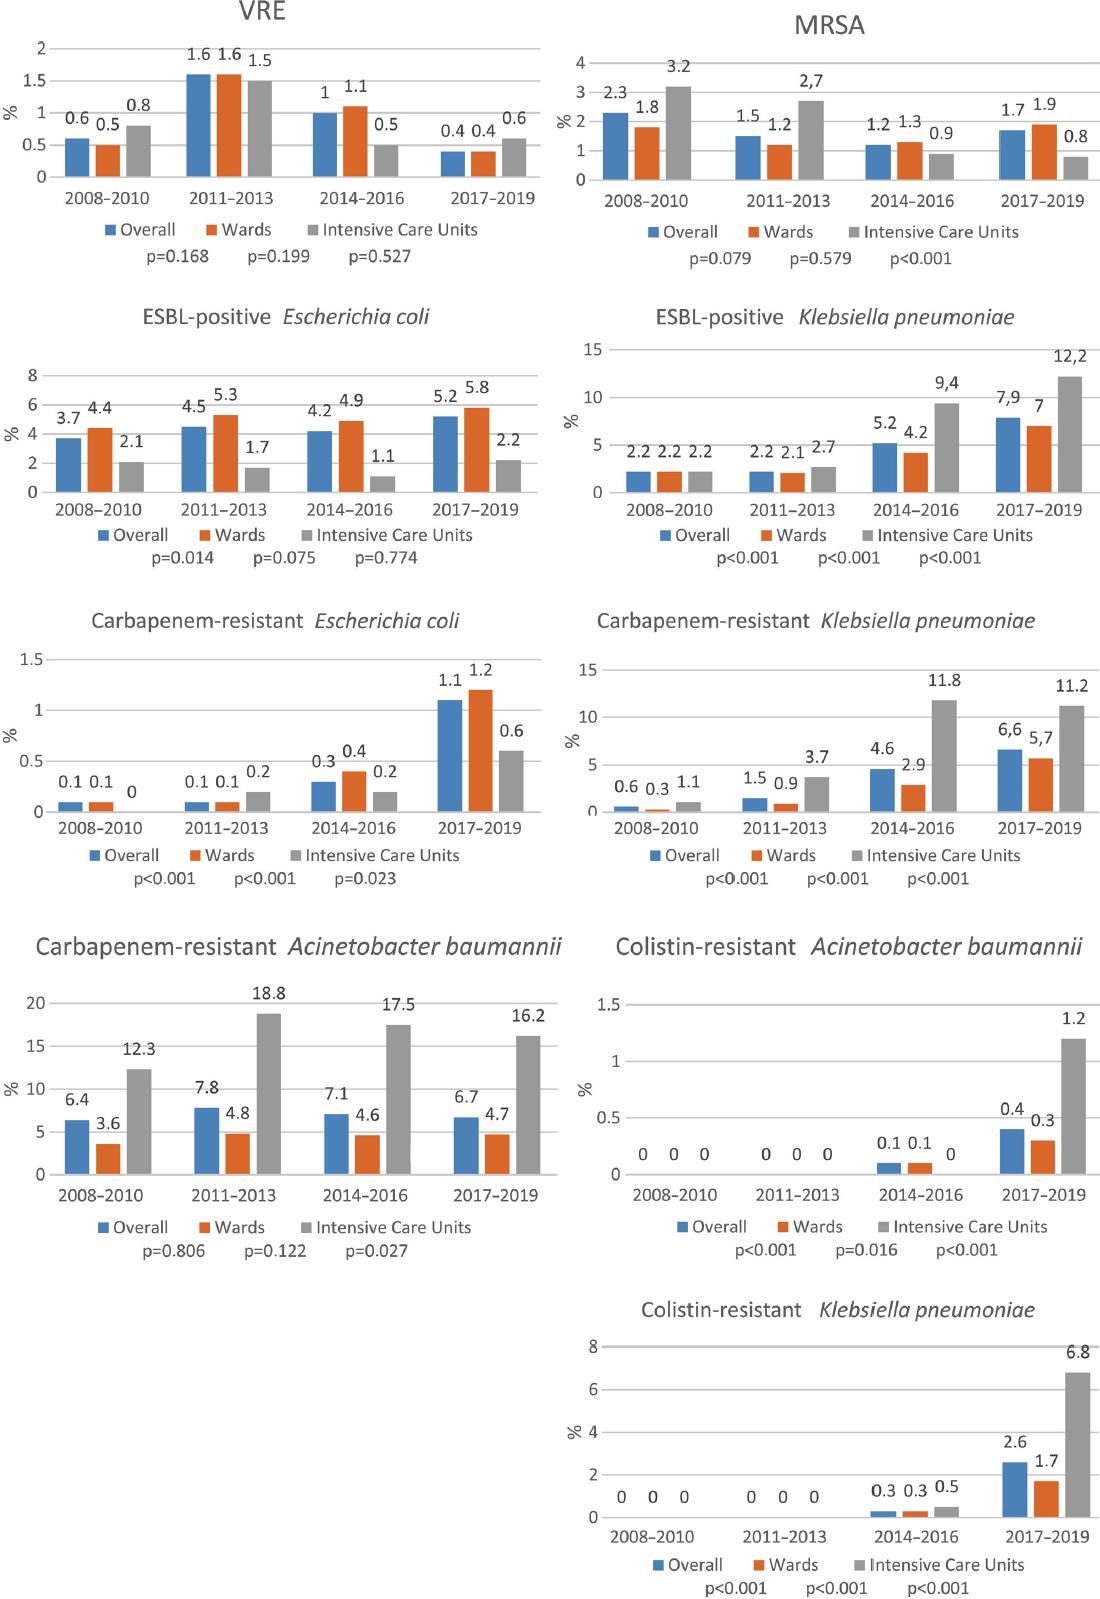
Fig. 2
Distribution of microorganisms in bloodstream infections in the wards and intensive care units_
| Bloodstream infection episodes | Wards n (%) | Intensive care units n (%) | Overall n (%) | |
|---|---|---|---|---|
| Monomicrobial | Gram-negative | 3,065 (42.8%) | 710 (40.9%) | 3,775 (42.5%) |
| Escherichia coli | 971 (13.6%) | 57 (3.3%) | 1,028 (11.6%) | |
| Klebsiella pneumoniae | 529 (7.4%) | 146 (8.4%) | 675 (7.6%) | |
| Acinetobacter baumannii | 261 (3.6%) | 186 (10.7%) | 447 (5.0%) | |
| Pseudomonas aeruginosa | 275 (3.8%) | 65 (3.7%) | 340 (3.8%) | |
| Gram-positive | 2,289 (32.0%) | 441 (25.4%) | 2,730 (30.7%) | |
| Coagulase-negative staphylococci | (717 10%) | (10.6184 %) | (10.1901 %) | |
| Staphylococcus aureus | 717 (10%) | 96 (5.5%) | 813 (9.1%) | |
| Enterococcus faecalis | 188 (2.6%) | 57 (3.3%) | 245 (2.8%) | |
| Enterococcus faecium | 191 (2.7%) | 38 (2.2%) | 229 (2.6%) | |
| Fungi | 559 (7.8%) | 106 (6.1%) | 665 (7.5%) | |
| Monomicrobial (Total) | (5,913 82.7%) | (1,257 72.3%) | (7,170 80.6%) | |
| Polymicrobial | 1,240 (17.3%) | 481 (27.7%) | 1,721 (19.4%) | |
| Total | 7,153 (100%) | 1,738 (100%) | 8,891 (100%) | |
Antibiotic resistance rates of the most common Gram-negative bacteria in blood cultures_
| Escherichia coli (%) (n= 1,360) | P | Klebsiella pneumoniae (%) (n= 1,031) | P | Acinetobacter baumannii (%) (n = 864) | P | Pseudomonas aeruginosa (%) (n = 580) | P | |||||||||
|---|---|---|---|---|---|---|---|---|---|---|---|---|---|---|---|---|
| Wards | ICU | Overall | Wards | ICU | Overall | Wards | ICU | Overall | Wards | ICU | Overall | |||||
| Ceftriaxone | 25.7 | 23.8 | 25.6 | 0.664 | 38 | 50.4 | 41.1 | <0.001 | 38.2 | 28.5 | 33.4 | 0.002 | - | - | - | - |
| Cefotaxime | 11.3 | 23.8 | 12.3 | <0.001 | 10.7 | 20.2 | 13.1 | <0.001 | 32.6 | 43.5 | 38 | 0.001 | - | - | - | - |
| Cefepime | 36.9 | 49.5 | 37.9 | 0.010 | 46.8 | 67.2 | 52 | <0.001 | 47.7 | 62.5 | 55 | <0.001 | 19.3 | 38.2 | 24.8 | <0.001 |
| Imipenem | 1.4 | 1 | 1.3 | 0.589 | 25.1 | 48.9 | 31.1 | <0.001 | 74.9 | 88.7 | 81.7 | <0.001 | 23.9 | 39.4 | 28.4 | <0.001 |
| Meropenem | 0.9 | 1 | 0.9 | 0.620 | 24.7 | 48.9 | 30.8 | <0.001 | 74.7 | 90.7 | 82.6 | <0.001 | 17.8 | 34.1 | 22.6 | <0.001 |
| Ertapenem | 2.9 | 4.8 | 3.1 | 0.219 | 25.6 | 46.6 | 30.9 | <0.001 | 76 | 74.3 | 75.2 | 0.558 | 77.3 | 77.1 | 77.2 | 0.946 |
| Piperacillm- Tazobactam | 23.8 | 25.7 | 24 | 0.663 | 50.5 | 72.5 | 56.1 | <0.001 | 50 | 66.7 | 58.2 | <0.001 | 15.6 | 31.2 | 20.2 | <0.001 |
| Amikacin | 1.4 | 1.9 | 1.4 | 0.438 | 5.6 | 21 | 9.5 | <0.001 | 70.4 | 76.2 | 73.2 | 0.053 | 5.4 | 8.2 | 6.2 | 0.265 |
| Gentamicin | 26.1 | 36.2 | 26.8 | 0.024 | 23.3 | 42.7 | 28.2 | <0.001 | 62.2 | 75.2 | 68.6 | <0.001 | 12.2 | 26.5 | 16.4 | <0.001 |
| Colistin | 0.2 | 1 | 0.3 | 0.275 | 6 | 14.1 | 8.1 | <0.001 | 2.3 | 1.4 | 1.8 | 0.477 | 0.7 | 1.2 | 0.9 | 0.633 |
| Fosfomycin | 0 | 0 | 0 | - | 0.8 | 1.1 | 0.9 | 0.411 | 1.6 | 0.9 | 1.3 | 0.570 | - | - | - | - |
| Ciprofloxacin | 44.6 | 44.8 | 44.6 | 0.978 | 37.2 | 69.8 | 45.5 | <0.001 | 81.2 | 96.8 | 88.9 | <0.001 | 11.2 | 20 | 13.8 | 0.008 |
| ESBL | 36.6 | 43.8 | 37.1 | 0.086 | 45.9 | 56.9 | 48.7 | 0.001 | - | - | - | - | - | - | - | - |
| Carbapenem- resistant | 3.3 | 4.8 | 3.5 | 0.294 | 29.8 | 58.4 | 37.1 | <0.001 | 90.5 | 93.8 | 92.1 | 0.080 | 83.4 | 88.2 | 84.8 | 0.162 |
Antibiotic resistance rates of the most common Gram-positive bacteria in blood cultures_
| Staphylococcus aureus (%) (n = 996) | p | Coagulase-negative staphylococci (%) (n = 1,382) | p | Enterococcus faecalis/ Enterococcus faecium (%) (n = 1,036) | p | |||||||
|---|---|---|---|---|---|---|---|---|---|---|---|---|
| Wards | ICU | Overall | Wards | ICU | Overall | Wards | ICU | Overall | ||||
| Daptomycin | 0 | 0 | 0 | – | 0 | 0 | 0 | – | –1 | –1 | –1 | – |
| Oxacillin | 16.6 | 37.7 | 19.7 | < 0.001 | 82.9 | 90.1 | 84.7 | 0.001 | –1 | –1 | –1 | – |
| Vancomycin | 0 | 0 | 0 | – | 0 | 0 | 0 | – | 10.9 | 8.1 | 10.1 | 0.185 |
| Teicoplanin | 0.8 | 0.7 | 0.8 | 0.668 | 6.5 | 9 | 7.1 | 0.155 | 10.4 | 8.1 | 9.7 | 0.273 |
| Linezolid | 0 | 0 | 0 | – | 0.7 | 0.6 | 0.7 | 0.624 | 1 | 1.1 | 1.1 | 0.587 |
| Penicillin | –1 | –1 | –1 | – | –1 | –1 | –1 | – | 38.8 | 26 | 35.4 | < 0.001 |
| High-gentamicin level | –2 | –2 | –2 | – | –2 | –2 | –2 | – | 43.5 | 48 | 44.7 | 0.202 |