
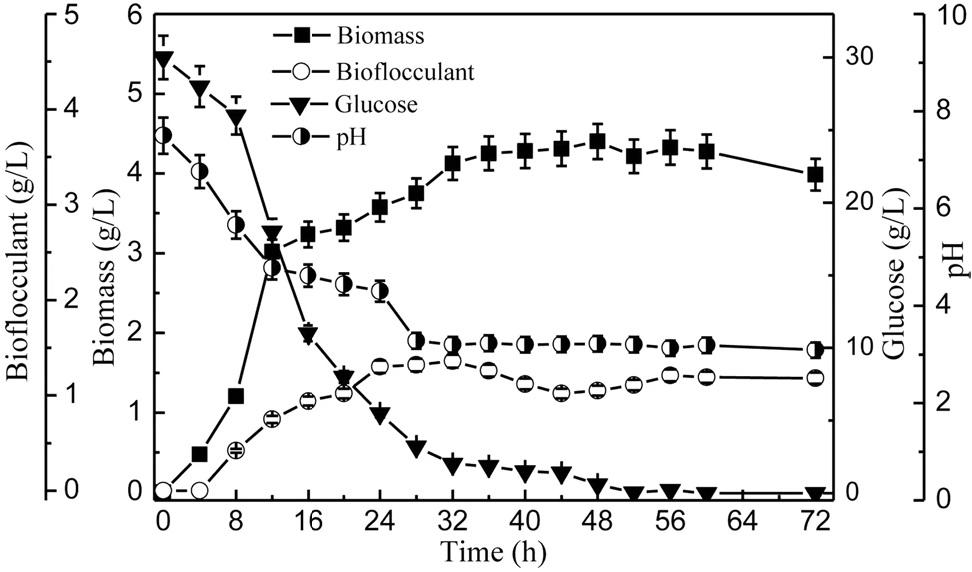
Fig. 1
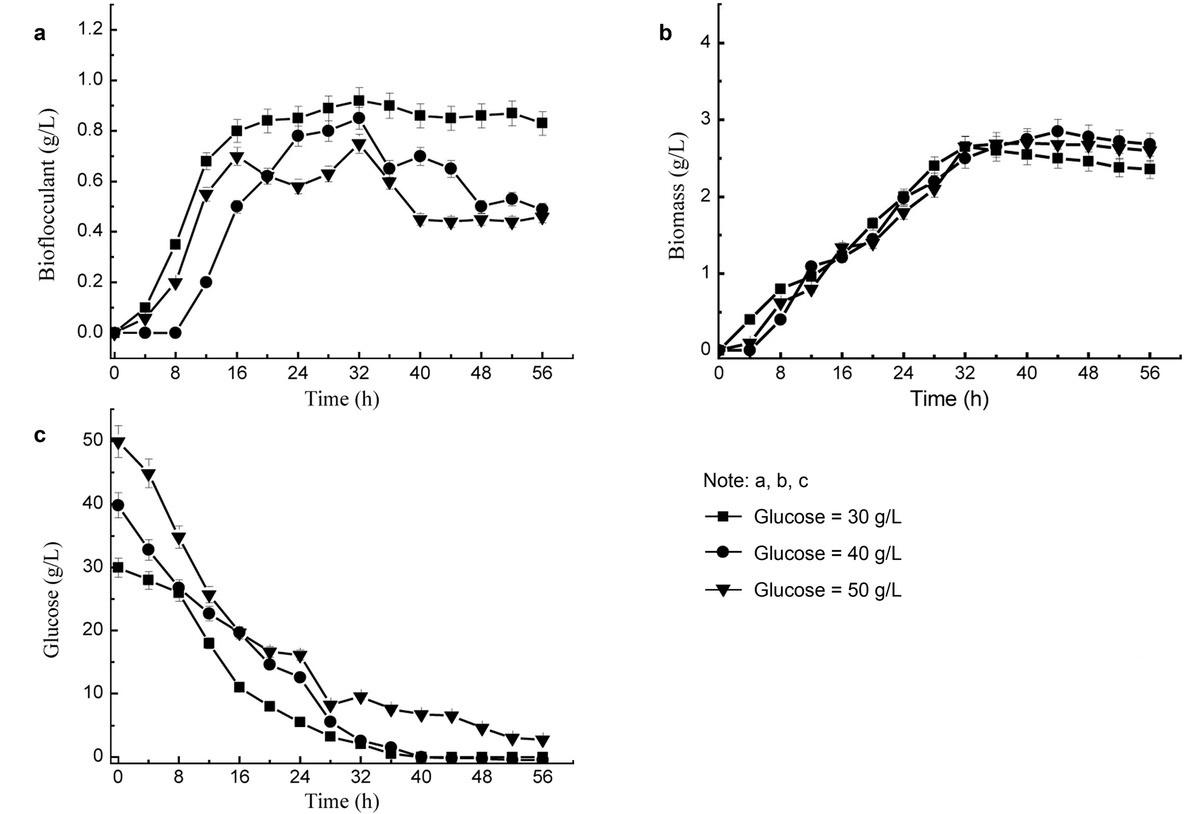
Fig. 2
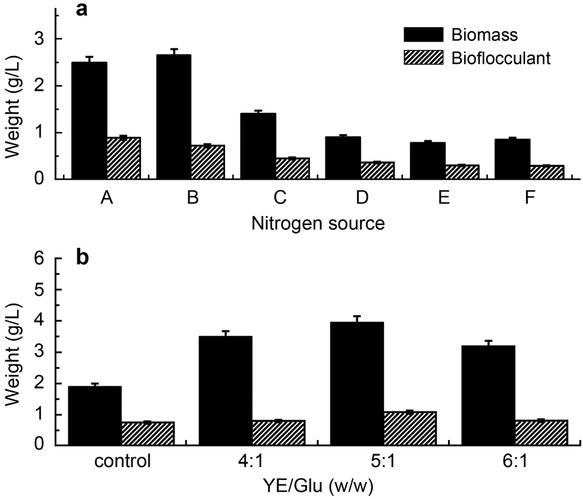
Fig. 3
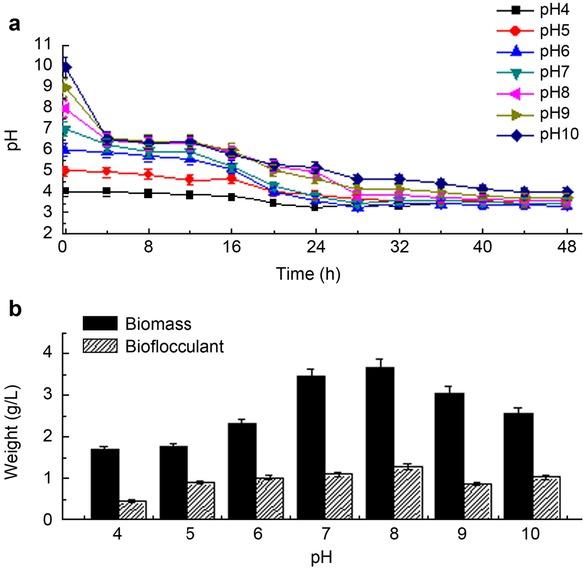
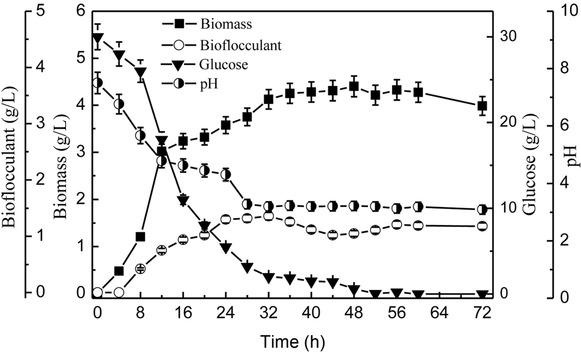
Fig. 4
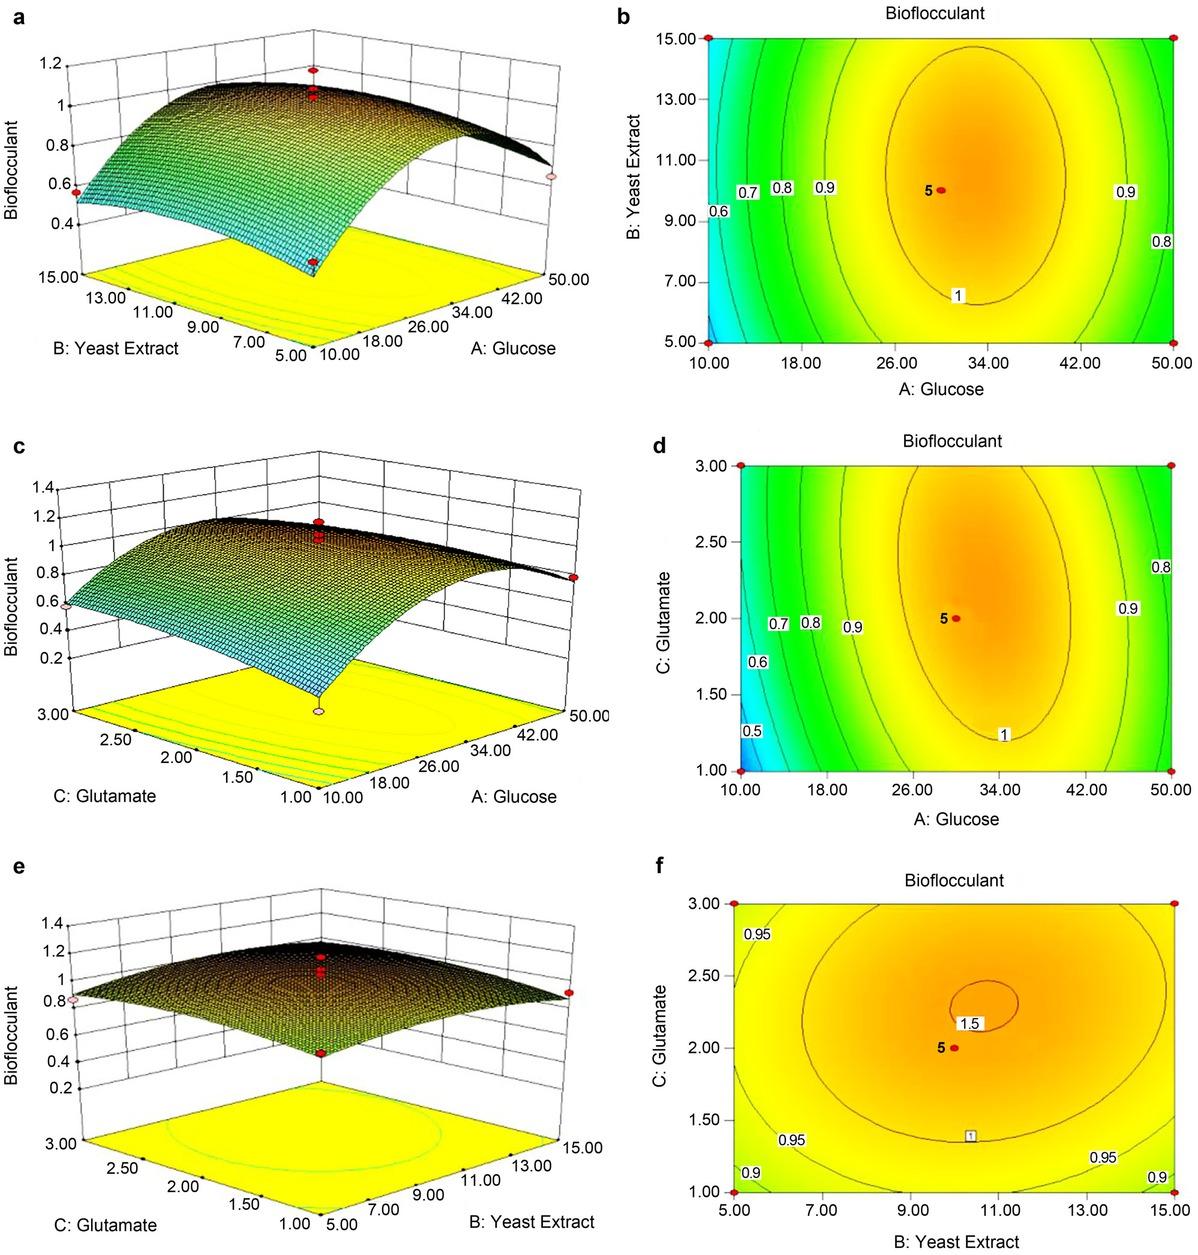
Fig. 5
Flocculation efficiency of bioflocculant produced by C_ marina on various microalgae_
| Flocculation time (min) | Group | H. pluvialis | C. vulgaris | S. platensis |
|---|---|---|---|---|
| FE (%) | ||||
| 5 | Treatment | 32.1 | – | 69.4 |
| Control | 26.4 | – | 32.9 | |
Effect analysis of independent variables in Plackett-Burman design_
| Factor | Level | p | Significant | |
|---|---|---|---|---|
| –1 | 1 | |||
| Glucose | 25 | 35 | 0.0022 | ++ |
| Yeast extract | 5 | 15 | 0.004 | ++ |
| Glutamate | 1 | 3 | 0.025 | + |
| Culture time | 28 | 36 | 0.85 | – |
| pH | 7 | 8 | 0.861 | – |
ANOVA for response surface quadratic model_
| Source | Sum of square | DF | Mean square | F-value | Prob > F |
|---|---|---|---|---|---|
| Model | 0.76 | 9 | 0.084 | 7.02 | 0.0088 |
| Residual | 0.084 | 7 | 0.012 | ||
| Lack of fit | 0.039 | 3 | 0.013 | 1.16 | 0.4282 |
| Pure error | 0.045 | 4 | |||
| Cor total | 0.84 | 16 | |||
| R2 = 0.9803 | R2adj = 0.7721 | R2pred = 0.1744 | CV = 13.53 | Adeq. precision = 7.526 |
Determination of the optimum ratio of bioflocculant/microalgae (v/v)_
| FE (%) of different algae | Amount of BF/algae added (%) | ||||
|---|---|---|---|---|---|
| 0 | 5 | 10 | 15 | 20 | |
| H. pluvialis | 20 | 34.8 | 36.7 | 47.2 | 63 |
| S. platensis | 32.9 | 86.4 | 87.8 | 89.4 | 93.9 |
| C. vulgaris | 29.1 | 48.1 | 53.2 | 53.1 | 51.1 |
Box-Behnken design arrangement and responses_
| RUN | Glucose | Yeast extract | Glutamate | Bioflocculant |
|---|---|---|---|---|
| (g/l) | (g/l) | (g/l) | (g/l) | |
| 1 | 30 | 10 | 2 | 1.30 |
| 2 | 30 | 10 | 2 | 1.19 |
| 3 | 30 | 5 | 1 | 0.9 |
| 4 | 35 | 5 | 2 | 0.65 |
| 5 | 30 | 15 | 3 | 0.95 |
| 6 | 30 | 10 | 2 | 0.89 |
| 7 | 35 | 10 | 3 | 0.79 |
| 8 | 25 | 15 | 2 | 0.57 |
| 9 | 30 | 5 | 3 | 0.87 |
| 10 | 25 | 10 | 1 | 0.32 |
| 11 | 25 | 5 | 2 | 0.54 |
| 12 | 35 | 10 | 1 | 0.79 |
| 13 | 30 | 10 | 2 | 1.22 |
| 14 | 30 | 10 | 2 | 1.28 |
| 15 | 30 | 15 | 1 | 0.92 |
| 16 | 25 | 10 | 3 | 0.58 |
| 17 | 35 | 15 | 2 | 0.65 |