
Fig. 1
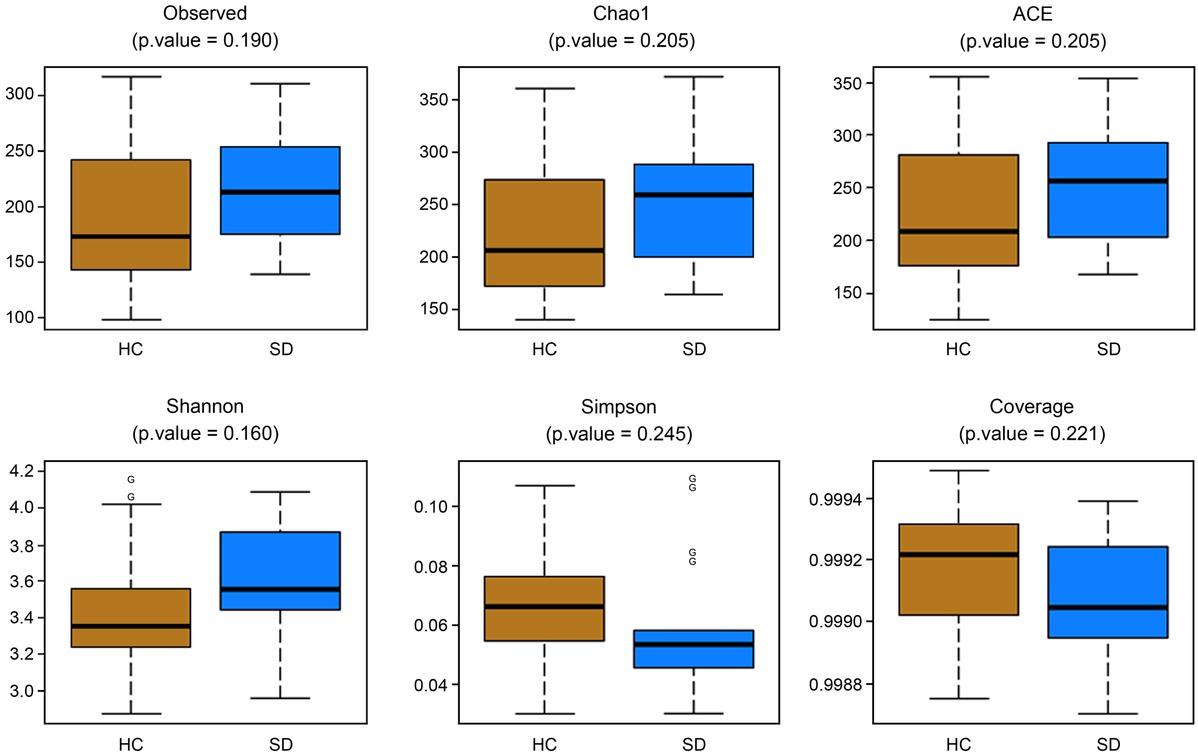
Fig. 2
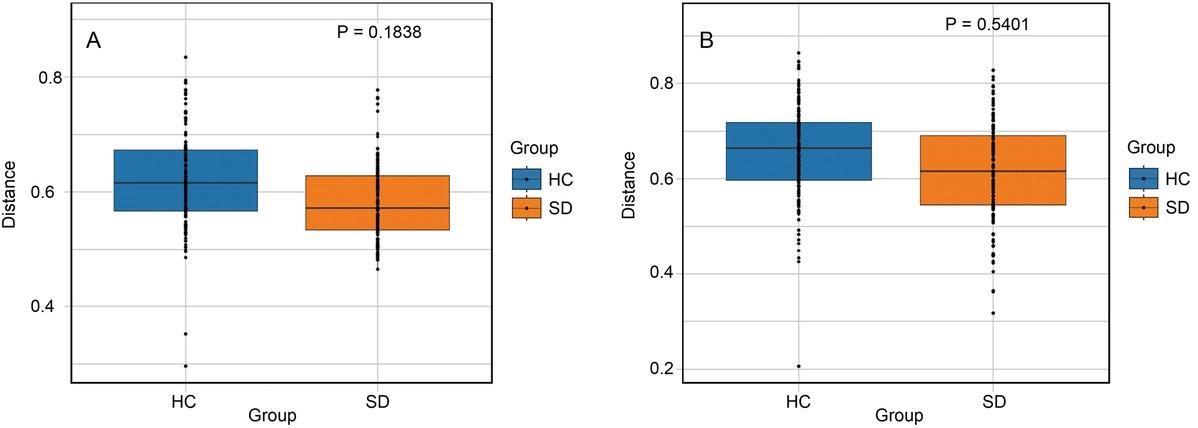
Fig. 3
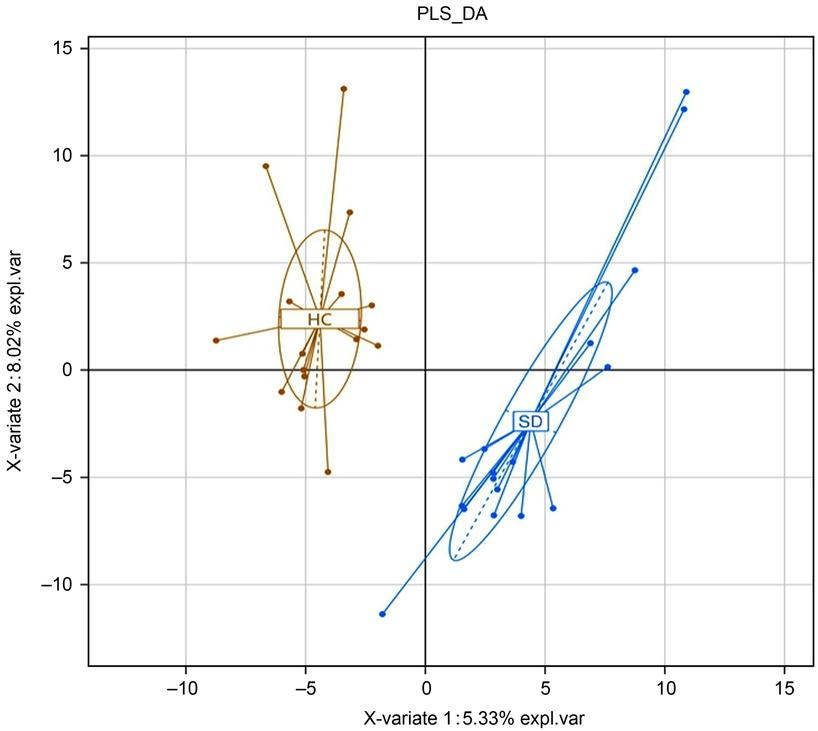
Fig. 4
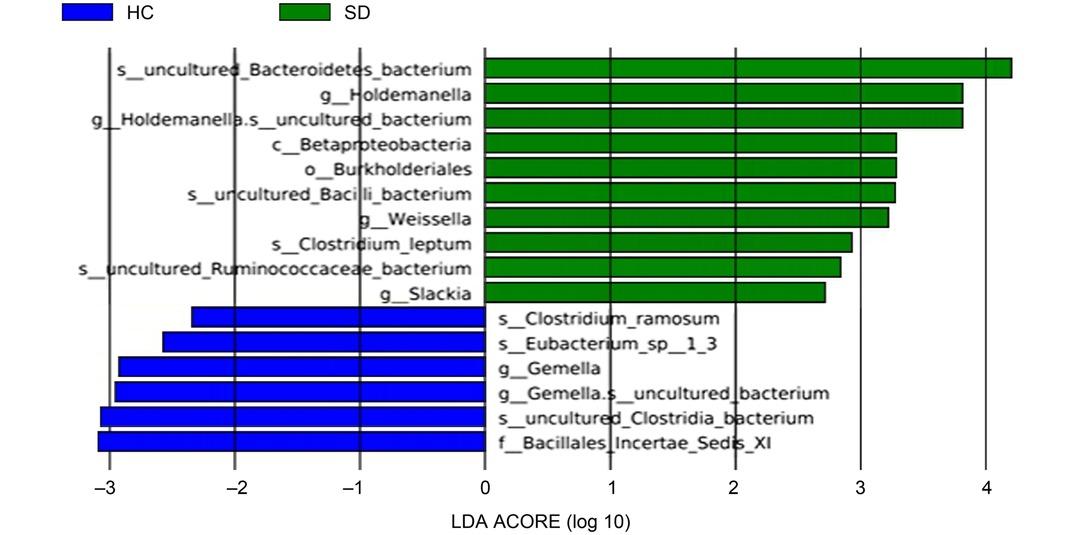
Fig. 5
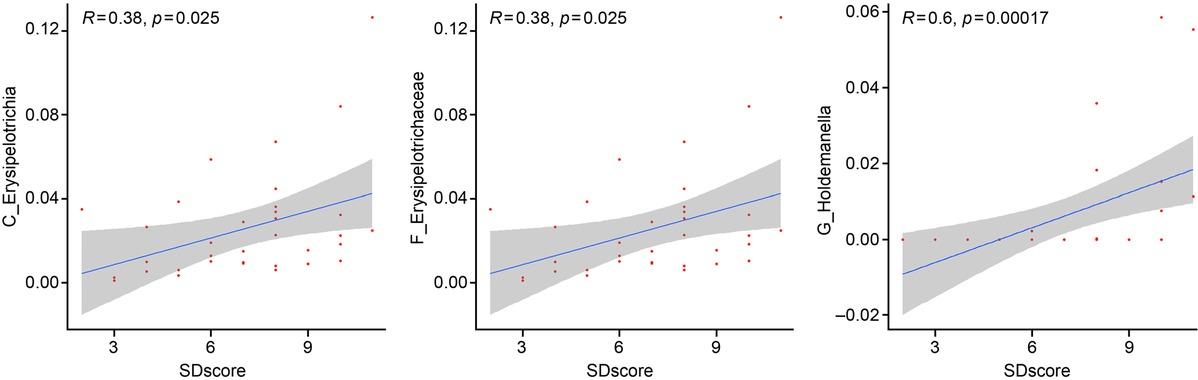
Fig. 6
Correlation analysis of the selected bacterial species with the PSQI score_
| Level | Taxon name | Relative abundance (%) | q-value | r |
|---|---|---|---|---|
| Phylum | Elusimicrobia | 0.171 ± 0.995 | 0.007* | –0.108 |
| Phylum | Tenericutes | 0.123 ± 0.631 | 0.030* | –0.183 |
| Class | Elusimicrobia | 0.171 ± 0.995 | 0.023* | –0.108 |
| Class | Mollicutes | 0.123 ± 0.631 | 0.069 | –0.183 |
| Class | Erysipelotrichia | 2.606 ± 2.604 | 0.276 | 0.384* |
| Order | Elusimicrobiales | 0.171 ± 0.995 | 0.014* | –0.108 |
| Order | Anaeroplasmatales | 0.123 ± 0.631 | 0.058 | –0.183 |
| Order | Desulfovibrionales | 0.303 ± 0.259 | 0.188 | 0.328 |
| Order | Erysipelotrichales | 2.606 ± 2.604 | 0.208 | 0.384 |
| Family | Elusimicrobiaceae | 0.171 ± 0.995 | 0.027* | –0.108 |
| Family | Anaeroplasmataceae | 0.123 ± 0.631 | 0.110 | –0.183 |
| Family | Desulfovibrionaceae | 0.303 ± 0.259 | 0.286 | 0.328 |
| Family | Erysipelotrichaceae | 2.606 ± 2.604 | 0.339 | 0.384* |
| Genus | Holdemanella | 0.647 ± 1.490 | 0.033* | 0.601** |
| Genus | Elusimicrobium | 0.171 ± 0.995 | 0.033* | –0.108 |
| Genus | Asteroleplasma | 0.123 ± 0.631 | 0.159 | –0.183 |
| Species | uncultured_proteobacterium | 0.128 ± 0.748 | 0.035* | –0.183 |
| Species | uncultured_bacterium | 3.700 ± 2.810 | 0.707 | 0.323 |
Demographic characteristics of the participants_
| Characteristics | SD (n = 17) | HC (n = 17) | p-value | |
|---|---|---|---|---|
| Male/Female | 10/7 | 7/10 | 0.159 | 0.303 |
| Age (years) | 20.059 ± 0.785 | 19.662 ± 0.611 | 1.646 | 0.109 |
| BMI (kg/m2) | 21.229 ± 2.194 | 20.167 ± 2.172 | 1.419 | 0.166 |
| PSQI score | 9.059 ± 1.144 | 5.118 ± 1.576 | 8.342 | < 0.001 |