
Fig. 1
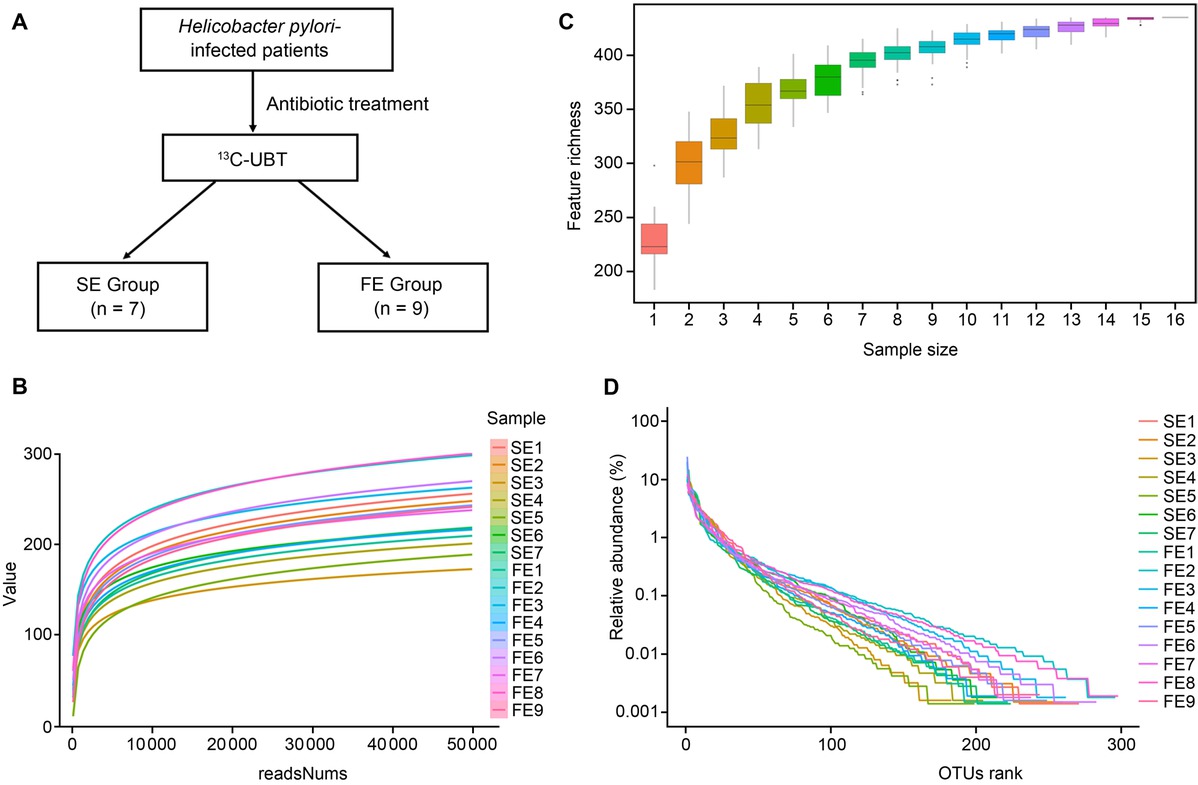
Sample collection and qualification of 16S rRNA sequencing.
A) A schematic diagram illustrating the sample collection process; B) rarefaction curve analysis; C) specaccum curve analyses; D) rank abundance analysis; n = 7 for the SE group, n = 9 for the FE group; FE – failure eradication, SE – successful eradication, HP – Helicobacter pylori.
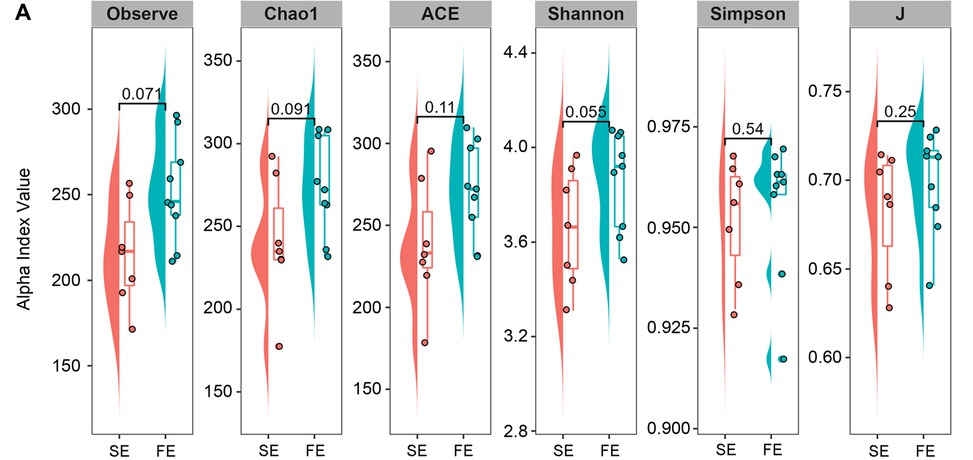
Fig. 2
α and β Diversity analyses.
A) Observed species, Chao1 richness, ACE index, Shannon index, Simpson index, and J index were calculated for α diversity of the oral microbiota.
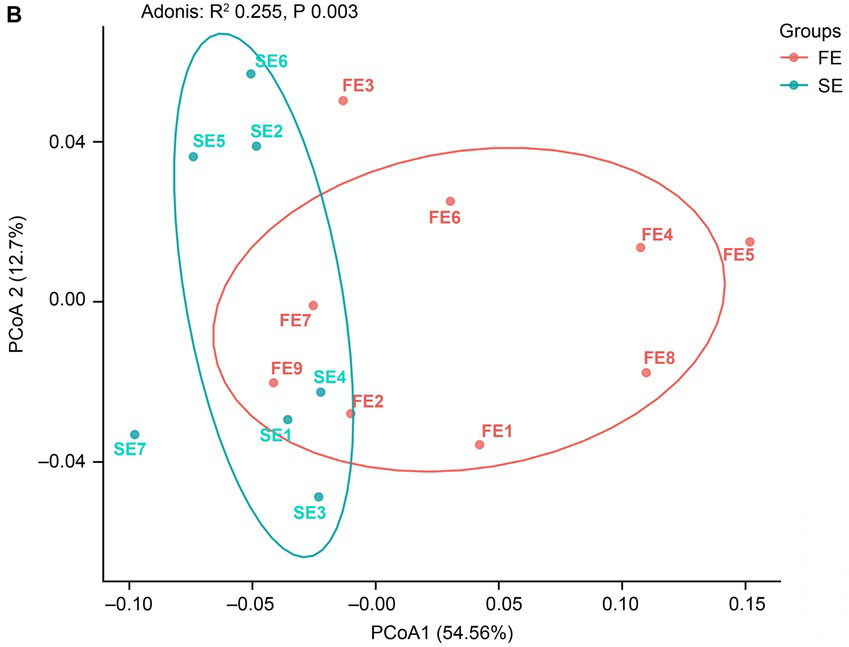
Fig. 2
α and β Diversity analyses.
B) PCoA analysis for β diversity of the oral microbiota; SE – patients with successful eradication therapy, FE – patients with failed eradication therapy.
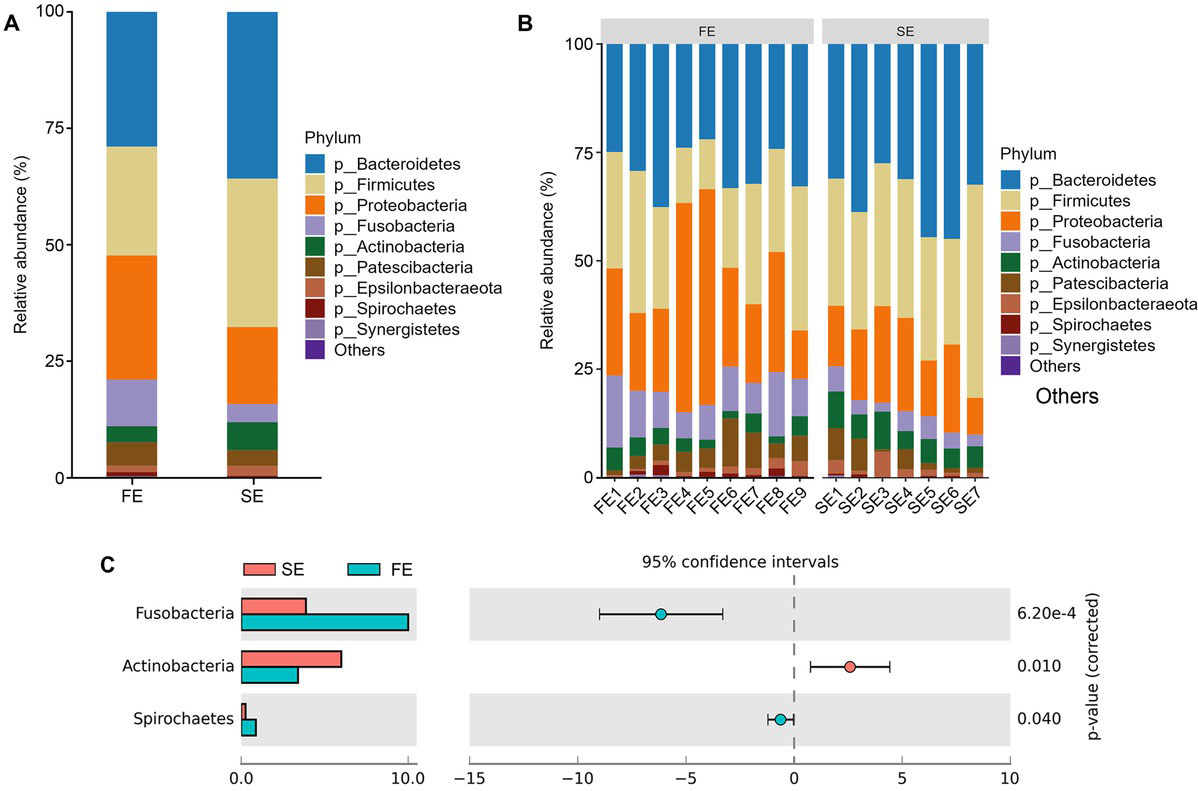
Fig. 3
Component analysis of community structure.
A) Relative abundances of the ten most abundant bacterial phyla in the FE and SE groups; B) relative abundances of the indicated individuals’ ten most abundant bacterial phyla; C) t-test analysis comparing oral microbiota composition between the FE and SE groups.
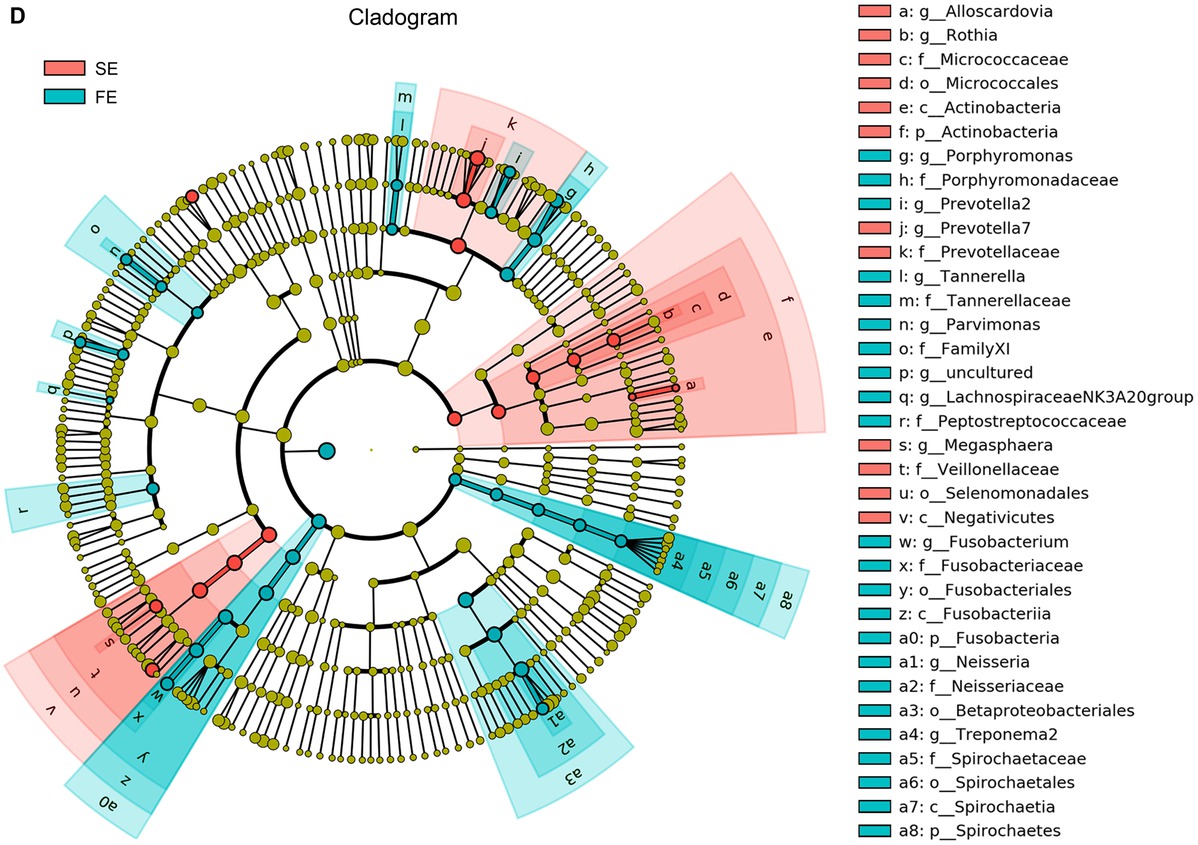
Fig. 3
Component analysis of community structure.
D) cladogram generated from LEfSe analysis.
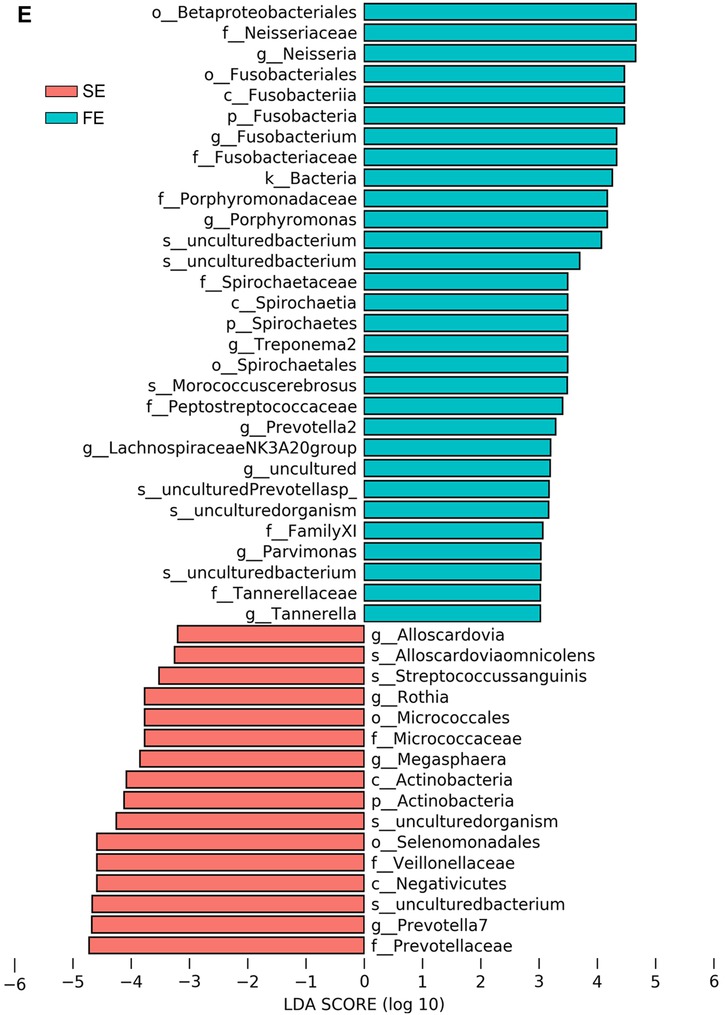
Fig. 3
Component analysis of community structure.
E) LDA scores of significantly altered taxa presented in panel D; n = 7 for the SE group, n = 9 for the FE group; SE – patients with successful eradication therapy, FE – patients with failed eradication therapy.
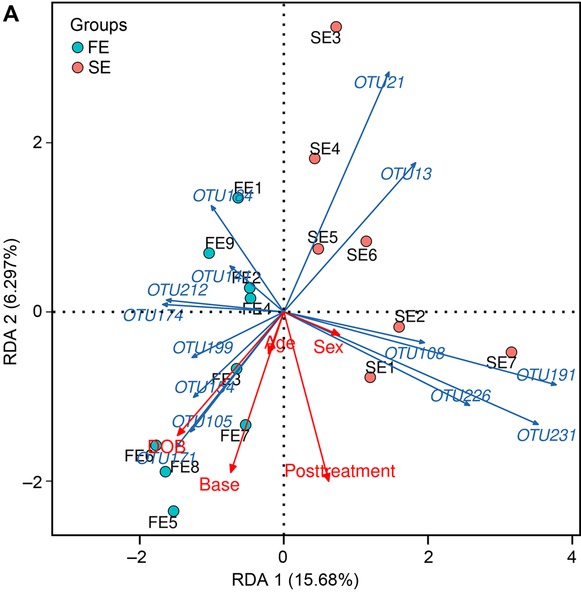
Fig. 4
Correlation analysis of microbial environmental factors.
A) RDA analysis comparing OTUs between the FE and SE groups.
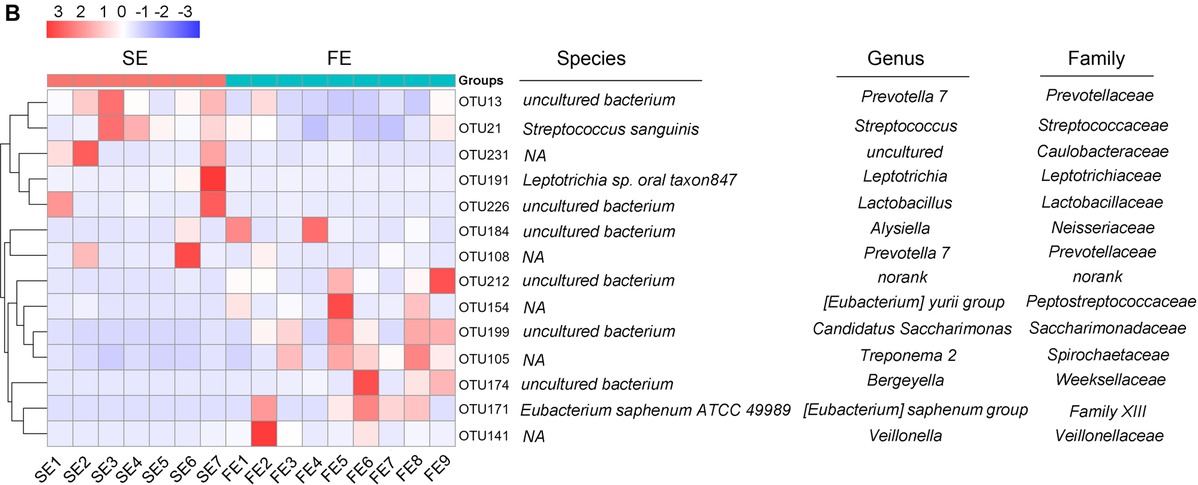
Fig. 4
Correlation analysis of microbial environmental factors.
E) KEGG analysis diagram; n = 7 for the SE group, n = 9 for the FE group; SE – patients with successful eradication therapy, FE – patients with failed eradication therapy.
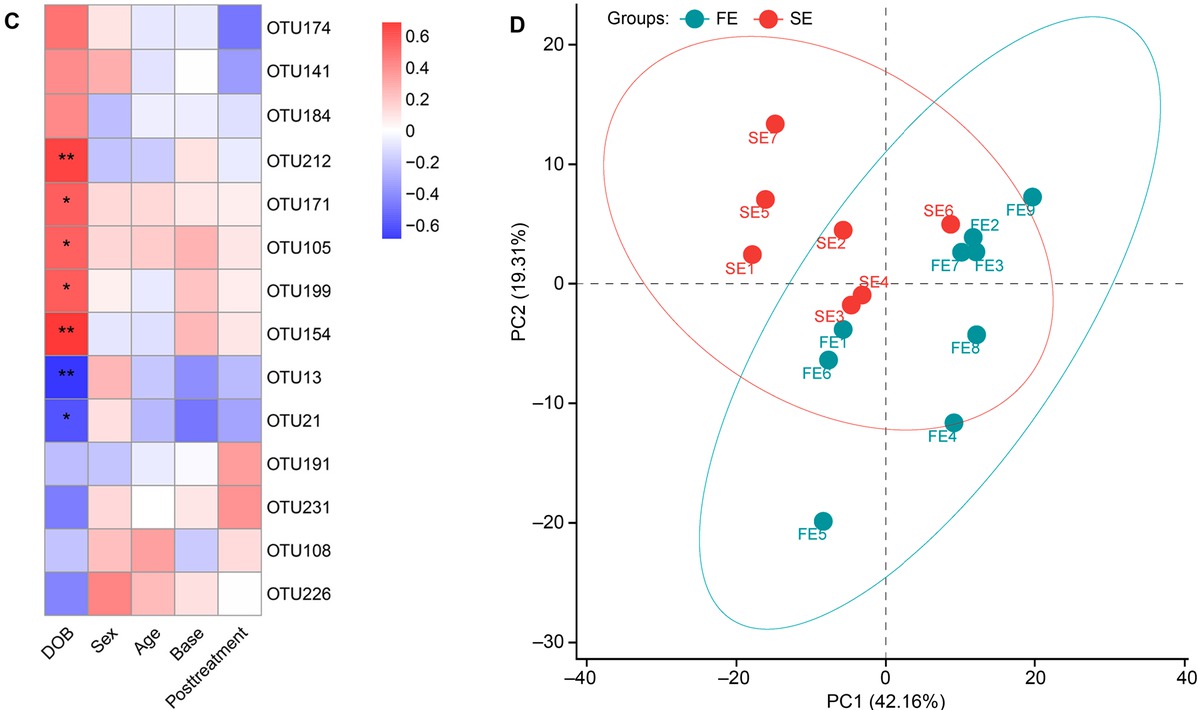
Fig. 4
Correlation analysis of microbial environmental factors.
B) heat map analysis based on RDA analysis showing the abundance of 14 OTUs influenced by Helicobacter pylori infection.
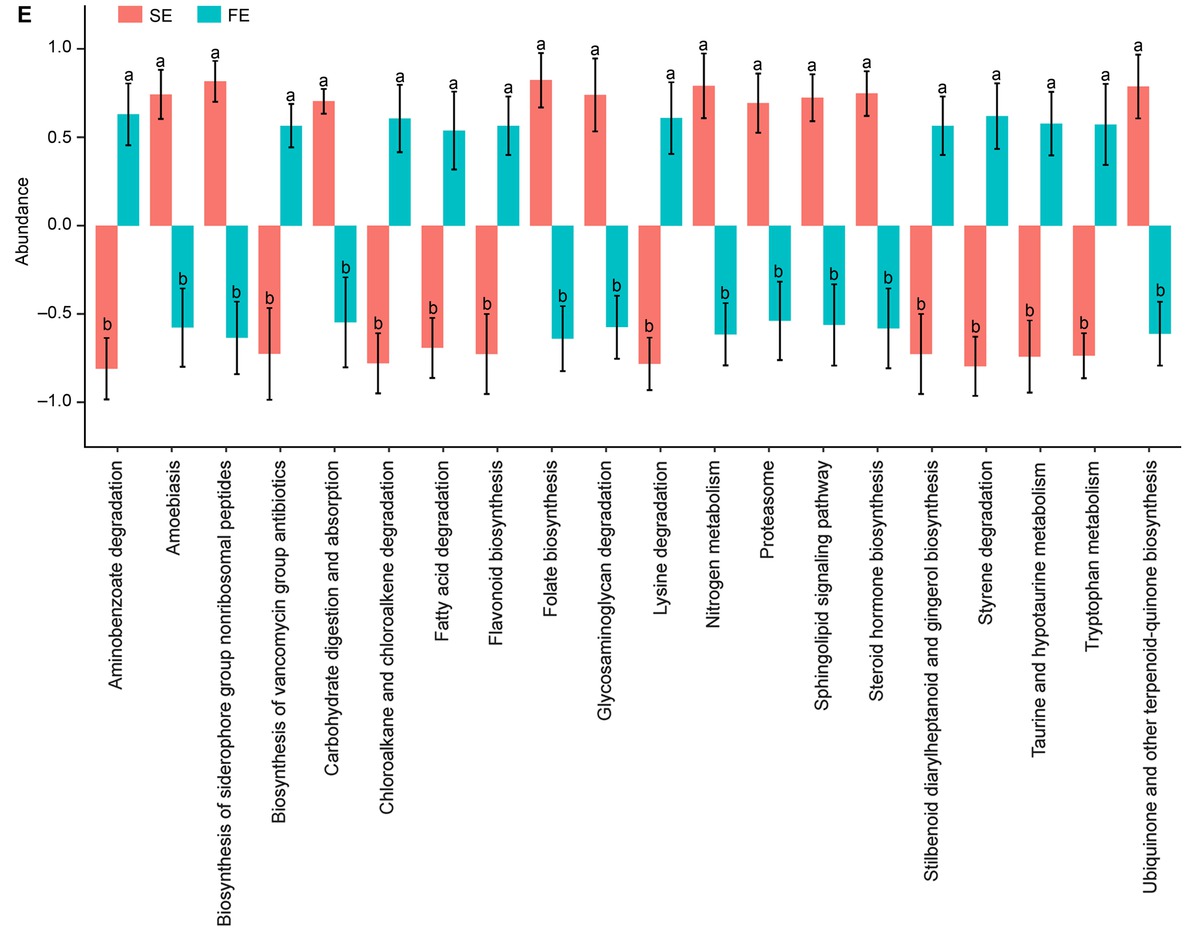
Fig. 4
Correlation analysis of microbial environmental factors.
C) correlations of the abundances of 14 OTUs with DOB values, ages, sex, and treatment status in patients from either FE or SE groups;
*p < 0.05, **p < 0.01; PICRUSt2 function prediction of changed OTUs; D) PCA analysis.
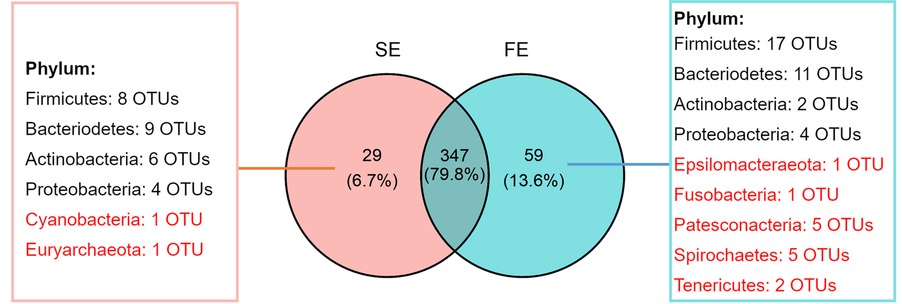
Fig. 5
Venn analysis revealing differently affected and overlapping OTUs between the FE and SE groups; n = 7 for the SE group, n = 9 for the FE group; SE – patients with successful eradication therapy, FE – patients with failed eradication therapy.