
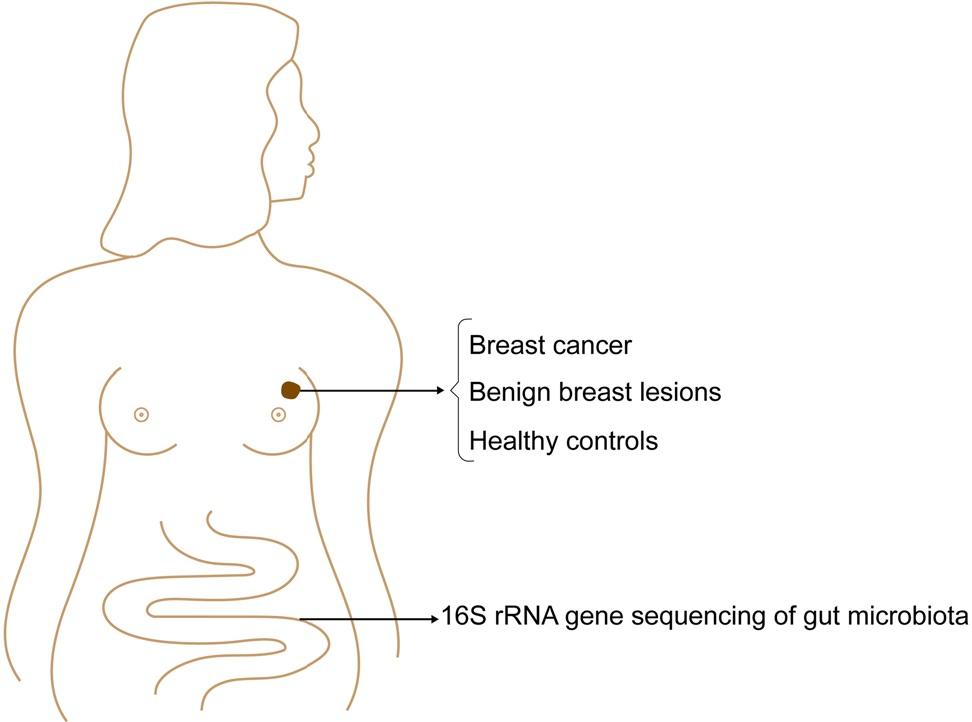
Fig. 1
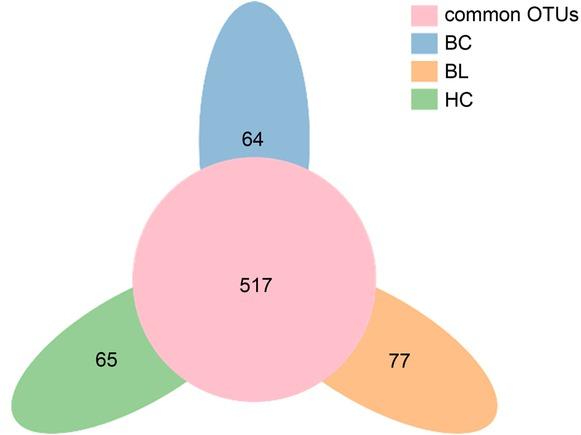
Fig. 2
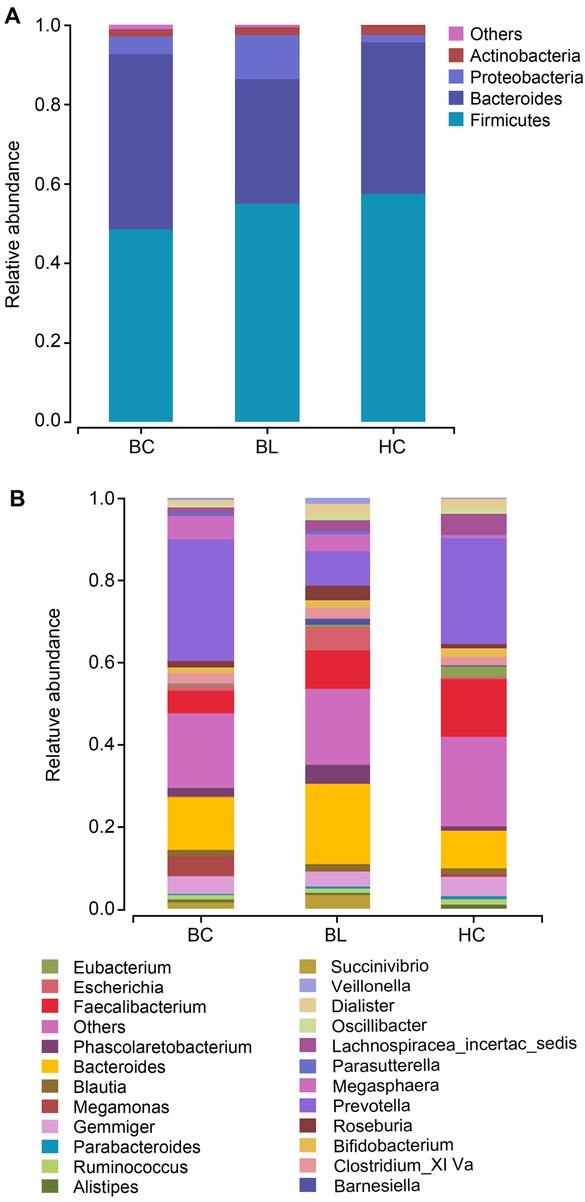
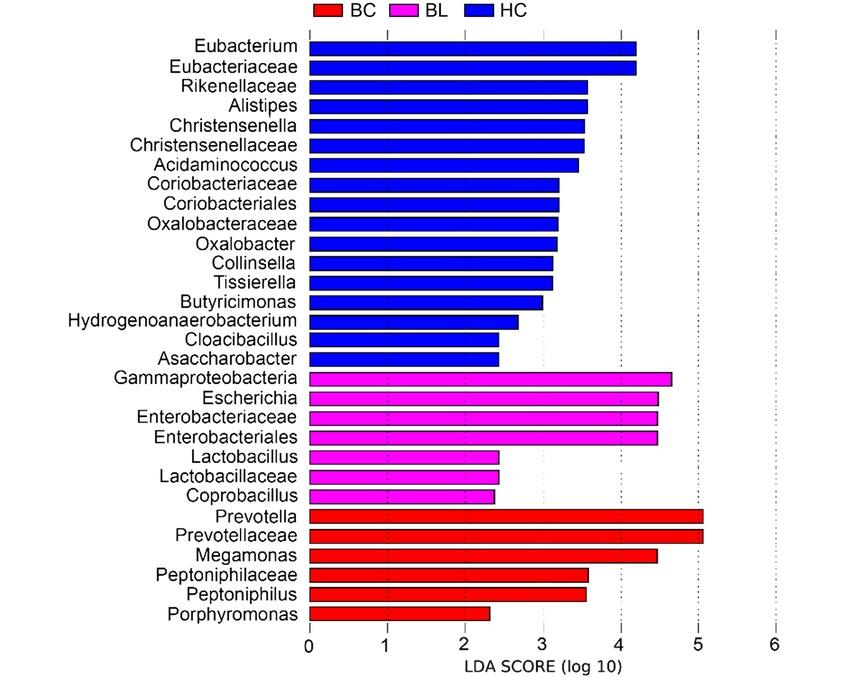
Fig. 3
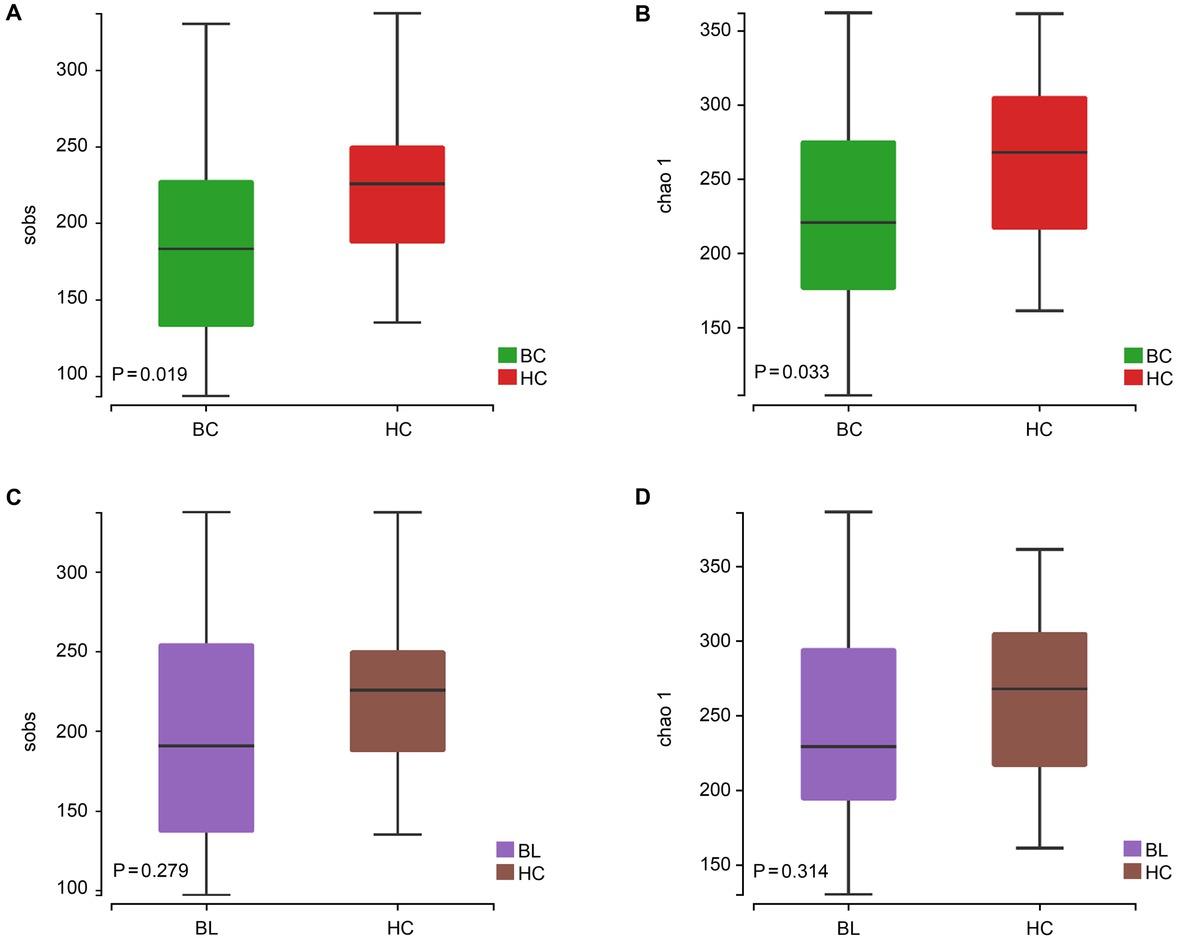
Fig. 4
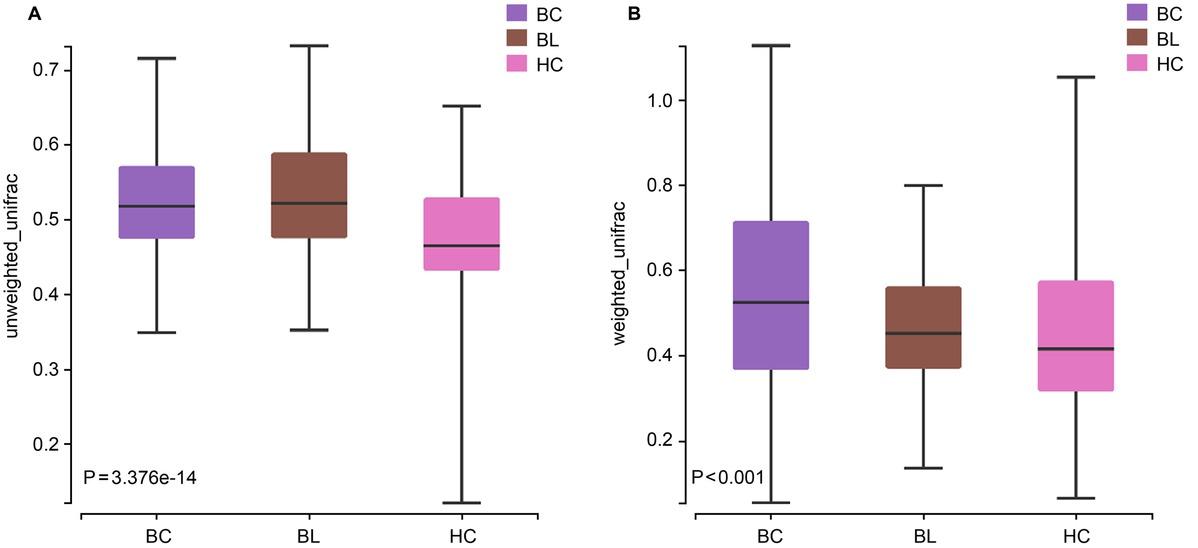
Fig. 5
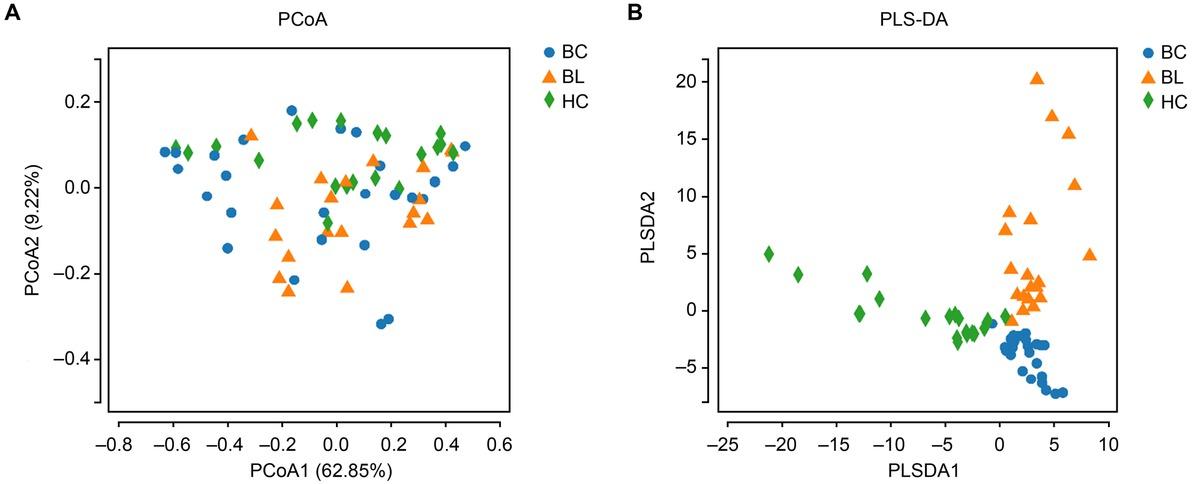
Fig. 6
Changes in bacterial abundance at the genus level in patients with breast cancer and benign breast lesions_
| Breast cancer | Benign breast lesions | ||
|---|---|---|---|
| More abundant genera | Less abundant genera | More abundant genera | Less abundant genera |
| Escherichia | Faecalibacterium | Escherichia | Collinsella |
| Peptoniphilus | Lachnospiracea_incertae_sedis | Peptoniphilus | Alistipes |
| Bilophila | Collinsella | Coprobacillus | Megamonas |
| Lactobacillus | Alistipes | Lactobacillus | Butyricimonas |
| Porphyromonas | Anaerofilum | Porphyromonas | Acidaminococcus |
| Christensenella | Asaccharobacter | ||
| Butyricimonas | Tissierella | ||
| Erysipelothrix | Cloacibacillus | ||
| Acidaminococcus | |||
| Victivallis | |||
| Eubacterium | |||
| Tissierella | |||
| Hydrogenoanaerobacterium | |||
| Cloacibacillus | |||
| Oxalobacter | |||
Baseline characteristics of the patients enrolled_
| Healthy controls | Breast cancer | Benign breast lesions | |
|---|---|---|---|
| No. of individuals | 20 | 26 | 20 |
| Gender (male/female) | 0/20 | 0/26 | 0/20 |
| Mean age (± SD, years) | 46.90 (10.87) | 49.62 (7.33) | 48.95 (8.73) |
| Mean BMI (± SD, kg/m2) | 22.80 (2.02) | 22.88 (1.98) | 21.71 (2.20) |