
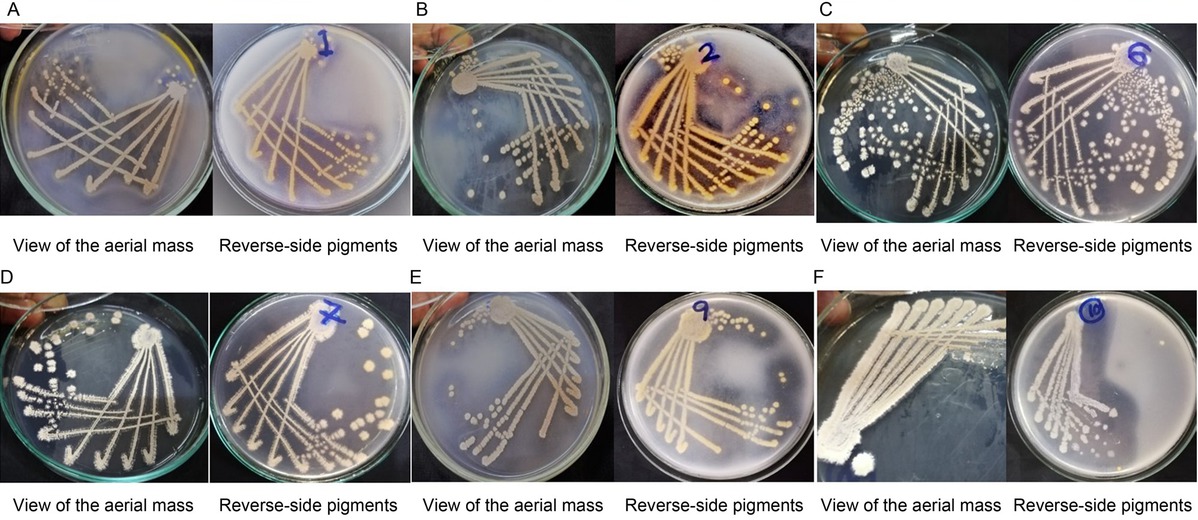
Fig. 1
Colony morphologies of actinomycete isolates. The view of the aerial mass and reverse-side pigment colors of isolates Ac-1 (A), Ac-2 (B), Ac-6 (C), Ac-7 (D), Ac-9 (E), and Ac-10 (F) on modified-starch casein agar after 1–2 weeks of incubation at 28°C.
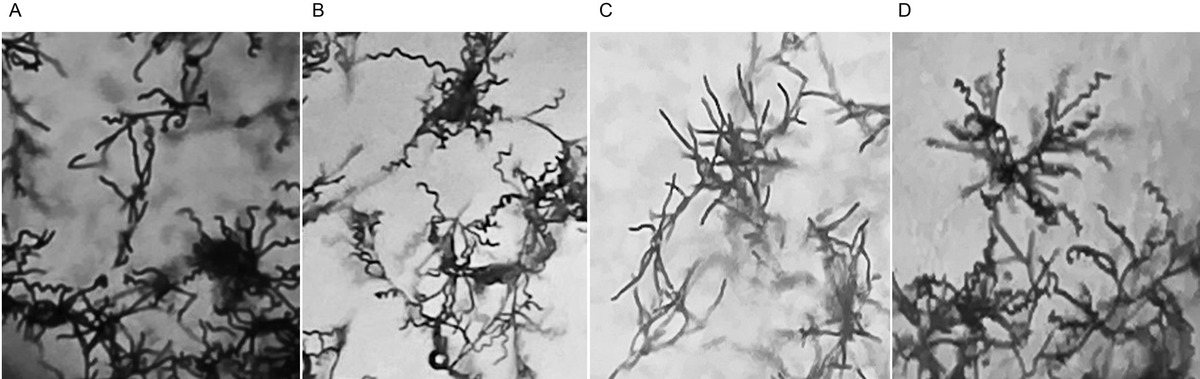
Fig. 2
Spore chain morphologies of actinomycete isolates. Spore chain morphologies of actinomycetes Ac-1 (A), Ac-2 (B), Ac-6 (C), and Ac-9 (D) as observed under a light microscope (magnification 100×).
Table I
Characteristics of actinomycete isolates.
| Isolate name | Colony morphology | Gram’s reaction | Spore chain morphology | Catalase production | |
|---|---|---|---|---|---|
| Aerial mass color | Reverse side pigment color | ||||
| Ac-1 | greyish white | yellowish green | + | open spirals | + |
| Ac-2 | greyish white | yellowish orange | + | biverticillate with spirals | + |
| Ac-6 | white | – | + | flexuous | + |
| Ac-7 | white | – | + | flexuous | + |
| Ac-9 | greyish white | yellowish grey | + | open spirals | + |
| Ac-10 | white | – | + | pleomorphic bacilli | + |
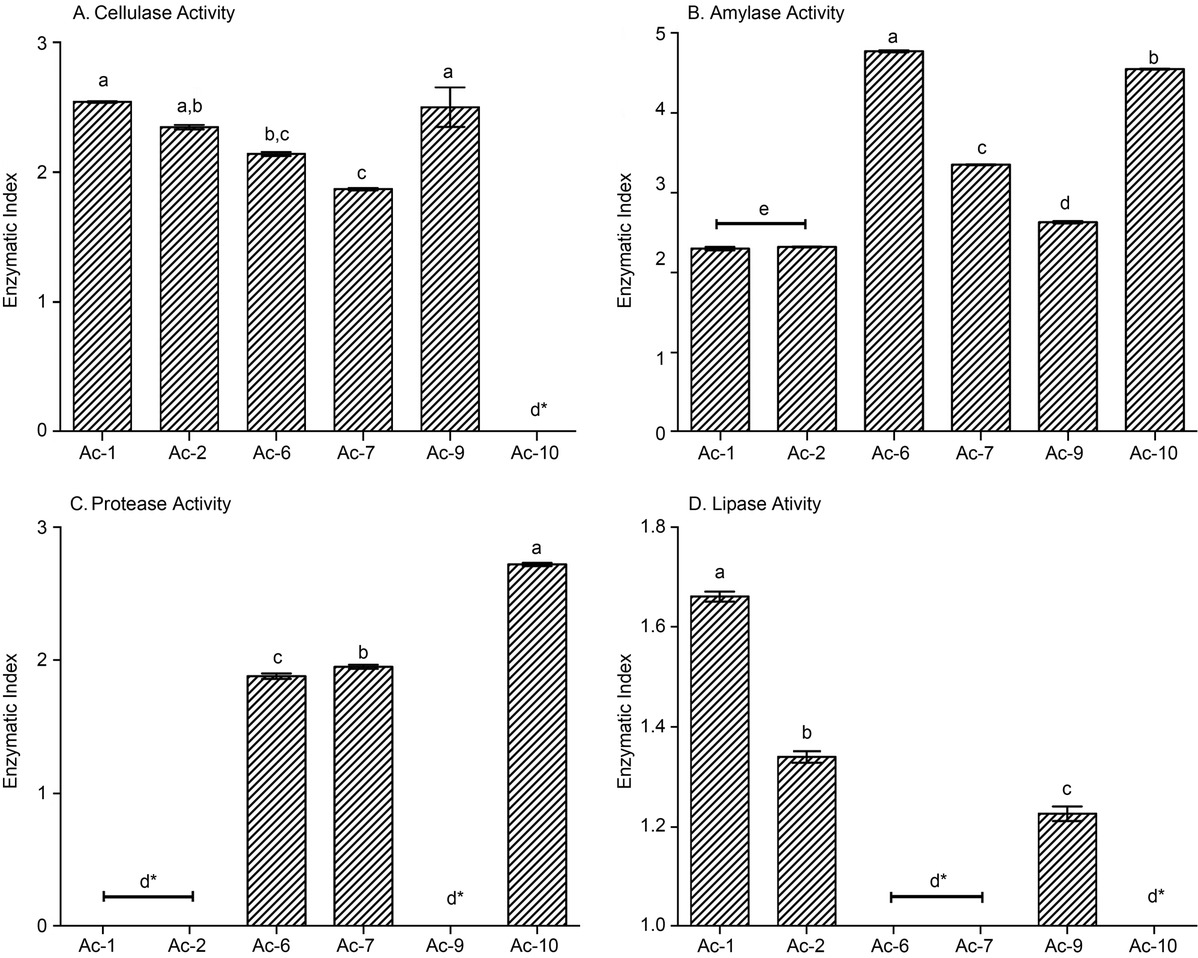
Fig. 3
Extracellular enzyme production of actinomycete isolates. Actinomycete isolates were tested for the production of cellulase (A), amylase (B), protease (C), and lipase (D)separately on solid agar media. The ‘Enzymatic Index’ for each enzyme assay was expressed using the ratio between the average diameter of the halo/clear zone around the colony and the average diameter of the colony. Error bars represent the standard error of the mean (n = 3). The bars indicated with the same lower case letter are not significantly different from those in the same graph (Tukey’s test, p < 0.05).
* – no visible enzymatic activity
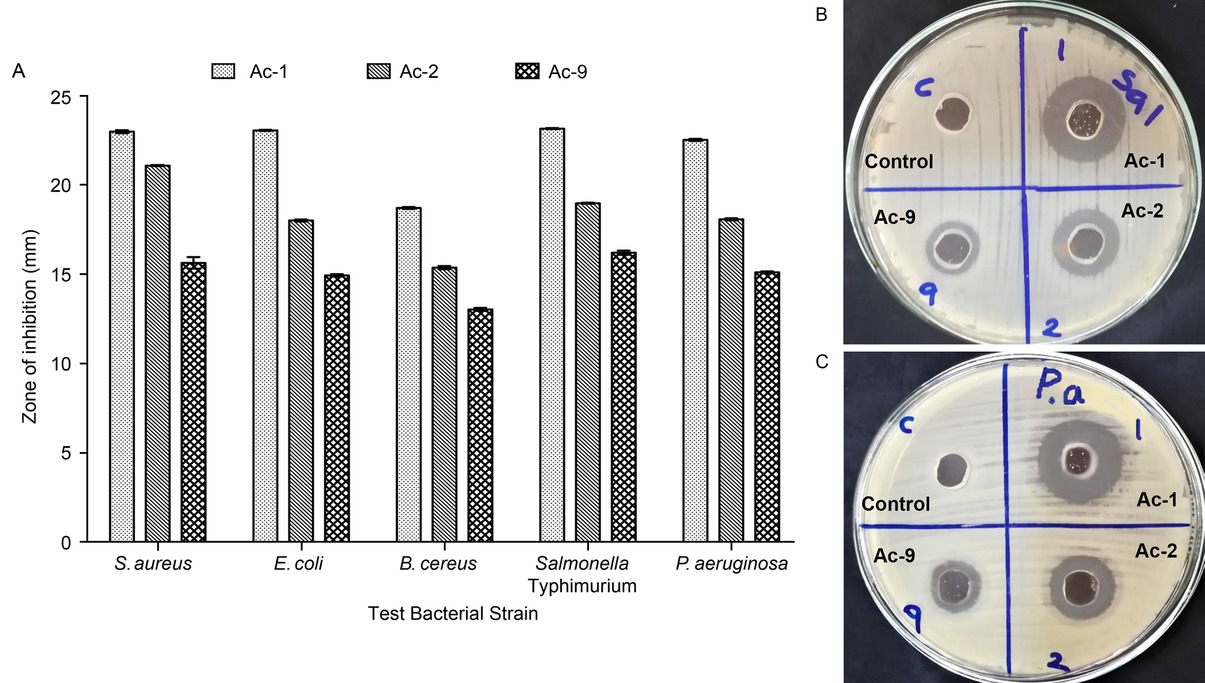
Fig. 4
Antibacterial activity of selected actinomycete isolates against test strains. The cell-free supernatants of selected actinomycete isolates were tested against selected test bacterial pathogens using a standard well-diffusion assay. The average diameter of the zones of inhibition for each cell-free supernatant was calculated using three independent replicates. Error bars indicate the standard error of the mean (A). Plates show the inhibition zones given by cell-free supernatants of Ac-1, Ac-2, and Ac-9 against Salmonella Typhimurium (B) and Pseudomonas aeruginosa (C) on Mueller-Hinton agar after the incubation.
Table II
Antibacterial activity of actinomycete isolates against the test strains in the cross-streak assay.
| Strain ID | Test strain | |||
|---|---|---|---|---|
| Staphylococcus aureus | Escherichia coli | Bacillus cereus | Listeria monocytogenes | |
| Ac-1 | ++ | ++ | + | – |
| Ac-2 | ++ | + | + | – |
| Ac-6 | – | – | – | – |
| Ac-7 | – | – | – | – |
| Ac-9 | + | + | + | – |
| Ac-10 | – | – | – | – |
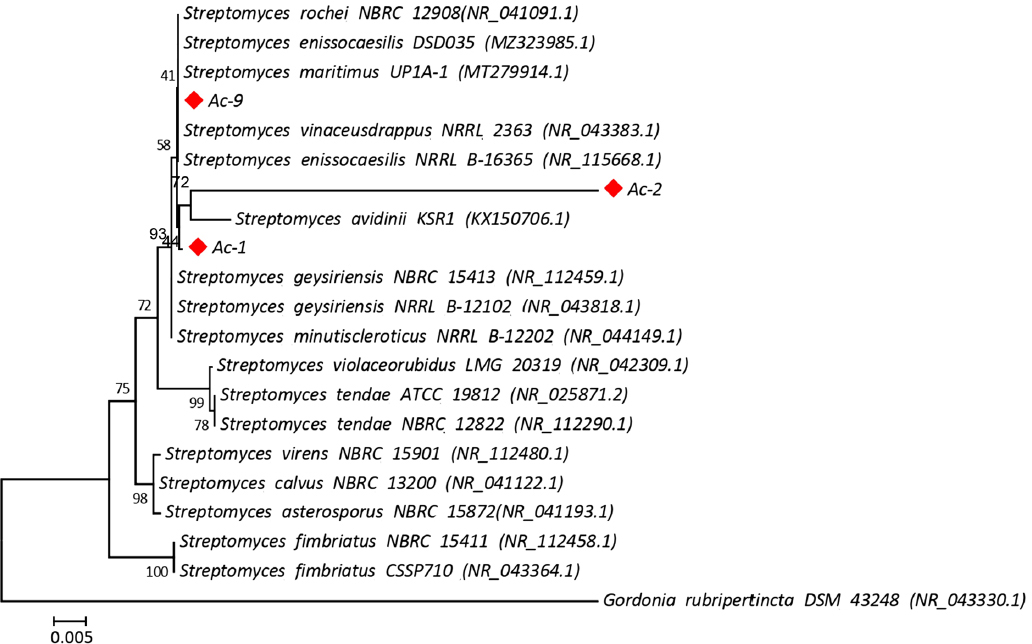
Fig. 5
Phylogenetic relationship based on the partial 16s rRNA gene sequences. The evolutionary relationships of Streptomyces isolates (Ac-1, Ac-2, and Ac-9) were inferred via a neighbor-joining method. Strains isolated in this study are indicated with a red diamond ( ). Bootstrap support values from 1,000 replicates are shown next to the branches. Gordonia rubripertincta was used as the out-group of the analysis. The scale bar represents 0.005 nucleotide substitutions per character.
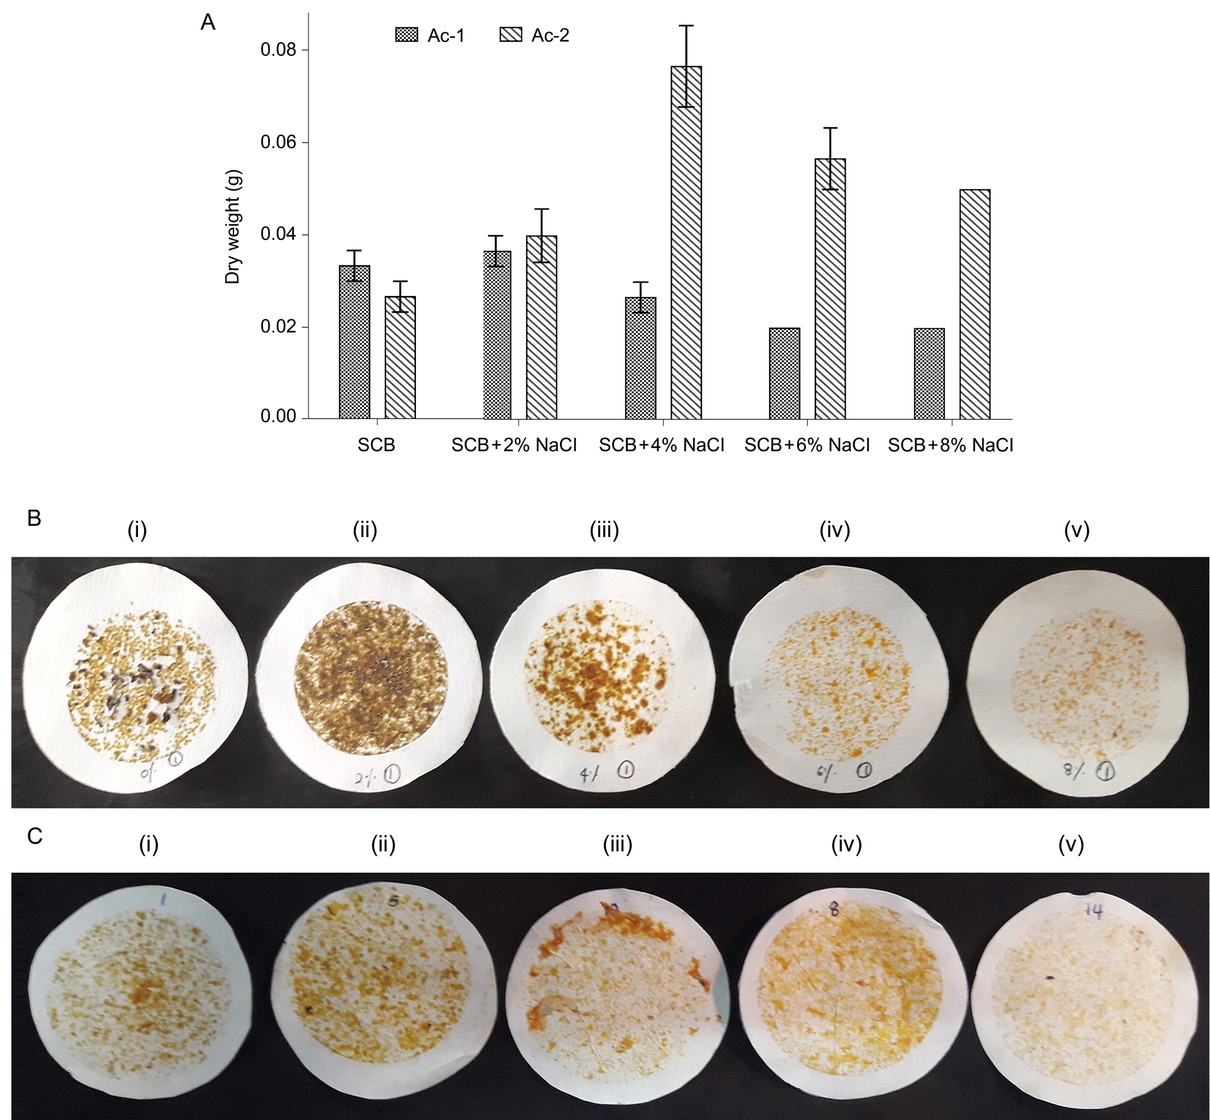
Fig. 6
Effect of salt concentration of the medium for the growth of actinomycete isolates. Isolates Ac-1 and Ac-2 were grown in modified-starch casein broth (SCB) supplemented with different NaCl concentrations, and the dry weight of the resulting biomass was measured after the incubation. Values represent the mean of three independent replicates (n = 3) , and error bars represent the standard error of the mean (A). The biomass of Ac-1 (B) and Ac-2 (C) grown in modified-SCB supplemented with (i) 0%, (ii) 2%, (iii) 4%, (iv) 6%, and (v) 8% NaCl were filtered and dried on a sterile filter paper.
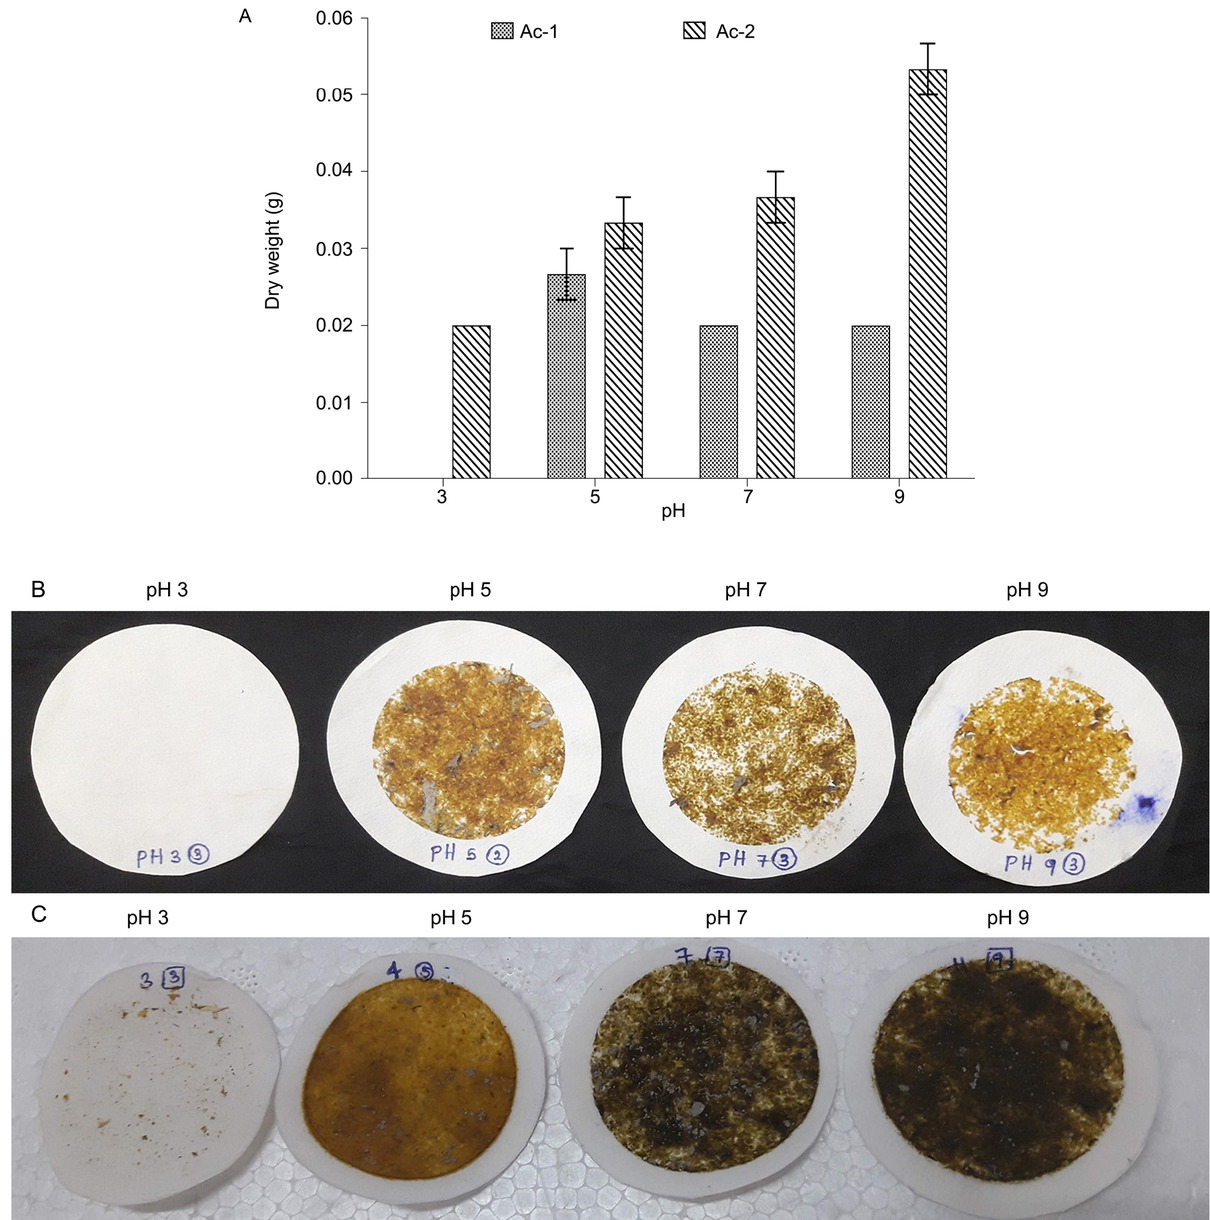
Fig. 7
Effect of initial pH of the medium for the growth of actinomycete isolates. Isolates Ac-1 and Ac-2 were grown in modified-starch casein broth (SCB) adjusted to different initial pH, and the dry weight of the resulting biomass was measured after the incubation. Values represent the mean of three independent replicates (n = 3) and error bars represent the standard error of the mean (A). The biomass of Ac-1 (B) and Ac-2 (C) grown in modified-SCB with different initial pH values (3, 5, 7, and 9) were filtered and dried on sterile filter paper.
Table III
Comparison of growth of actinomycete isolates Ac-1 and Ac-2 under shaking and non-shaking conditions.
| Growth condition | Dry weight of the biomass (g)# | |
|---|---|---|
| Ac-1 | Ac-2 | |
| With shaking (at 100 rpm) | 0.023 ± 0.003** | 0.043 ± 0.006* |
| Without shaking | 0.000** | 0.057 ± 0.006* |
[i] # – The biomass was obtained by drying the culture resulting from inoculation 25 ml of SCB and incubation for seven days at room temperature under shaking and non-shaking conditions. The values given are the means of three individual replicates (n = 3) with a standard error of mean (± SEM). Means followed by an asterisk/asterisks within a column, are significantly different (unpaired t-test, ** p < 0.005, * p < 0.05).
Table IV
Antibacterial activity of actinomycete crude pigment extracts against test strains in well-diffusion assay.
| Test organism | Average diameter of the zone of inhibition (mm) ± SEM* | |
|---|---|---|
| Ac-1 | Ac-2 | |
| Escherichia coli | – | 21.0 ± 0.5774 |
| Pseudomonas aeruginosa | – | 18.0 ± 0.0 |
| Staphylococcus aureus | – | 22.5 ± 0.2881 |

Fig. 8
Application of yellow-colored pigment of Ac-1 as a fabric colorant. Six different commercially available fabric types, ‘Kushbu’, silk-cotton blend fabric, polyester, satin, poplin, and terrine, were dyed using acetone-extracted crude pigments of Streptomyces spp. Ac-1.