
Fig. 1
Fig. 2
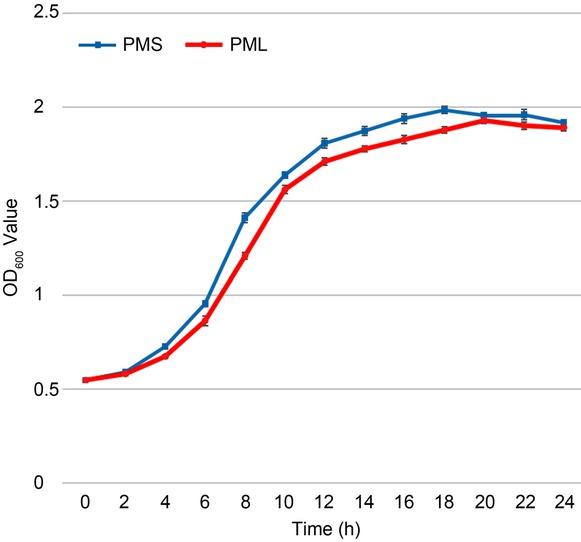
Fig. 3
Fig. 4
Fig. 5
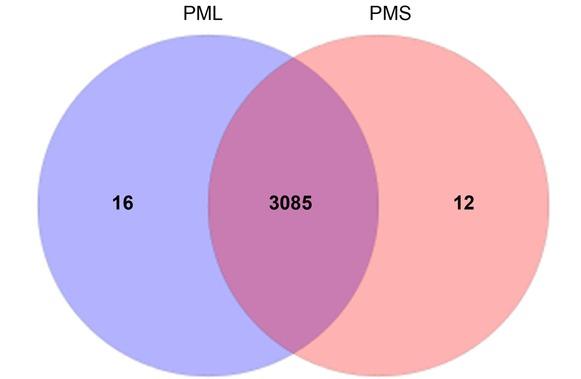
Fig. 6
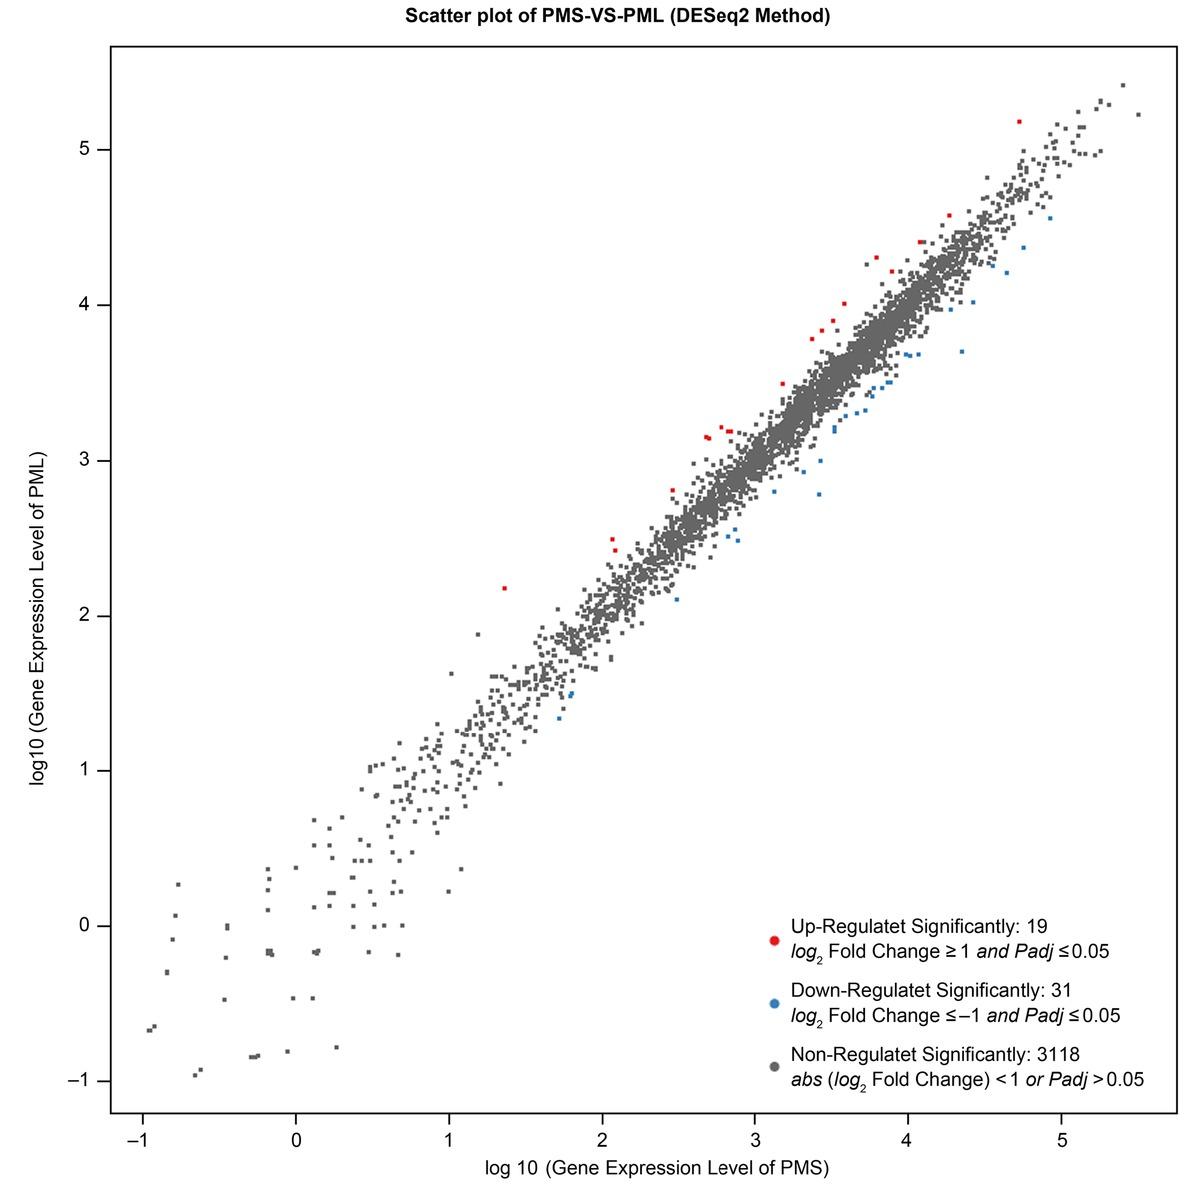
Fig. 7
Statistics of differentially expressed genes (DEGs)_
| Gene ID | Expression (up/down) | Log2 FoldChang (PML/PMS) | Adjusted p-value | Gene products |
|---|---|---|---|---|
| csdA | up | 1.308 | < 0.001 | cysteine sulfinate desulfinase |
| csdE | up | 1.156 | < 0.001 | cysteine desulfuration protein |
| cutC | up | 1.323 | 0.004 | choline trimethylamine-lyase |
| phoA | up | 1.686 | 0.002 | alkaline phosphatase |
| pspA | up | 1.077 | 0.003 | phage shock protein A |
| pspB | up | 1.107 | 0.002 | phage shock protein B |
| pstB | up | 1.423 | 0.049 | phosphate transport system ATP-binding protein |
| rplT | up | 1.060 | 0.023 | large subunit ribosomal protein |
| ugpA | up | 1.439 | 0.002 | phosphate transport system ATP-binding protein |
| ugpB | up | 1.377 | < 0.001 | phosphate transport system ATP-binding protein |
| ugpC | up | 1.228 | 0.010 | phosphate transport system ATP-binding protein |
| ugpE | up | 1.575 | 0.002 | phosphate transport system ATP-binding protein |
| PMI_RS02645 | up | 1.148 | < 0.001 | fimbria/pilus periplasmic chaperon |
| PMI_RS09180 | up | 1.031 | 0.022 | cysteine desulfurase |
| PMI_RS09250 | up | 1.064 | 0.009 | sensor histidine kinase |
| PMI_RS13360 | up | 2.720 | < 0.001 | small multidrug resistance pump |
| PMI_RS13370 | up | 1.424 | 0.017 | putative phosphotransacetylase |
| PMI_RS14325 | up | 1.473 | 0.023 | amino acid transport system substrate-binding protein |
| PMI_RS17915 | up | 1.520 | < 0.001 | Cd2+/Zn2+-exporting ATPase |
| artP | down | –1.009 | < 0.001 | arginine transport system ATP-binding protein |
| cyoB | down | –1.290 | 0.022 | cytochrome o ubiquinol oxidase subunit I |
| epd | down | –1.011 | 0.007 | D-erythrose 4-phosphate dehydrogenase |
| fadB | down | –1.330 | 0.016 | 3-hydroxyacyl-CoA dehydrogenase |
| fadE | down | –1.045 | 0.047 | acyl-CoA dehydrogenase |
| feoA | down | –1.277 | < 0.001 | ferrous iron transport protein A |
| glpA | down | –1.465 | 0.005 | glycerol-3-phosphate dehydrogenase |
| glpB | down | –1.348 | 0.023 | glycerol-3-phosphate dehydrogenase |
| glpT | down | –1.221 | 0.003 | glycerol-3-phosphate transporter |
| ilvN | down | –1.080 | 0.018 | acetolactate synthase I/III small subunit |
| metI | down | –1.178 | 0.003 | D-methionine transport system permease protein |
| msrB | down | –1.021 | < 0.001 | peptide-methionine oxide reductase |
| phsA | down | –1.181 | 0.046 | thiosulfate reductase |
| ptsG | down | –1.099 | < 0.001 | PTS system, glucose-specific IIB component |
| PMI_RS00340 | down | –1.105 | < 0.001 | protein NrfC |
| PMI_RS00505 | down | –1.210 | 0.048 | cytochrome ubiquinol oxidase subunit III |
| PMI_RS00510 | down | –1.283 | 0.036 | cytochrome ubiquinol oxidase subunit IV |
| PMI_RS07940 | down | –1.255 | 0.028 | – |
| PMI_RS09930 | down | –1.008 | 0.048 | toxin CptA |
| PMI_RS10955 | down | –2.137 | < 0.001 | major pilin subunit PapA |
| PMI_RS13425 | down | –1.001 | < 0.001 | phosphorelay signal transduction system |
| PMI_RS13430 | down | –1.190 | < 0.001 | TetR/AcrR family transcriptional regulator |
| PMI_RS14090 | down | –1.029 | < 0.001 | putative transport protein |
| PMI_RS14825 | down | –1.315 | 0.017 | Mat/Ecp fimbriae adhesion |
| PMI_RS14830 | down | –1.430 | 0.012 | Mat/Ecp fimbriae outer membrane usher protein |
| PMI_RS14835 | down | –1.349 | 0.037 | Mat/Ecp fimbriae periplasmic chaperone |
| PMI_RS14840 | down | –2.151 | 0.048 | Mat/Ecp fimbriae adhesion |
| PMI_RS15035 | down | –1.003 | 0.027 | cation/acetate symporter |
| PMI_RS15880 | down | –1.250 | < 0.001 | glycerol uptake facilitator protein |
| PMI_RS17135 | down | –1.018 | 0.020 | minor fimbrial subunit |
| PMI_RS18425 | down | – 1.060 | 0.023 | putative oxidoreductase |
OD600 value of PML and PMS_
| Time (h) | PML | PMS |
|---|---|---|
| 0 | 0.548 ± 0.005 | 0.547 ± 0.006 |
| 2 | 0.581 ± 0.008 | 0.591 ± 0.005 |
| 4 | 0.674 ± 0.010 | 0.726 ± 0.005 |
| 6 | 0.863 ± 0.026 | 0.955 ± 0.012 |
| 8 | 1.206 ± 0.018 | 1.411 ± 0.026 |
| 10 | 1.560 ± 0.022 | 1.636 ± 0.013 |
| 12 | 1.709 ± 0.019 | 1.806 ± 0.027 |
| 14 | 1.776 ± 0.016 | 1.872 ± 0.024 |
| 16 | 1.826 ± 0.021 | 1.938 ± 0.025 |
| 18 | 1.876 ± 0.018 | 1.983 ± 0.015 |
| 20 | 1.927 ± 0.018 | 1.955 ± 0.014 |
| 22 | 1.900 ± 0.019 | 1.957 ± 0.028 |
| 24 | 1.889 ± 0.018 | 1.916 ± 0.014 |