
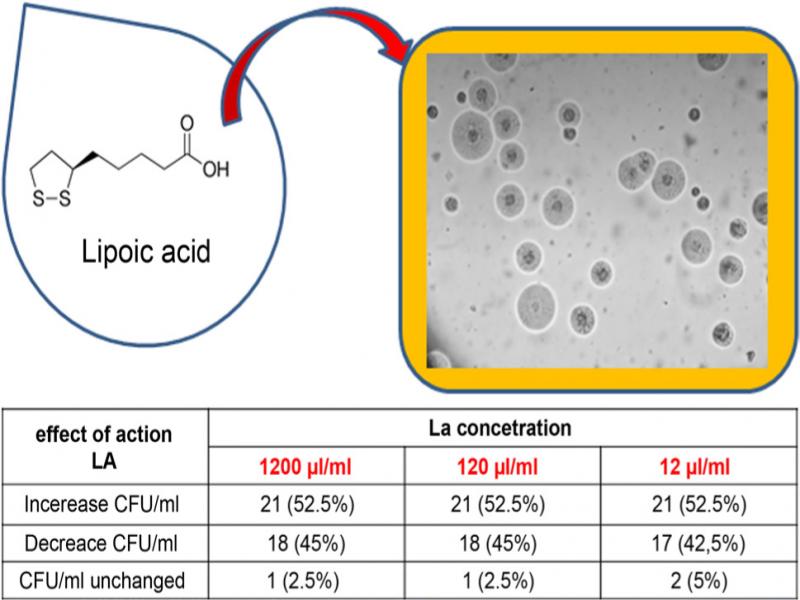
Fig. 1.
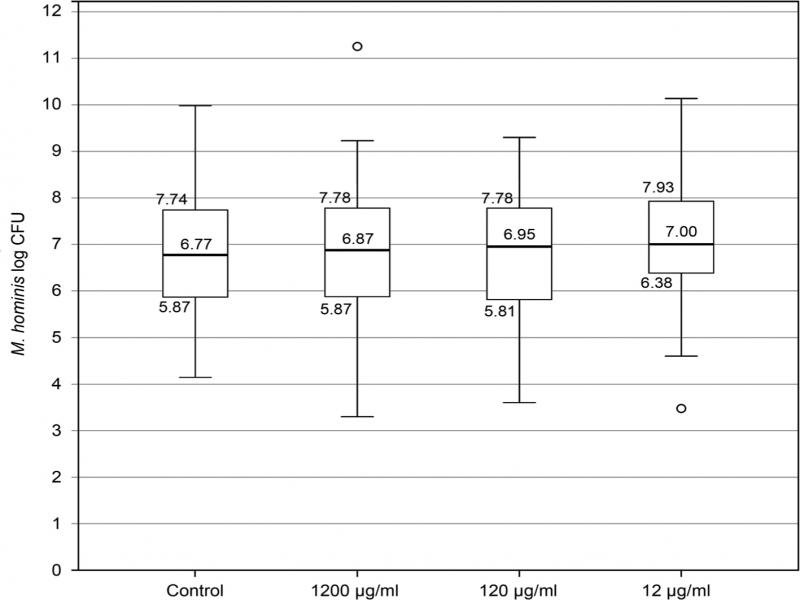
The graph shows the dependence of the log CFU Mycoplasma hominis on LA dose. Mean value, median value, and IQR value are given for each concentration of LA. There were no significant differences (p = 0.807) according to the Kruskal-Wallis test.
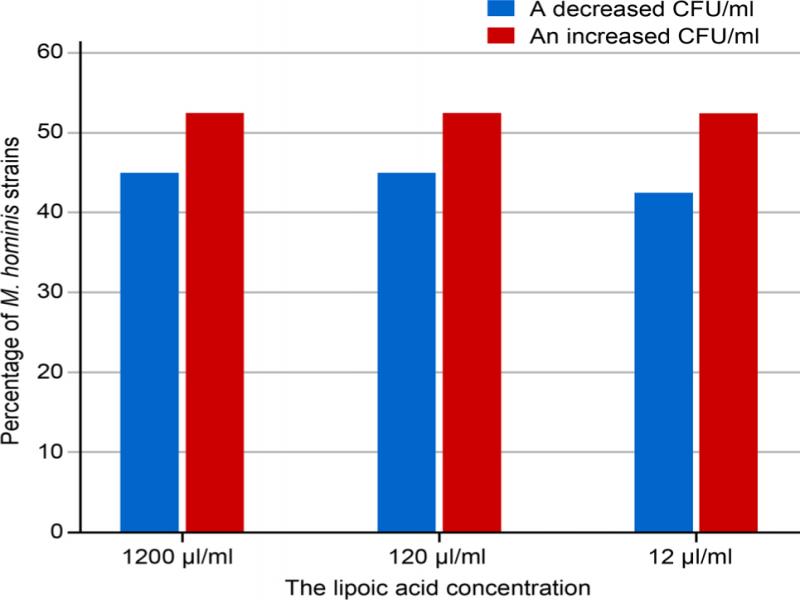
Fig. 2.
The graph shows the dependence of the bacterial CFU value on the LA dose. Data are presented as a percentage relative to all strains tested (100%).