
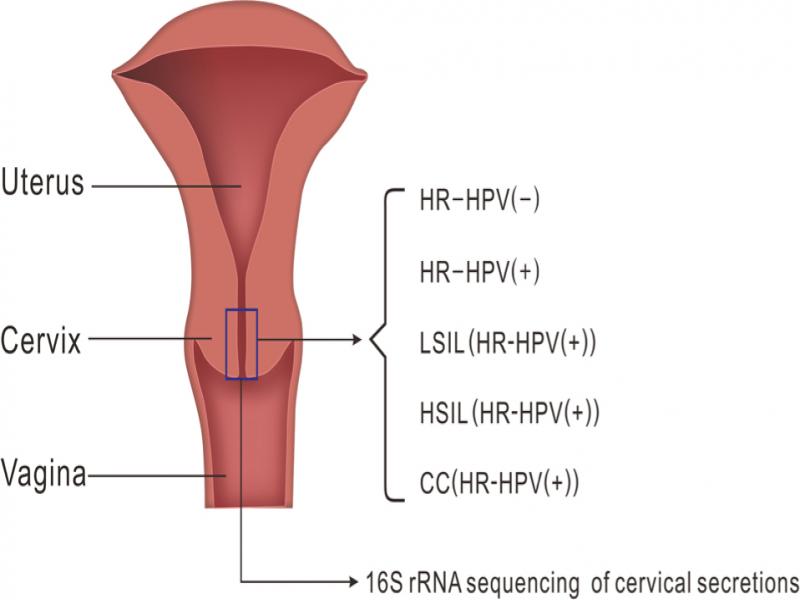
Table I
Analysis of essential information in each group.
| Group | Cases number | Age  | BMI  |
|---|---|---|---|
| Group 1 | 29 | 40.08 ± 4.83 | 23.20 ± 3.47 |
| Group 2 | 29 | 42.17 ± 5.18 | 22.00 ± 2.16 |
| Group 3 | 32 | 40.63 ± 4.55 | 22.32 ± 2.93 |
| Group 4 | 40 | 40.64 ± 5.57 | 22.37 ± 1.62 |
| Group 5 | 38 | 42.43 ± 5.31 | 22.88 ± 1.96 |
| K-W test (H) | 5.336 | 7.640 | |
| K-W test (P) | 0.255 | 0.106 |
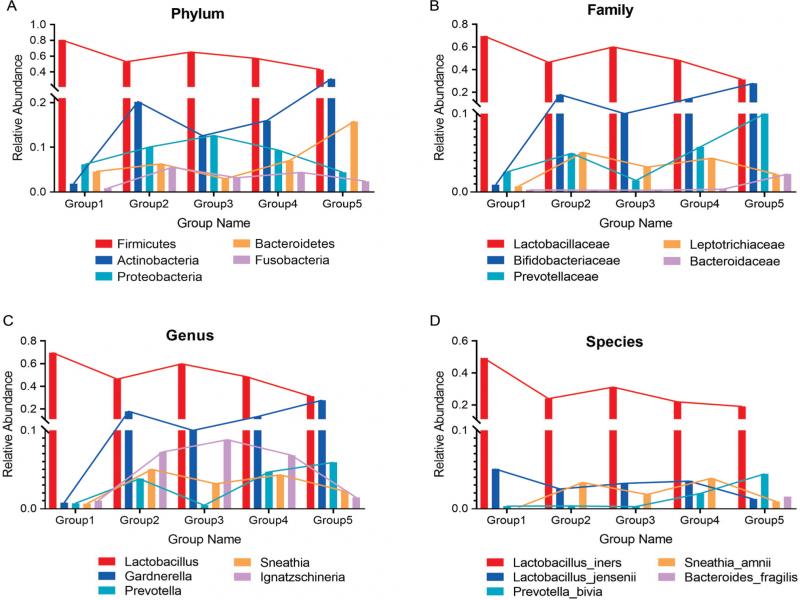
Fig. 1.
Microbiome communities of five groups.
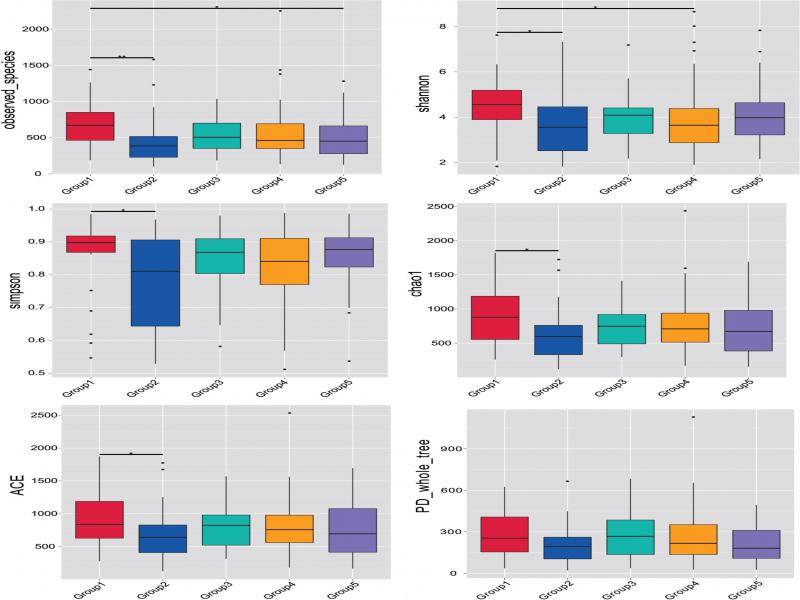
Fig. 2.
Alpha diversity index of cervical microflora between groups. Group 1 – healthy group; Group 2 – HR-HPV infection group; Group 3 – LSIL group; Group 4 – HSIL group; Group 5 – cervical cancer group.
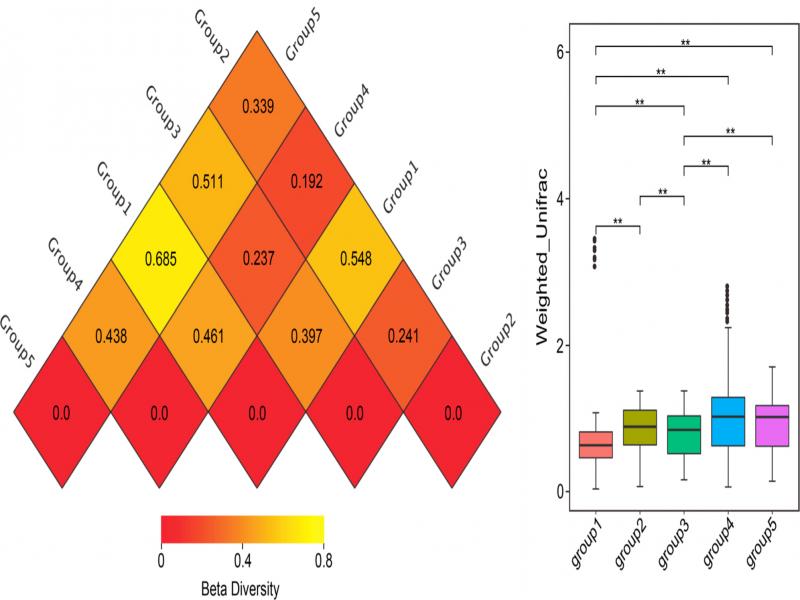
Fig. 3.
Beta diversity between five groups; A) beta diversity between groups; B) box plot based on weighted UniFrac beta diversity.
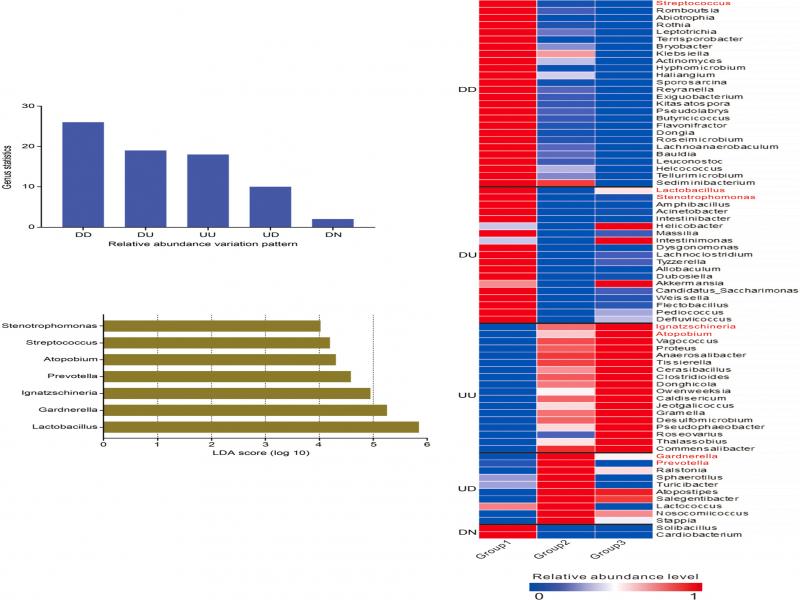
Fig. 4.
Abundance heatmap of different speciesat the genus level in phase 1.
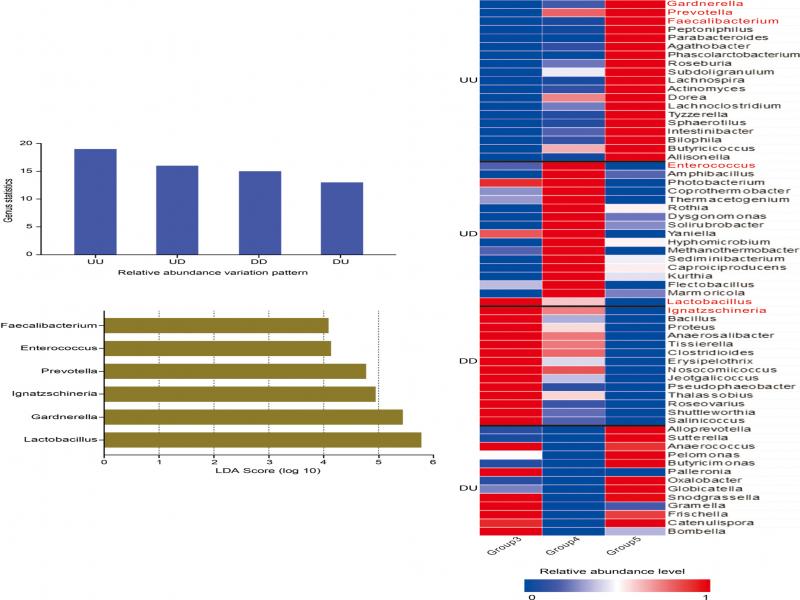
Fig. 5.
Abundance heatmap of different species at the genus level in phase 2.
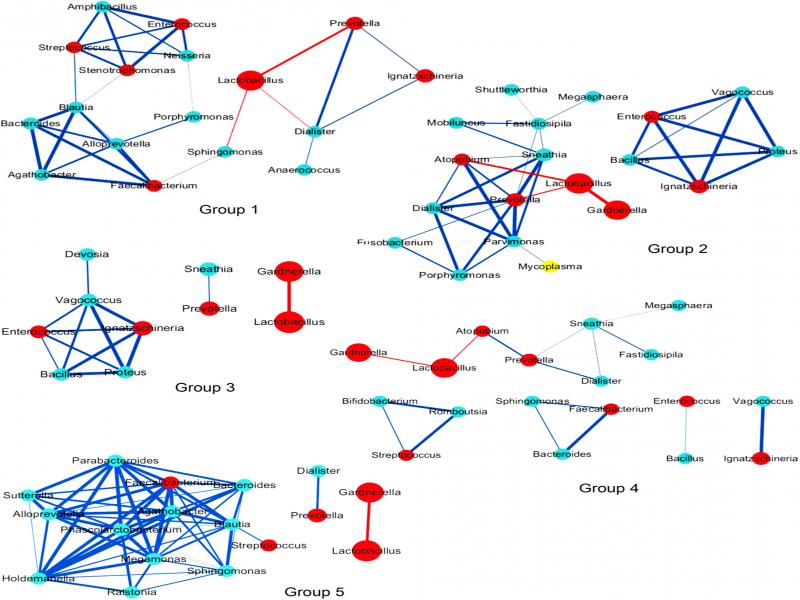
Fig. 6.
Co-occurrence network diagram.