
Fig. 1.
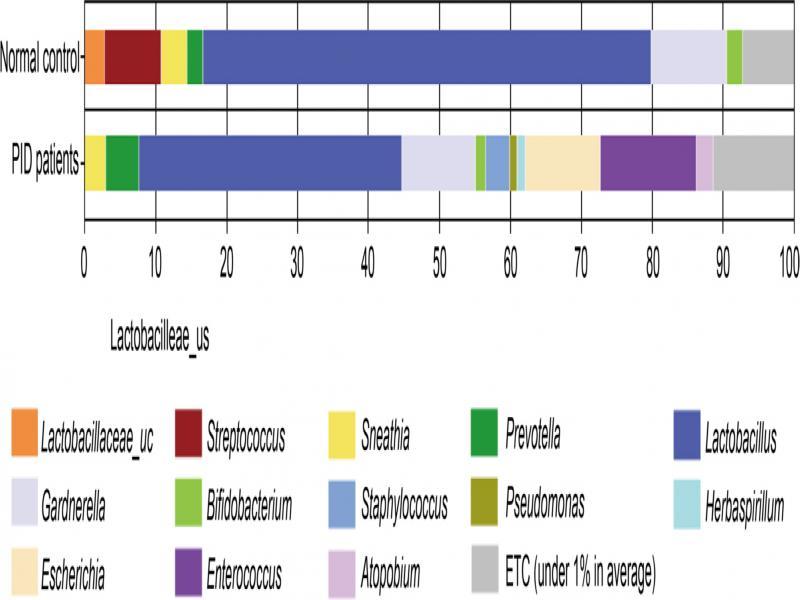
Fig. 2.
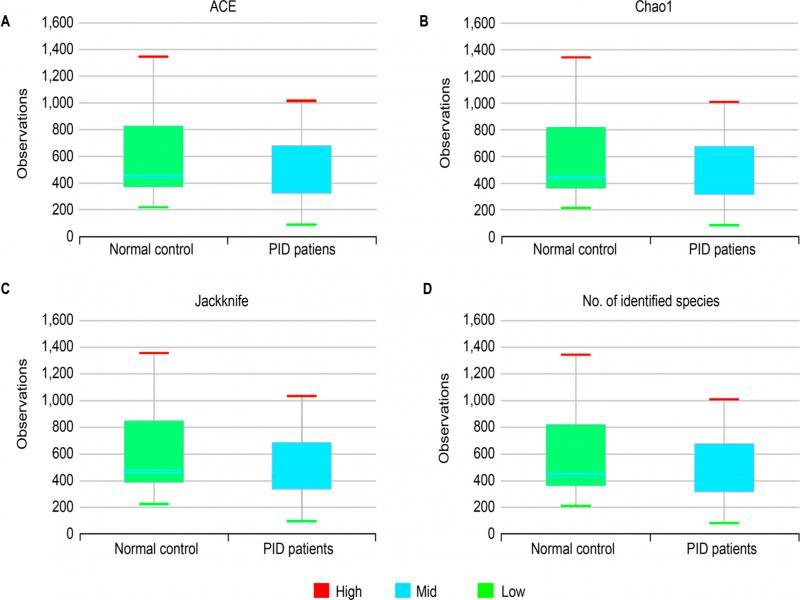
Fig. 3.
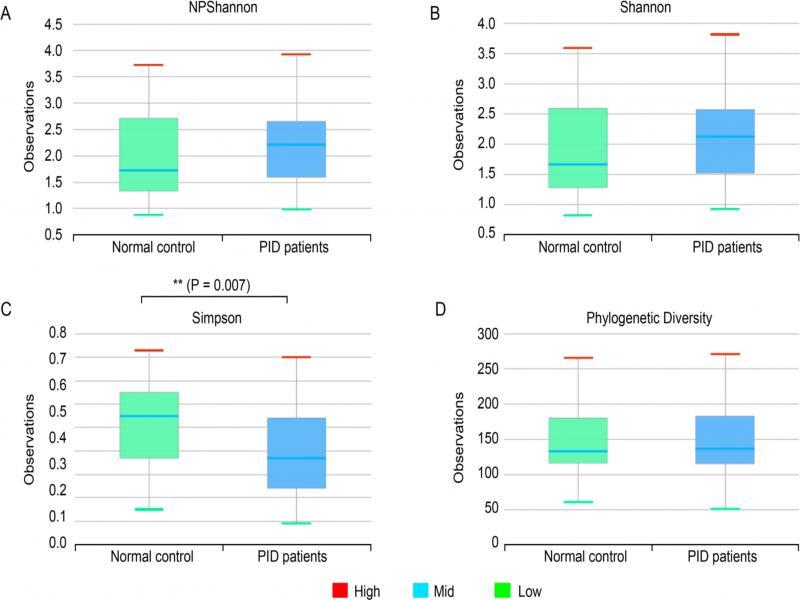
Fig. 4.
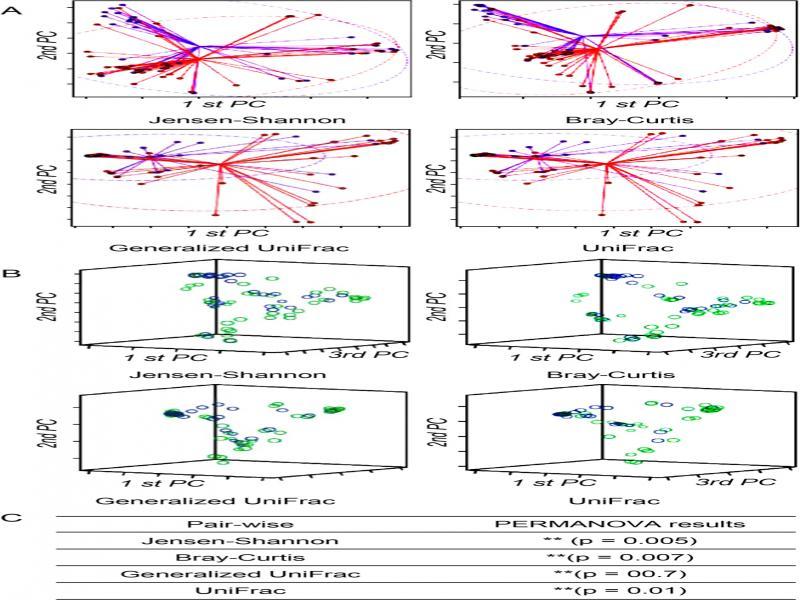
Fig. 5.
Fig. 6.
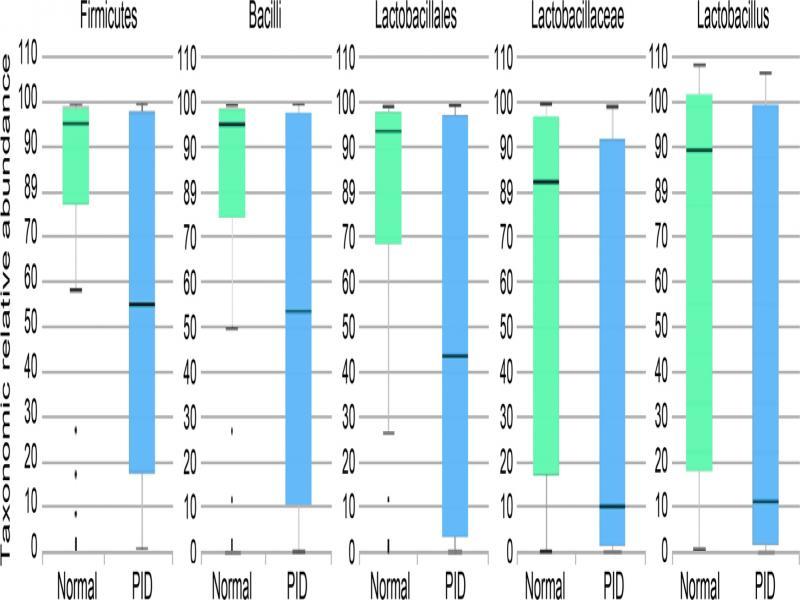
Fig. 7.
Distributions of bacterial community at different taxonomic levels (phylum, class, order, and family)_
| Phylum | Con. | PID | Class | Con. | PID | Order | Con. | PID | Family | Con. | PID |
|---|---|---|---|---|---|---|---|---|---|---|---|
| Lactobacillaceae | 63.7 | 35.8 | |||||||||
| Lactobacillales | 74.5 | 50.2 | Enterococcaceae | 8.1 | 13.4 | ||||||
| Firmicutes | 79.4 | 56.9 | Bacilli | 77.7 | 53.7 | Streptococcaceae | 2.6 | 0 | |||
| Bacillales | 3.1 | 3.4 | Staphylococcaceae | 3.1 | 3.1 | ||||||
| Tissierellia | 1.0 | 1.5 | Tissierellales | 1.0 | 1.5 | Peptoniphilaceae | 1.0 | 1.5 | |||
| Actinobacteria | 13.0 | 23.2 | Actinobacteria | 10.7 | 16.7 | Bifidobacteriales | 9.8 | 15.8 | Bifidobacteriaceae | 9.8 | 15.8 |
| Coriobacteriia | 2.3 | 6.6 | Coriobacteriales | 2.3 | 6.6 | Coriobacteriaceae | 2.3 | 6.6 | |||
| Gammaproteobacteria | 4.1 | 11.0 | Pseudomonadales | 2.7 | 1.5 | Moraxellaceae | 2.4 | 0 | |||
| Proteobacteria | 4.6 | 12.8 | Enterobacterales | 1.4 | 9.4 | Enterobacteriaceae | 0 | 9.2 | |||
| Betaproteobacteria | 0 | 1.6 | Burkholderiales | 0 | 1.6 | Oxalobacteraceae | 0 | 1.3 | |||
| Bacteroidetes | 1.4 | 4.7 | Bacteroidia | 1.3 | 4.6 | Bacteroidales | 1.3 | 4.6 | Prevotellaceae | 1.2 | 3.7 |
| Fusobacteria | 1.2 | 2.4 | Fusobacteria | 1.2 | 2.4 | Fusobacteriales | 1.2 | 2.4 | Leptotrichiaceae | 1.2 | 2.2 |
Identification of microbes using STD multiplex PCR and culture method for PID patients_
| No. | STD PCR method | Culture method | |||||||
|---|---|---|---|---|---|---|---|---|---|
| MH | UP | UU | GV | CT | NG | TV | CA | ||
| 1 | + | – | – | + | – | – | – | – | – |
| 2 | + | + | – | + | + | – | – | – | – |
| 3 | – | – | + | + | – | – | – | – | – |
| 4 | – | + | – | + | – | – | – | – | – |
| 5 | – | – | + | + | – | – | – | – | – |
| 6 | – | + | – | + | – | – | – | – | – |
| 7 | – | – | + | + | – | – | – | – | – |
| 8 | + | + | – | + | + | + | – | – | – |
| 9 | – | – | – | + | + | – | + | – | – |
| 10 | – | – | + | + | – | – | – | – | – |
| 11 | + | + | – | + | + | – | – | – | – |
| 12 | + | – | + | + | – | – | – | – | Staphylococcus aureus |
| 13 | – | – | – | – | – | – | – | – | Streptococcus pyogens |
| 14 | – | – | – | – | – | – | – | + | – |
| 15 | + | + | – | + | – | – | – | – | Pseudomonas koreensis |
| 16 | + | – | + | + | + | – | – | – | – |
| 17 | – | – | – | + | – | – | – | – | – |
| 18 | – | – | – | – | – | – | – | – | – |
| 19 | – | – | – | – | – | – | – | + | – |
| 20 | – | + | – | + | – | – | – | – | – |
| 21 | + | – | – | + | – | – | – | – | – |
| 22 | – | – | – | – | – | – | – | + | Candida albicans |
| 23 | – | – | – | + | – | – | – | – | Escherichia coli |
| 24 | – | – | + | + | – | – | – | – | – |
| 25 | – | + | – | + | + | – | – | – | – |
| 26 | – | – | – | + | – | – | – | – | – |
| 27 | – | – | – | + | – | – | – | – | – |
| 28 | – | – | – | – | – | – | – | + | Candida albicans |
| 29 | – | – | – | – | – | – | – | – | – |
| 30 | – | – | – | + | – | – | – | – | Pseudomonas putida |
| 31 | – | – | – | – | – | – | – | + | Candida albicans |
| 32 | – | – | + | + | – | – | – | – | – |
| 33 | + | + | – | + | – | – | – | – | – |
| 34 | – | – | – | + | – | – | – | – | Escherichia coli |
| 35 | – | – | + | + | – | – | – | – | – |
| 36 | – | – | – | + | – | – | – | – | – |
| 37 | – | – | – | + | – | – | – | – | – |
| 38 | – | – | – | + | – | – | – | – | – |
| 39 | – | + | – | + | – | – | – | – | – |
| 40 | – | – | – | + | – | – | – | – | – |
| 41 | – | – | + | + | – | – | – | – | – |
The Kruskal-Wallis H tests and LEfSe analysis of the associations between normal control women and PID patients_
| Taxon rank | Taxon name | p-value | LDA | Control | PID patients |
| Phylum | Firmicutes | 0.04364 | 5.09916 | 79.38 | 56.87 |
| Saccharibacteria_TM7 | 0.02254 | 3.25735 | 0.42 | 0.02 | |
| Class | Bacilli | 0.04089 | 5.12693 | 77.74 | 53.65 |
| Saccharimonas_c | 0.02254 | 3.21094 | 0.42 | 0.02 | |
| Lactobacillales | 0.04089 | 5.13602 | 74.52 | 50.17 | |
| Order | Saccharimonas_o | 0.02254 | 3.24345 | 0.42 | 0.02 |
| Propionibacteriales | 0.00628 | 2.90945 | 0.24 | 0.13 | |
| Lactobacillaceae | 0.01377 | 5.15948 | 63.70 | 35.76 | |
| Moraxellaceae | 0.04593 | 4.05126 | 2.40 | 0.68 | |
| Family | Pseudomonadaceae | 0.00272 | 3.56834 | 0.28 | 0.83 |
| Saccharimonas_f | 0.02254 | 3.23883 | 0.42 | 0.02 | |
| Propionibacteriaceae | 0.00628 | 2.91443 | 0.24 | 0.12 | |
| Yersiniaceae | 0.04997 | 2.84709 | 0.06 | 0.16 | |
| Lactobacillus | 0.02881 | 5.12933 | 61.03 | 34.92 | |
| Gardnerella | 0.02706 | 4.54975 | 8.36 | 13.89 | |
| Lactobacillaceae_uc | 0.00128 | 3.98329 | 2.67 | 0.84 | |
| Pseudomonas | 0.00272 | 3.54428 | 0.28 | 0.83 | |
| Parvimonas | 0.00445 | 3.31257 | 0.00 | 0.50 | |
| Genus | Enterobacteriaceae_uc | 0.01355 | 3.29397 | 0.15 | 0.50 |
| AF125206_g | 0.02254 | 3.25111 | 0.42 | 0.02 | |
| Megasphaera | 0.03362 | 3.04489 | 0.14 | 0.37 | |
| Yersinia | 0.04997 | 2.85166 | 0.06 | 0.16 | |
| Cutibacterium | 0.01311 | 2.85157 | 0.19 | 0.11 | |
| Actinotignum | 0.02287 | 2.50200 | 0.06 | 0.00 |
Clinical profiles of PID patients (n = 41) and women from control group (n = 33)_
| Group | Age (years) | Parity | Body mass index | Symptom | Number of women | % |
|---|---|---|---|---|---|---|
| PID patients | 35.5 ± 2.4 | 3.3 ± 0.2 | 29.5 ± 6.9 | Foul odor (Fish and rotten) | 25 | 61.0 |
| Itching and burning sensation | 11 | 26.8 | ||||
| Abnormal color of discharge | 5 | 12.2 | ||||
| Total | 41 | 100 | ||||
| Control group | 39.4 ± 3.2 | 3.1 ±0.2 | 30.1 ± 4.3 | No observable abnormality | 33 | 100 |
| Total | 33 | 100 |