
Table I
The plant species and the tissues from which the endophytic bacteria were isolated and enzymatic indexes (EIs) of hydrolytic enzymes of 16 strains selected for the 16S rRNA gene amplicon sequence analysis.
| Isolate No | Host Plant | Plant Tissue | Protease | Lipase | Amylase | Cellulase | Pectinase | Xylanase |
|---|---|---|---|---|---|---|---|---|
| G90Y2 | Aegilops sp. | Leaf | 3.46 ± 0.15efg | 9.80 ± 0.20a | 2.14 ± 0.03de | 6.10 ± 0.16cd | 1.73 ± 0.03c | – |
| G90S1 | Aegilops sp. | Stem | 2.94 ± 0.08gh1 | 6.79 ± 2.01bc | 3.23 ± 0.09bc | 5.02 ± 0.27de | – | – |
| G88K1 | Triticum aestivum L. | Root | 3.78 ± 0.06def | 1.90 ± 0.11e | – | – | – | 2.88 ± 0.38ns |
| G83S3 | Triticum aestivum L. | Stem | 2.85 ± 0.05h1 | 3.67 ± 0.15de | 3.91 ± 0.37ab | 4.40 ± 0.10e | 2.05 ± 0.05bc | – |
| G105Y1 | Dactylis glomerata L. | Leaf | 7.29 ± 0.71a | 1.87 ± 0.34e | 3.03 ± 0.29bcd | 12.75 ± 1.38a | 3.81 ± 0.38a | – |
| G105S1 | Dactylis spp. | Stem | – | – | – | – | – | – |
| G100Y1 | Festuca spp. | Leaf | 3.40 ± 0.12fgh | 6.96 ± 0.54b | 2.18 ± 0.08de | 7.02 ± 0.46c | – | – |
| G80K3 | Secale cereale L. | Root | 4.03 ± 0.17de | – | 3.05 ± 0.13bcd | – | 4.44 ± 0.90a | – |
| G70K2 | Secale cereale L. | Root | 2.73 ± 0.341 | 7.24 ± 0.78b | 2.69 ± 0.04cd | 4.07 ± 0.13ef | 2.34 ± 0.18bc | – |
| G42K2 | Cultivated Poaceae spp. | Root | 3.57 ± 0.20ef | 4.89 ± 0.22bcd | 2.68 ± 0.09cd | 2.66 ± 0.04f | 1.76 ± 0.14c | – |
| G119Y1T | Eremopoa sp. | Leaf | – | 4.37 ± 0.15cd | 1.29 ± 0.04e | 7.50 ± 0.00c | – | – |
| G118S2T | Eremopoa songarica L. | Stem | 4.22 ± 0.16cd | 4.46 ± 0.22cd | 1.69 ± 0.08de | 3.46 ± 0.19ef | – | 2.65 ± 0.41ns |
| G117Y1T | Eremopoa sp. | Leaf | 3.22 ± 0.13fgh1 | 6.32 ± 1.78bc | 2.81 ± 0.01cd | 2.46 ± 0.12f | – | 1.90 ± 0.27ns |
| G116K1T | Eremopoa songarica L. | Root | 4.68 ± 0.25bc | 1.91 ± 0.18e | – | – | – | – |
| G113Y3 | Triticum aestivum L. | Leaf | 5.12 ± 0.07b | 3.15 ± 0.13de | 4.70 ± 0.17a | 9.77 ± 0.42b | 3.48 ± 0.29ab | 1.75 ± 0.25ns |
| G107Y2 | Triticum aestivum L. | Leaf | 3.26 ± 0.09fgh1 | 7.33 ± 0.67b | 2.68 ± 0.27cd | 4.95 ± 0.30de | – | – |
Table II
Identification of strains according to the results of sequence analysis using the EzBioCloud database and GenBank accession numbers.
| Code of the isolates | Top-hit reference species | Top-hit reference strain | Similarity (%) | Coverage (%) | GenBank Accession Numbers |
|---|---|---|---|---|---|
| G119Y1T | Bacillus toyonensis | BCT-7112 | 100.00 | 70.10 | MW752891 |
| G118S2T | Pseudomonas congelans | DSM 14939 | 100.00 | 100.0 | MW752990 |
| G117Y1T | Streptococcus thermophilus | ATCC 19258 | 94.58 | 89.30 | MW774413 |
| G116K1T | Micrococcus luteus | NCTC 2665 | 99.58 | 100.00 | MW755305 |
| G113Y3 | Bacillus halotolerans | ATCC 25096 | 99.93 | 100.00 | MW753050 |
| G107Y2 | Curtobacterium flaccumfaciens | LMG 3645 | 100.00 | 100.00 | MW753051 |
| G105Y1 | Bacillus subtilis subsp. inaquosorum | KCTC 13429 | 99.92 | 84.50 | MW753052 |
| G105S1 | Bacillus idriensis | SMC 4352-2 | 99.58 | 100.00 | MW753132 |
| G100Y1 | Paenibacillus nuruki | TI45-13ar | 99.25 | 100.00 | MW753131 |
| G90Y2 | Paenibacillus tundrae | A10b | 99.84 | 83.30 | MW753134 |
| G90S1 | Curtobacterium flaccumfaciens | LMG 3645 | 100.00 | 100.00 | MW757038 |
| G88K1 | Pseudomonas orientalis | CFML 96-170 | 99.62 | 89.20 | MW753212 |
| G83S3 | Paenibacillus seodonensis | DCT19 | 99.23 | 88.00 | MW753225 |
| G80K3 | Paenibacillus xylanexedens | B22a | 99.80 | 100.00 | MW753226 |
| G70K2 | Paenibacillus xylanexedens | B22a | 99.80 | 100.00 | MW753223 |
| G42K2 | Chryseobacterium luteum | DSM 18605 | 99.44 | 100.00 | MW753224 |
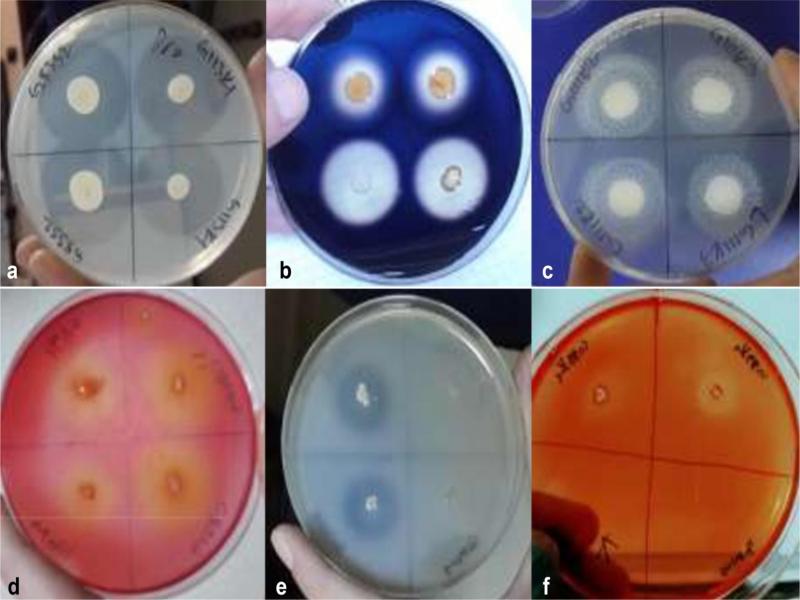
Fig. 1.
Petri dishes with colonies surrounded by zones of extracellular enzymatic activity; a) protease, b) amylase, c) lipase, d) cellulase, e) pectinase, f) xylanase.
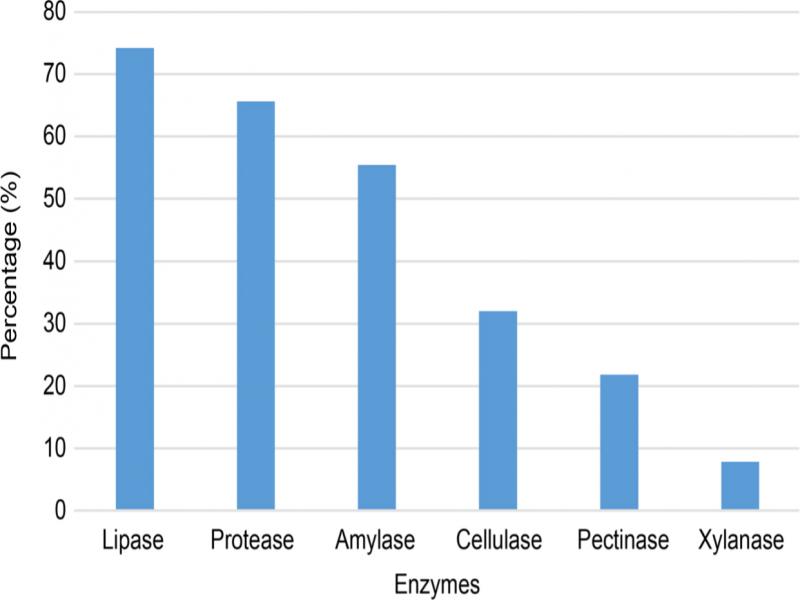
Fig. 2.
Relative frequency (%) of strains (from a total of 128) producing individual hydrolytic enzymes.
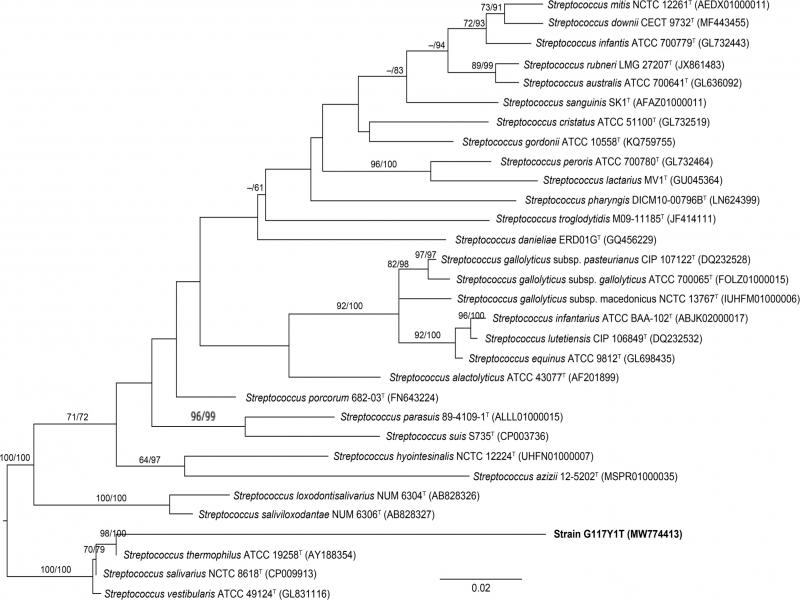
Fig. 3.
The phylogenetic tree constructed by the maximum likelihood method and rooted by midpoint-rooting. Branches are scaled in terms of the expected number of nucleotide substitutions per site. Numbers at nodes indicate the bootstrap support values larger than 60% from maximum likelihood (left) and maximum parsimony (right) bootstrapping. GenBank accession numbers are given in brackets.