
Table I
Nutritional components of two feed stuffs.
| DM (%) | GE (MJ/kg DM) | CP (% DM) | CF (% DM) | ADF (% DM) | NDF (% DM) | |
|---|---|---|---|---|---|---|
| LFHP | 89.4 | 16.3 | 16.1 | 2.4 | 25.2 | 46.2 |
| HFLP | 90.5 | 15.8 | 11.8 | 2.2 | 29.6 | 57.5 |
Table II
The diversity analysis of the rumen microbiota of twin lambs.
| Items | HFLP | LFHP | p-value |
|---|---|---|---|
| Shannon | 5.055 ± 0.1589 | 4.235 ± 0.181 | 0.014 |
| Simpsons | 0.019 ± 0.004 | 0.066 ± 0.041 | 0.116 |
| Observed species (Obs) | 992.000 ± 68.474 | 930.000 ± 18.037 | 0.154 |
| Ace | 1051.658 ± 64.182 | 992.341 ± 26.875 | 0.102 |
| Chao 1 | 1059.470 ± 67.920 | 1017.360 ± 29.399 | 0.165 |
1 The HFLP group was fed with ceratioids and the LFHP group of twin lambs was fed with alfalfa in the phylum of the rumen. Presented parameters are sample estimators of total species with sample identifications (Sample ID). While Obs, Ace, and richness (Chao 1) are used to describe the species number, Simpson and Shannon’s indices are used to indicate how diverse the rumen microbiota is.
Table III
The diversity analysis of duodenum microbiota of twin lambs.
| Items | HFLP | LFHP | p-value |
|---|---|---|---|
| Shannon | 7.855 ± 0.880 | 7.828 ± 0.838 | 0.964 |
| Simpsons | 0.985 ± 0.006 | 0.986 ± 0.005 | 0.391 |
| Observed species (Obs) | 966.750 ± 293.842 | 905.000 ± 247.818 | 0.781 |
| Chao 1 | 1278.063 ± 241.678 | 1223.815 ± 327.198 | 0.843 |
1 The HFLP group was fed with ceratoides, the LFHP group of twin lambs was fed with alfalfa in the phylum of the duodenum. Presented parameters are sample estimators of total species with sample identifications (Sample ID). While Obs and richness (Chao 1) are used to describe the species number, Simpsons and Shannon’s indices are used to indicate how diverse the duodenum microbiota is.
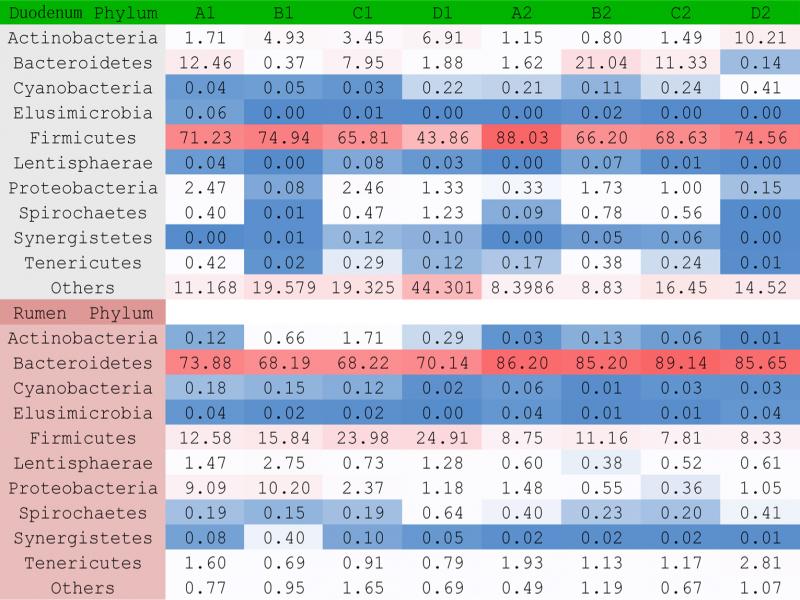
Fig. 1.
This figure shows a comparison between the phylum composition of the bacteria in the rumen and duodenum of twin lambs. The letters A1-D1 represent HFLP group, and A2-D2 represent LFHP group.
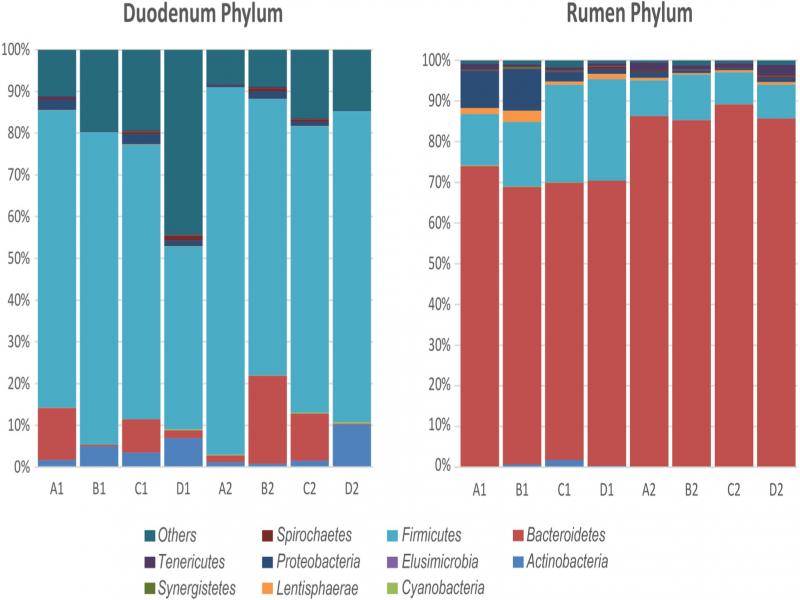
Fig. 2.
The phylum composition of rumen and duodenum of twin lambs. The letters A1-D1 represent the HFLP group, and the A2-D2 represent the LFHP group of phylum and duodenum, respectively.
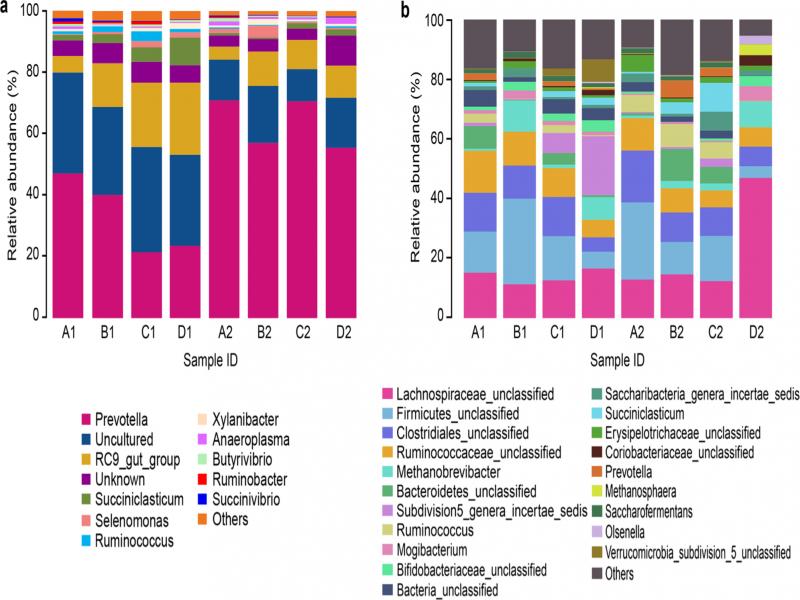
Fig. 3.
The genus community distribution of rumen and duodenum.
a) The genus community distribution of rumen. The letters A1-D1 represent the first group fed with HFLP and A2-D2 represents the second group of twin lambs fed with LFHP in the genus. b) The genus community distribution of duodenum. The letters A1-D1 represent the first group fed with HFLP and A2-D2 represents the second group of twin lambs fed with LFHP in the genus.
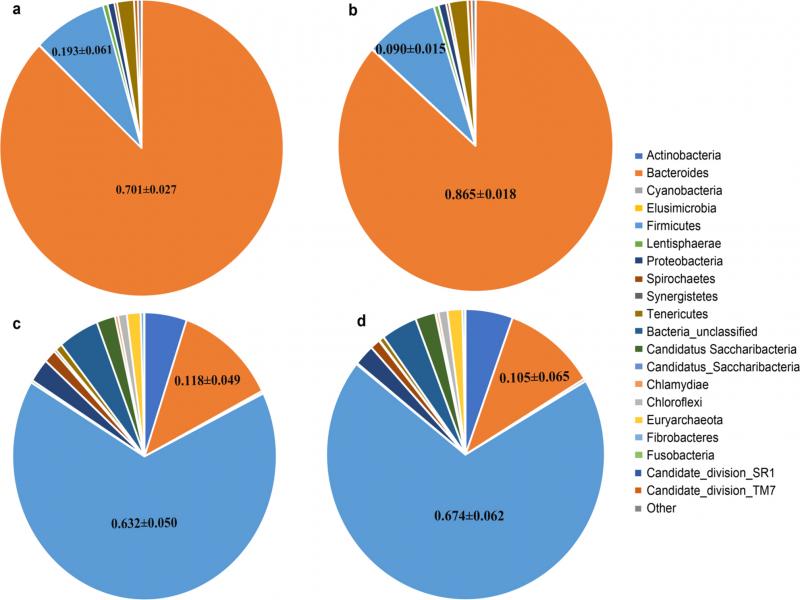
Fig. 4.
Comparison between HFLP and LFHP’s microbiota and their F:B ratio in the rumen and duodenum.
The letters a) and b) represent HFLP pellets and LFHP pellets, respectively, of the rumen. Enterotypes were strongly associated with feeds a) and b) which show LFHP pellets (Bacteroidetes) against HFLP pellets (Firmicutes). LFHP pellets displayed a substantial increase in Bacteroidetes and a reduction in Firmicutes. The letters c) and d) represent HFLP and LFHP pellets, respectively, of the duodenum. Enterotypes were strongly associated with feeds c) and d) which show LFHP pellets (Bacteroidetes) against HFLP pellets (Firmicutes). HFLP pellets displayed an increase in Firmicutes and a reduction in Bacteroidetes.
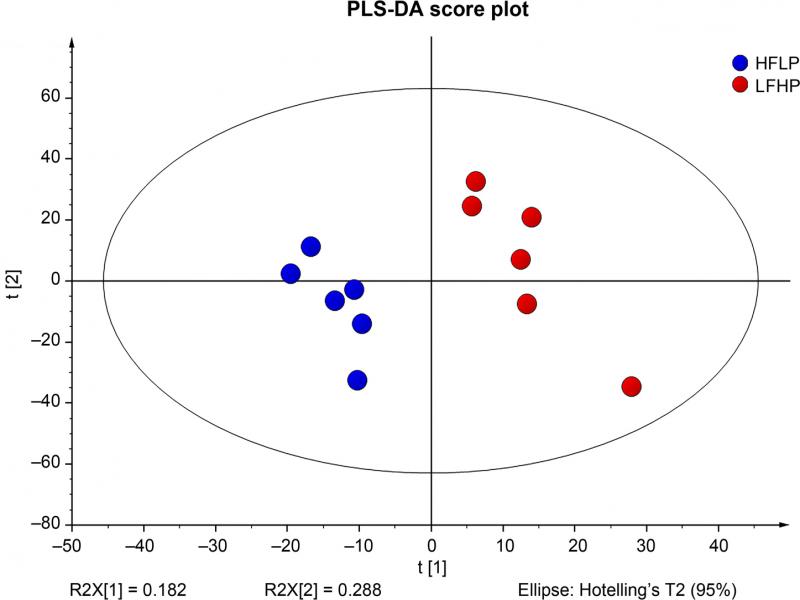
Fig. 5.
PLS-DA score plot came from liquid chromatography combined with mass spectrometry (LC/MS) spectra for the HFLP group (blue dots) and the LFHP group (red dots).
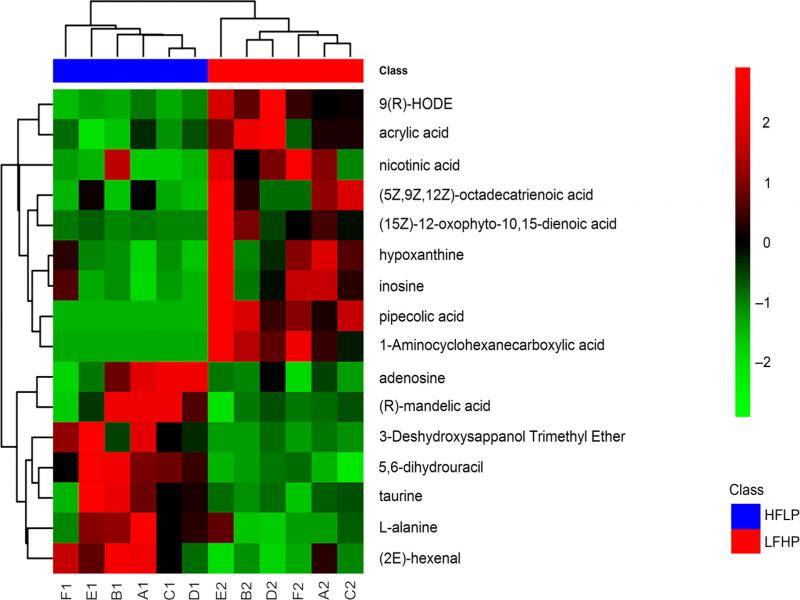
Fig. 6.
Heat map built by the 407 significantly different metabolites (p-value ≤ 0.05) in the HFLP and LFHP groups. The red color represents the LFHP group, and the blue represents the HFLP group.
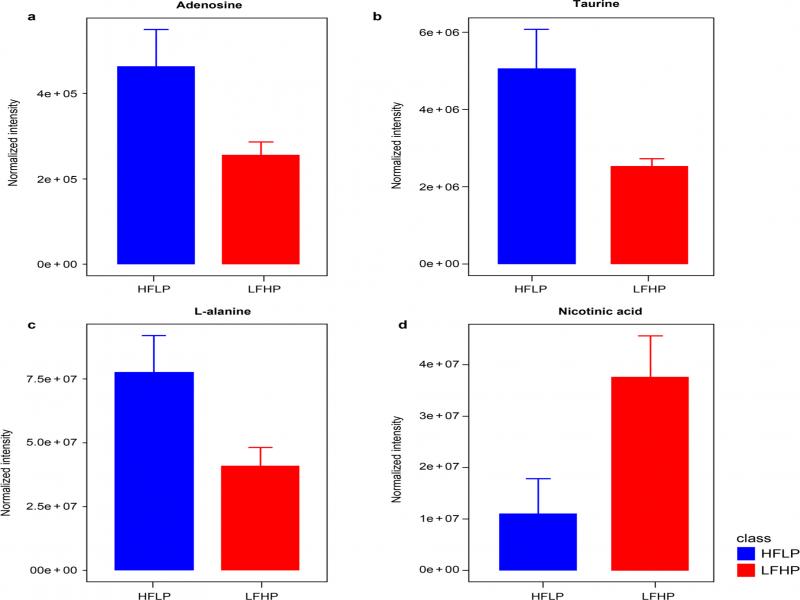
Fig. 7.
The relationship between the two feed (LFHP and HFLP) groups and the metabolites.
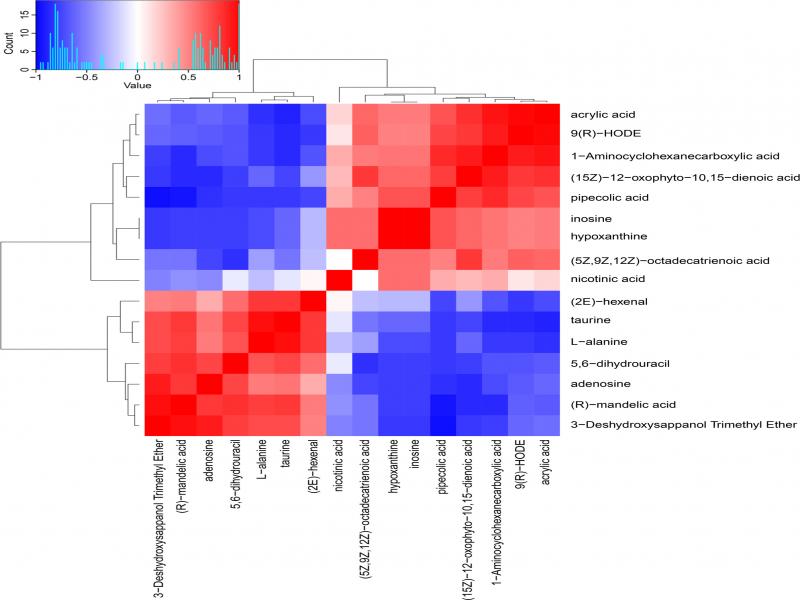
Fig. 8.
Metabolites correlation heat map. The rows and columns in the figure represent different metabolites, and different colors represent different correlations. The red color represents a positive correlation, and the blue represents a negative correlation among the metabolites. The deeper the color in the heat map, the better the metabolism.
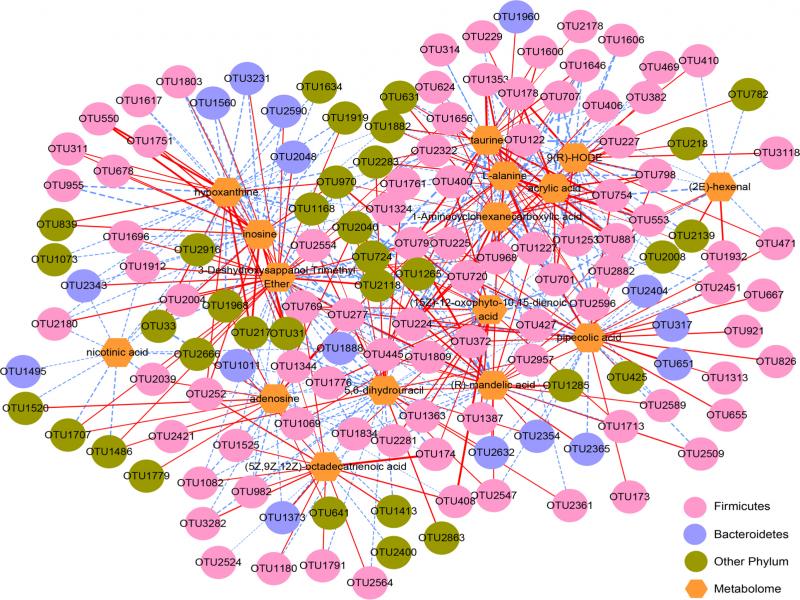
Fig. 9.
This figure shows the relationship between OTUs, metabolites, and the microbiota. The nodes represent different OTUs related to bacteria, which belong to Firmicutes, Bacteriodetes, and other phyla. The orange diamonds indicate 16 metabolites detected. The lines indicate the correlations between the OTUs, bacteria, and metabolites. The solid red connecting lines show a positive correlation, and the blue connecting dot line indicates a negative correlation between the OTUs, bacteria, and metabolites. The line thickness shows how strong the correlation was.