
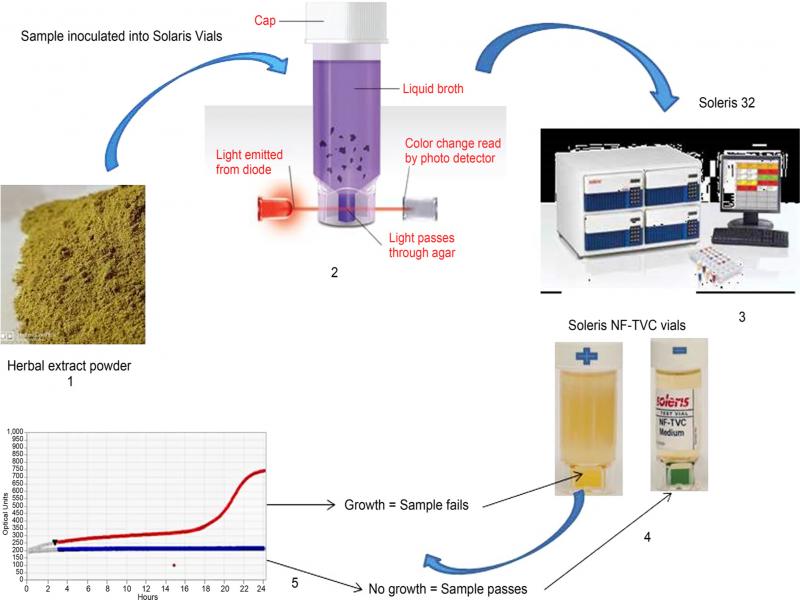
Fig. 1.
Schematic representation of the Soleris® system. In Step 1, an aliquot (10 g) of the herbal extract powder is weighed in a sterile container and re-suspended in 90 ml of sterile peptone water. The solution was mixed by vigorous vortexing for 2 min and further dilutions up to 10–3 were prepared by adding 1 ml of the diluted solution to 9 ml of sterile peptone and 1 ml of the dilutions were placed in the Soleris® vials in a laminar biosafety hood under sterile conditions (Step 2). In Step 3, the inoculated vials are placed in the selected drawer location in Soleris® instrument and the vials incubated at an appropriate temperature based on type of assay chosen (TVC, yeast and molds or coliforms). As organisms grow in the broth medium, the carbon dioxide (CO2) produced diffuses through a membrane layer into a soft agar plug containing a dye indicator and the change in the color of the dye is read by the Soleris® instrument (Step 4). A detection curve is generated in real time (Step 5) and the Soleris® software indicates a positive test result in less than 24 h for a sample with microbial contamination and samples producing no detection curve within 24 h are considered negative at the test threshold selected.
Table I
Soleris® results for total aerobic microbial count.
| S.N. | Sample ID | Dilutions inoculated | Growth/No growth | Detection time (h) |
|---|---|---|---|---|
| 1 | SR011903 | 103 105 | Growth Growth | 2.7 4.8 |
| 2 | RDP/SR/070/SS01 | 102 103 | Growth No growth | 11.4 ND |
| 3 | RDP/SR/070/ES02 | 102 103 | Growth Growth | 12.2 11.9 |
| 4 | RDP/SR/070/GR03 | 102 103 | Growth Growth | 15.1 19.9 |
| 5 | RDP/SR/068 | 102 103 | Growth Growth | 10.6 12.3 |
| 6 | RDP/SR/134 | 103 105 | No growth No growth | No detection No detection |
| 7 | RDP/SR/136 | 102 103 | Growth No growth | 13.1 No detection |
1 SR011903 is the Salacia extract batch that served as a control. RDP/SR/070/SS01, RDP/SR/070/ES02, and RDP/SR/070/GR03 refer to SR11903 treated after sterilization using steam, ETO, and Gamma irradiation respectively. RDP/SR/068 refers to batch of Salacia reticulata is the material treated with the anti-fungal agent that did not show any effect on the bacterial content. RDP/SR/134 and RDP/SR/136 denotes the batch taken after treatment with an anti-bacterial agent and a commercial extract of S. reticulata procured from a local Indian vendor.
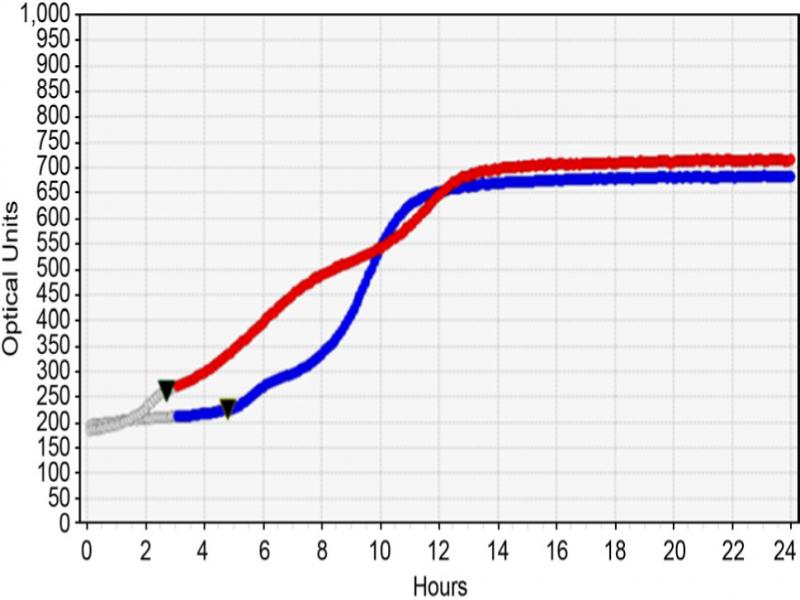
Fig. 2. a)
Microbial growth curve in Soleris® NF-TVC vials of various dilutions. Red curve denotes growth with sample SR011903 of10–3 dilution while blue curve denotes 10–5 dilution of the sample. Microbial detection was seen in both the dilutions.
Table II
Comparison of a total aerobic count between Soleris® (NF-TVC) and the conventional method (Salacinol content).
| S.N. | Sample ID | Total aerobic count by Soleris® (CFU/g)* | Total aerobic count by plating in Soleris® medium (CFU/g)** | Conventional plating method*** | RLOD# | Salacinol content (%) |
|---|---|---|---|---|---|---|
| 1 | SR011903 (Control) | > 100,000 | 109,000 | > 105 | 1.09 | 0.52 |
| 2 | RDP/SR/070/SS01 (Steam sterilized SR011903) | < 1,000 | 490 | 350 | 1.40 | ND |
| 3 | RDP/SR/070/ES02 (ETO treated SR011903) | > 1,000 | 1,100 | 2,700 | 0.41 | ND |
| 4 | RDP/SR/070/GR03 (Gamma irradiated SR011903) | < 1,000 | 280 | 890 | 0.31 | ND |
| 5 | RDP/SR/068 (anti-fungal agent treated SR011903) | > 1,000 | 1,600 | 1,500 | 1.06 | 0.506 |
| 6 | RDP/SR/134 (anti-bacterial agent treated SR011903) | > 10 | 10 | 20 | 0.50 | 0.48 |
| 7 | RDP/SR/136 (commercial Salacia extract) | > 1,000 | 1,500 | 2,300 | 0.65 | 0.059 |
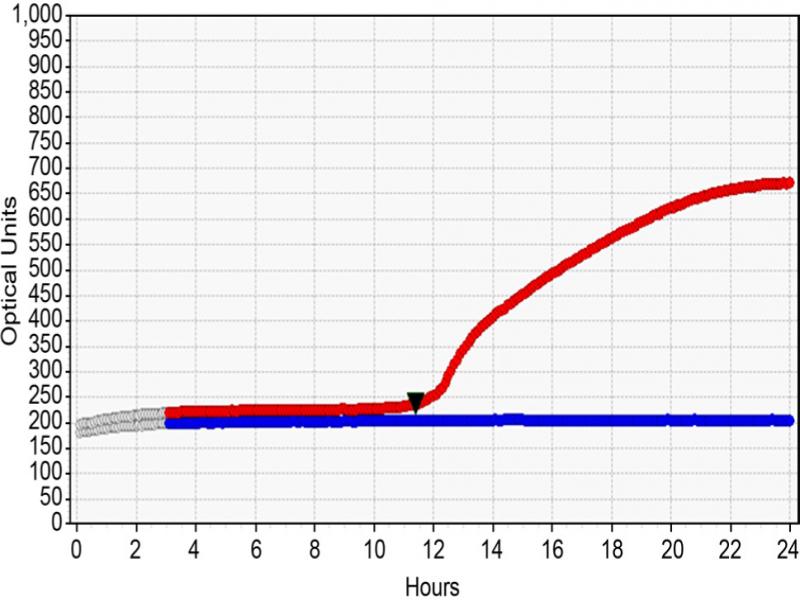
Fig. 2. b)
Sample RDP/SR/070/SS01 showed positive results for NF-TVC in Soleris® at 10–2 dilution (red curve) while the blue curve denotes 10–3 dilution.
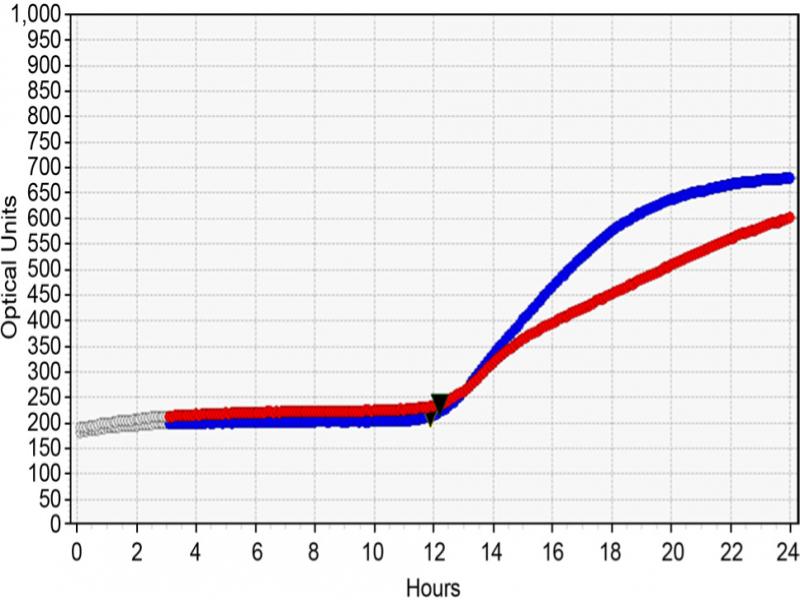
Fig. 2. c)
Sample RDP/SR/070/ES02 showed detection of microbes in all the dilutions in Soleris® NF-TVC vials. Blue curve denotes 10–3 dilution while the 10–2 dilution is represented by the red curve.
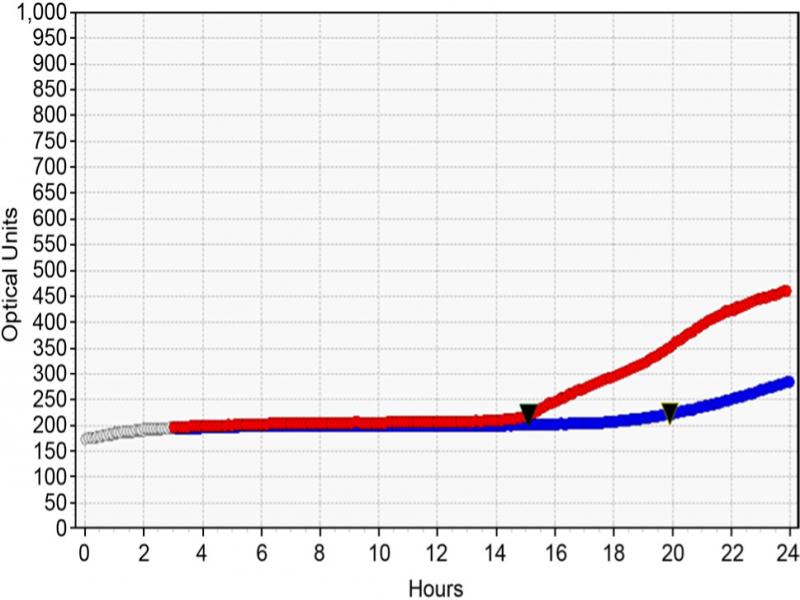
Fig. 2. d)
Sample RDP/SR/070/GR03 showed detection in all the dilutions in Soleris® NF TVC vials. Blue curve denotes 10–3 dilution while the red curve denotes 10–2 dilution.
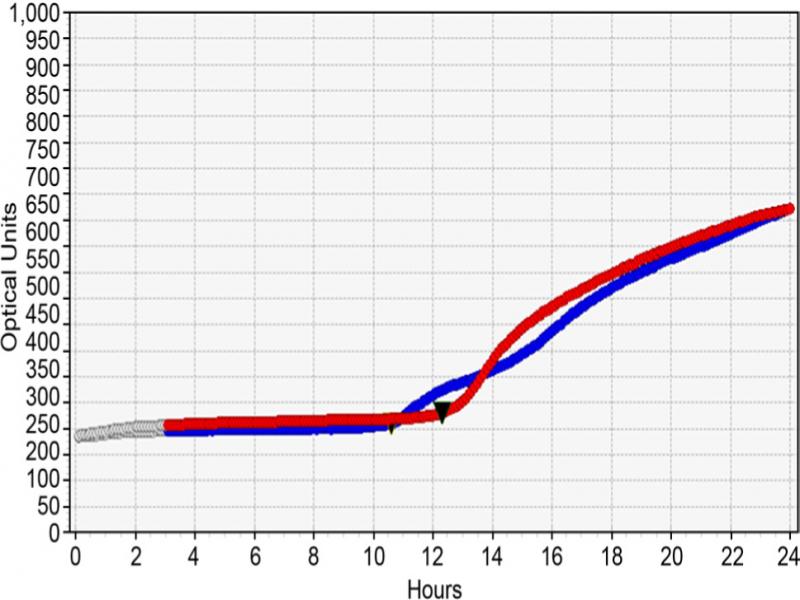
Fig. 2. e)
Sample RDP/SR/068 showed detection in all the dilutions in Soleris® NF-TVC vials. Red curve denotes 10–3 dilution while the blue curve shows growth with 10–2 dilution of the sample.
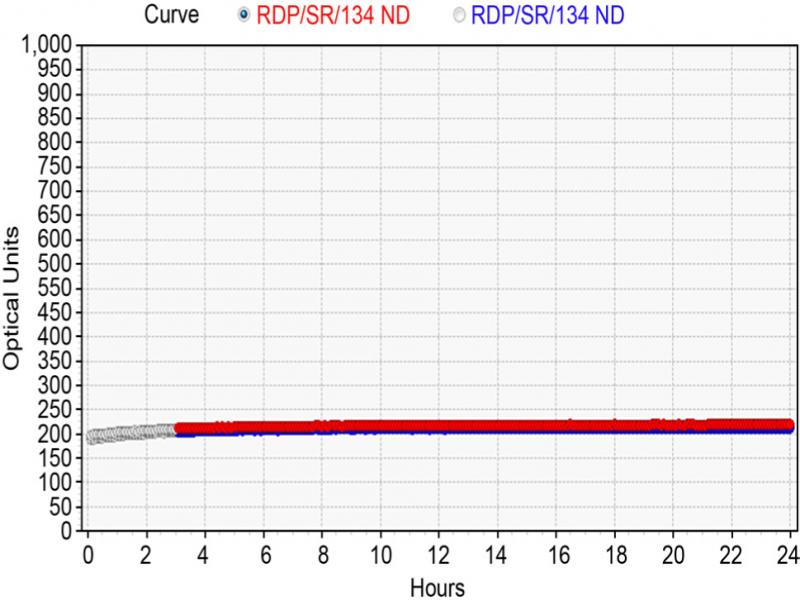
Fig. 2. f)
RDP/SR/134 sample showed no bacterial growth in any of the dilutions (10–3 and 10–5) tested. This is represented by blue and black flat lines respectively.
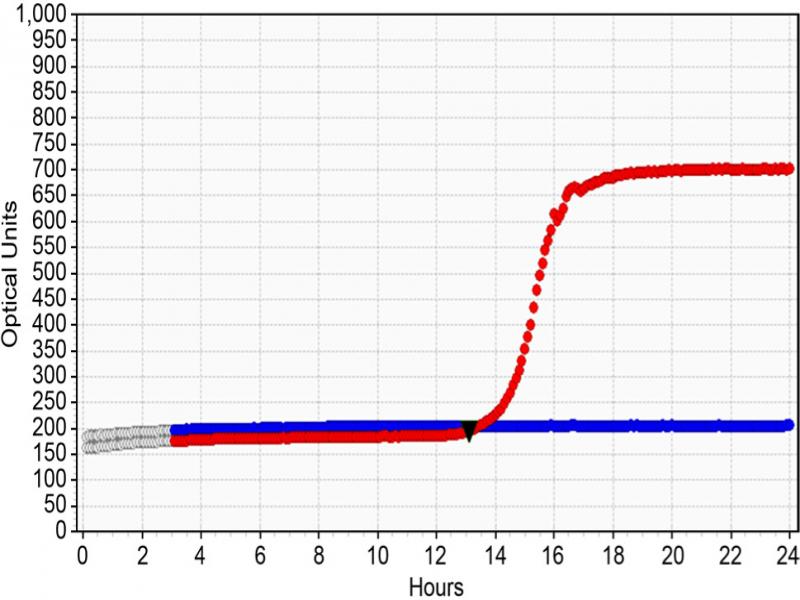
Fig. 2. g)
RDP/SR/136 sample showed microbial detection only in 10–3 dilution in NF-TVC Soleris® vials denoted by the red curve. The blue flat line denotes no growth seen with 10–5 dilution of this sample.
Table III
Soleris® results for the total yeast and mold counts.
| S.N. | Sample ID | Dilutions inoculated | Growth/No growth | Detection time (h) |
|---|---|---|---|---|
| 1 | SR011903 | 101 | Growth | 34.4 |
| 102 | No Growth | – | ||
| 103 | No Growth | – | ||
| 2 | RDP/SR/070/SS01 (Steam sterilized SR011903) | 101 | No Growth | – |
| 102 | No Growth | – | ||
| 103 | No Growth | – | ||
| 3 | RDP/SR/070/ES02 (ETO treated SR011903) | 101 | No Growth | – |
| 102 | No Growth | – | ||
| 103 | No Growth | – | ||
| 4 | RDP/SR/070/GR03 (Gamma irradiated SR011903) | 101 | No Growth | – |
| 102 | No Growth | – | ||
| 103 | No Growth | – | ||
| 5 | RDP/SR/068 (anti-fungal agent treated SR011903) | 101 | No Growth | – |
| 102 | No Growth | – | ||
| 103 | No Growth | – | ||
| 6 | RDP/SR/134 (anti-bacterial agent treated SR011903) | 101 | No Growth | – |
| 102 | No Growth | – | ||
| 103 | No Growth | – | ||
| 7 | RDP/SR/136 (commercial Salacia extract) | 101 | Growth | 26.2 |
| 102 | No growth | – | ||
| 103 | No growth | – |
Table IV
Comparison between Soleris® (DYM-109) and the conventional method for the total yeasts and molds.
| S.N. | Sample ID | Soleris® (CFU/g) | Conventional method (CFU/g) | Acceptable/Not acceptable |
|---|---|---|---|---|
| 1 | SR011903 | > 10 | 380 | Not acceptable |
| 2 | RDP/SR/070/SS01 | < 10 | < 10 | Acceptable |
| 3 | RDP/SR/070/ES02 | < 10 | < 10 | Acceptable |
| 4 | RDP/SR/070/GR03 | < 10 | < 10 | Acceptable |
| 5 | RDP/SR/068 | < 10 | < 10 | Acceptable |
| 6 | RDP/SR/134 | < 10 | < 10 | Acceptable |
| 7 | RDP/SR/136 | > 10 | 290 | Not acceptable |
1 SR011903 is the Salacia extract batch that served as a control. RDP/SR/070/SS01, RDP/SR/070/ES02 and RDP/SR/070/GR03 refer to SR11903 treated after sterilization using steam, ETO and gamma irradiation respectively. RDP/SR/068 refers to batch of Salacia reticulata is the material treated with the anti-fungal agent which did not show any effect on the bacterial content, RDP/SR/134 and RDP/SR/136 denote the batch taken after treatment with an antibacterial agent and a commercial batch of S. reticulata procured from a local market.
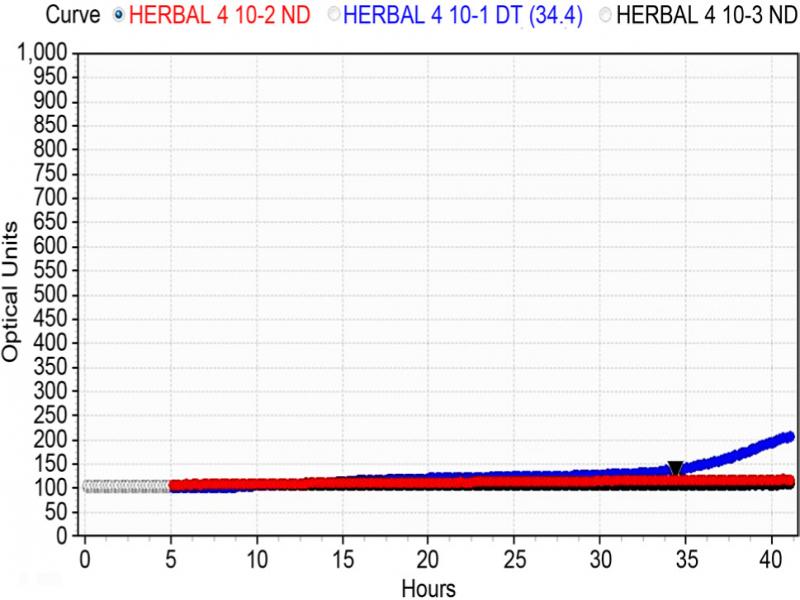
Fig. 3. a)
Sample SR011903 showed microbial detection in 10–1 dilution in Soleris® DYM 109-C vials represented by blue curve. Black curve denotes 10–3 dilution while the red curve denotes 10–2 dilution, both of which did not show any growth.
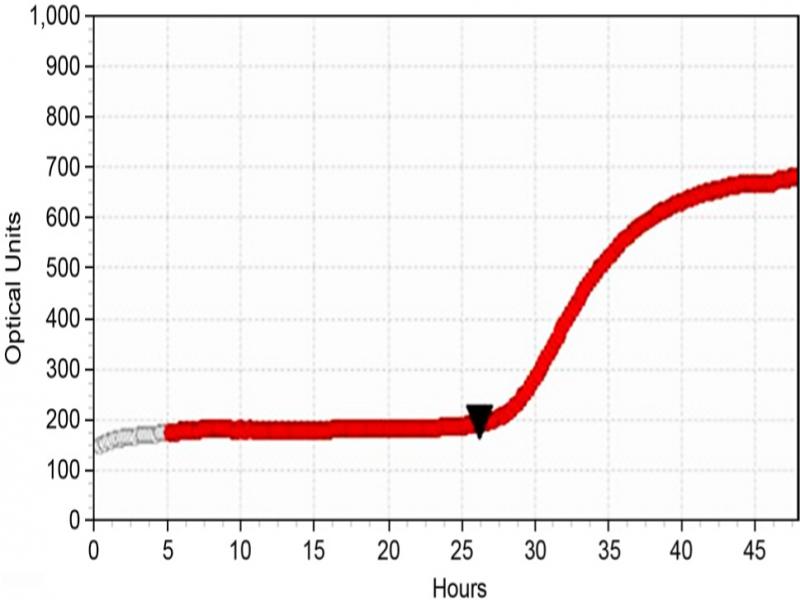
Fig. 3. b)
Sample RDP/SR/136 showed microbial detection in 10–1 dilution for DYM 109-C Soleris® vials represented by the red curve.