
Table I
Treatment of biofilms with sanitation agents.
| Agent (Concentration) | Temperature – Time | References |
|---|---|---|
| AP (0.16 U/g) | 37°C - 60 min | Parkar et al. 2004 |
| Protease 0.16 U/g) | 37°C - 60 min | Parkar et al. 2004 |
| Subtilisin (1%) | 37°C - 30 min | Parkar et al. 2004 |
| Trypsin (3%) | 37°C - 3 h | Parkar et al. 2003 |
| SDS (3%) | 100°C - 10 min | Parkar et al. 2003 |
| a-Amylase (1%) | 37°C - 30 min | Parkar et al. 2004 |
| Cellulase (1.66%) | 37°C - 30 min | Parkar et al. 2004 |
| SM (100 mM) | 22°C - 60 min | Parkar et al. 2003 |
| Lysozyme (2%) | 37°C - 60 min | Parkar et al. 2003 |
| TCA (10%) | 100°C - 15 min | Parkar et al. 2003 |
| Nisin (2 mg/ml) | 37°C - 24 h | Parkar et al. 2003 |
| PM (2 mg/ml) | 22°C - 30 min | Parkar et al. 2003 |
| ST (10 mg/ml) | 22°C - 5 min | Parkar et al. 2003 |
| 2(5H)-Furanone (1 mg/ml) | 22°C - 60 min | Ponnusamy et al. 2010 |
| Triclosan (2 mg/ml) | 22°C - 60 min | Tabak et al. 2007 |
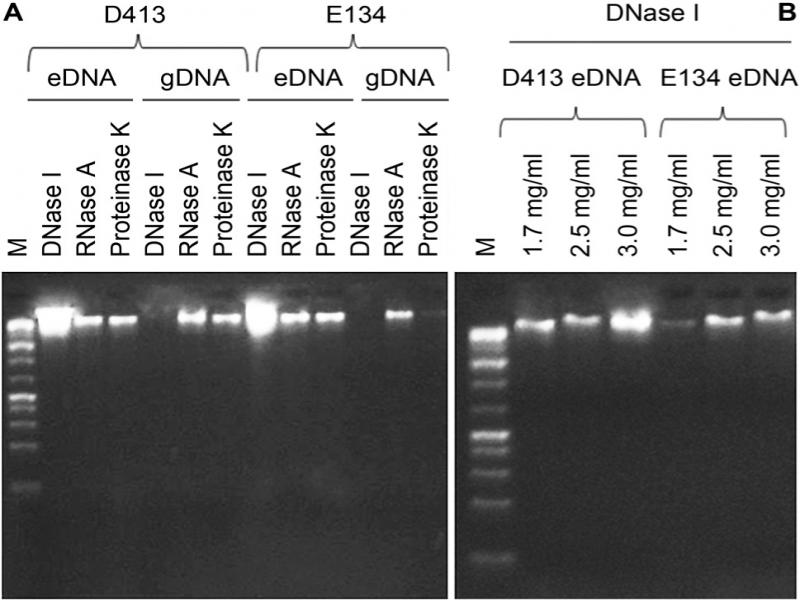
Fig. 1.
Agarose gel electrophoresis photographs displaying differences between the gDNA and eDNA of D413 and E134. M, Marker (Fermentas Gene Ruler 1 kb Plus DNA Ladder, 75–20.000 bp) (A) DNase I (1.45 mg/ml), RNase A (0.90 mg/ml) and proteinase K (0.85 mg/ml) treatment of both the gDNA and eDNA; (B) Different DNase I concentrations on eDNA (1.7, 2.5 and 3.0 mg/ml).
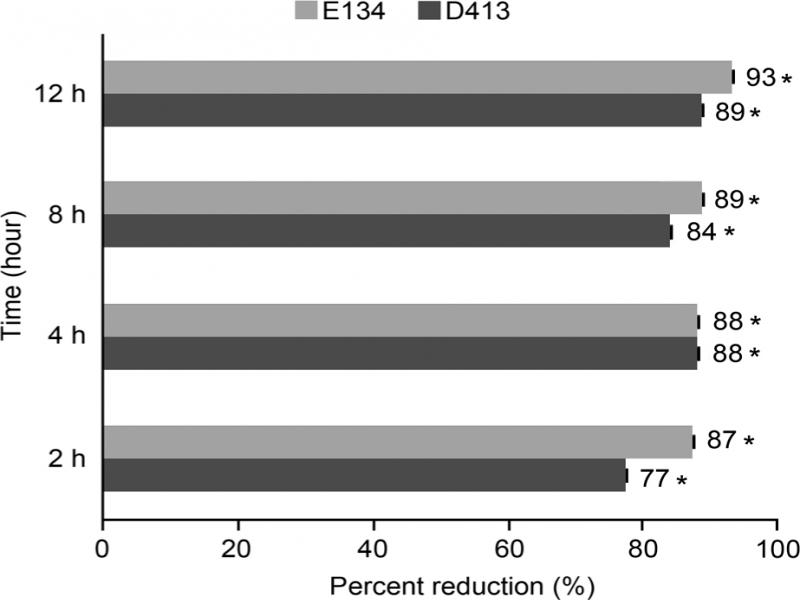
Fig. 2.
Treatment of mature biofilms with DNase I. P < 0.05* for comparisons of data obtained in the absence and in the presence of DNase I (Dunnett’s test).
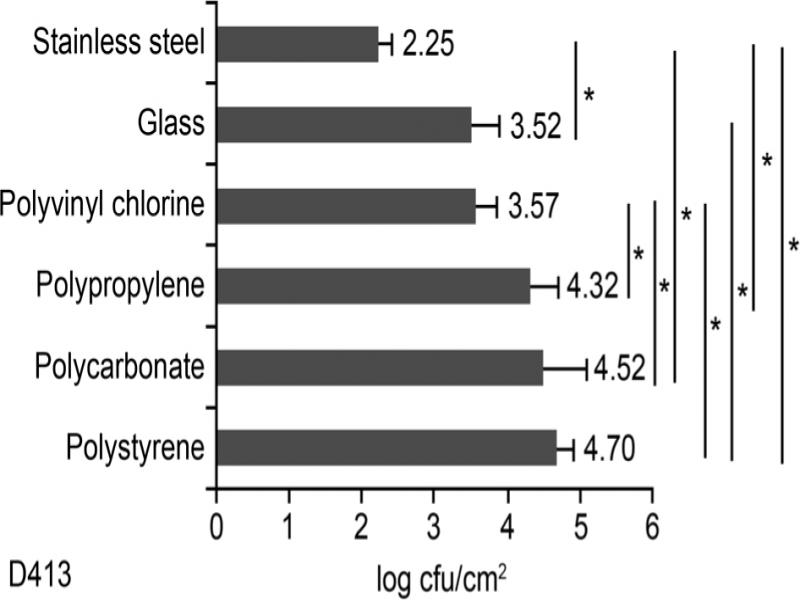
Fig. 3.
The viable cell counts of D413 biofilms formed on surfaces (Tukey test; p < 0.05*).
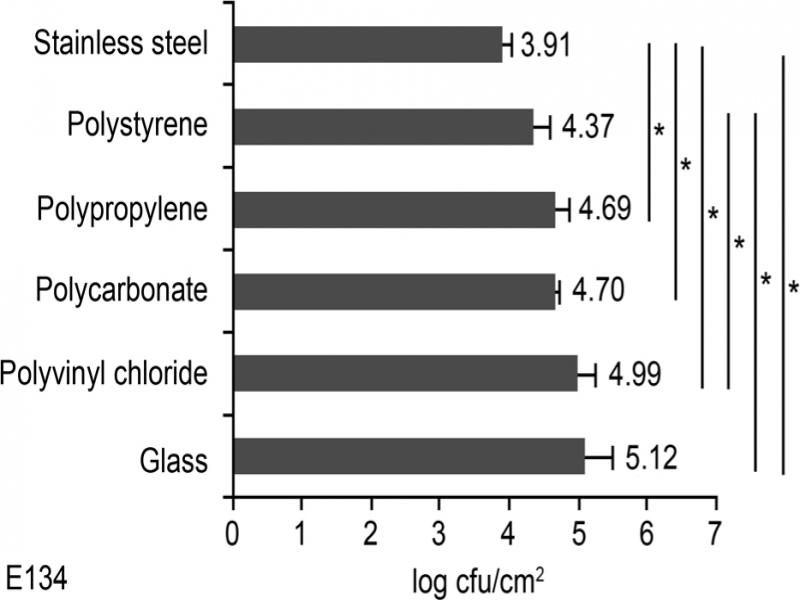
Fig. 4.
The viable cell counts of E134 biofilms formed on surfaces (Tukey test; p < 0.05*).
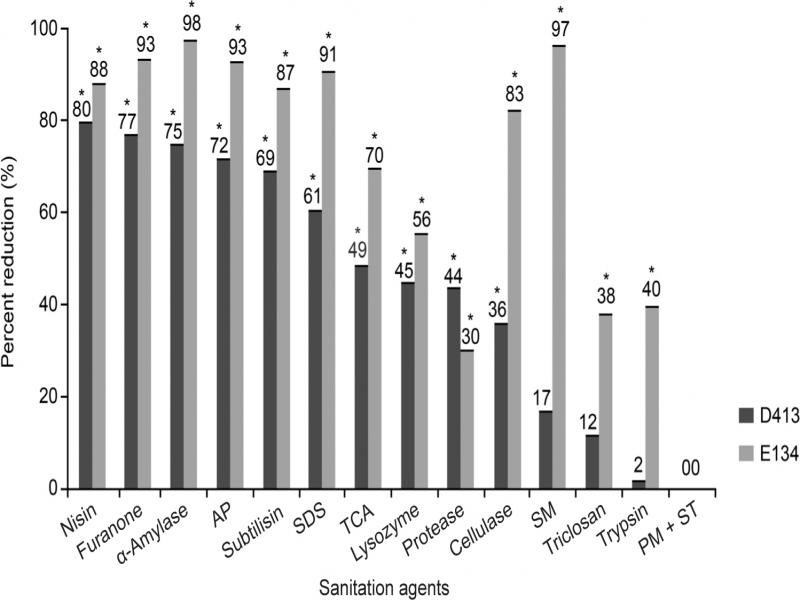
Fig. 5.
The effects of sanitation agents on the biofilm of D413 and E134 isolates (Dunnett’s test; p < 0.05*).