
Fig. 1.
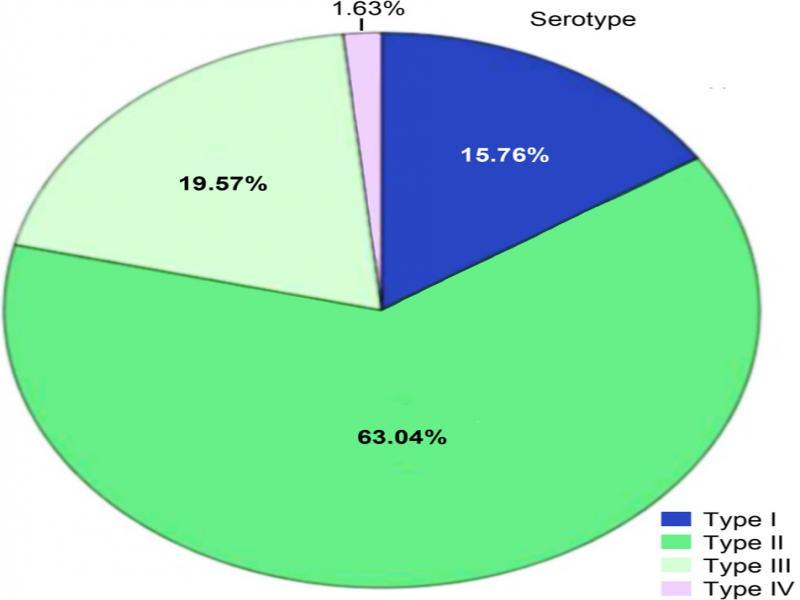
Fig. 2.

Logistic regression analysis of predictors of dengue fever severity_
| Predictors | B | S.E. | OR (95% CI) | p | |
|---|---|---|---|---|---|
| Age | Overall | 0.22 | 0.10 | 1.24 (0.33–1.49) | 0.224 |
| 0–9 | –081 | 0.81 | 0.44 (0.09–2.19) | 0.319 | |
| 10–19 | –0.51 | 0.60 | 0.60 (0.18–1.95) | 0.394 | |
| 20–29 | –1.53 | –0.49 | 0.22 (0.08–1.57) | 0.202 | |
| 30–39 | –0.66 | 0.47 | 0.52 (0.20–1.30) | 0.162 | |
| 40–49 | –0.83 | 0.47 | 0.44 (0.17–1.09) | 0.077 | |
| Type of infection | Overall | 0.86 | 0.42 | 2.36 (1.03–5.39) | 0.042* |
| Secondary infection | –0.91 | 0.44 | 0.40 (0.17–0.96) | 0.040* | |
| Co-morbidities | Overall | 0.25 | 0.10 | 1.28 (1.06–1.55) | 0.009* |
| D.M | –0.55 | 0.82 | 0.58 (0.11–2.90) | 0.504 | |
| HTN | 0.77 | 1.01 | 2.15 (0.30–15.60) | 0.449 | |
| D.M & HTN | –0.03 | 0.99 | 0.97 (0.14–6.74) | 0.976 | |
| Others | –1.21 | 1.27 | 0.30 (0.02–3.61) | 0.342 |
Comparison of severe (cases) and non-severe dengue (controls) patients’ socio-demographic and clinical features_
| Characteristics | Cases No. (%) | Controls No. (%) | Significance test | p-value | |
|---|---|---|---|---|---|
| Gender | Female | 23 (41.8) | 32 (58.2) | Χ2 = 2.048 | 0.12 |
| Male | 100 (31.9) | 213 (68.1) | |||
| Age by years Category | 0–9 | 3 (30) | 7 (70) | Χ2 = 24.164 | 0.00* |
| 10–19 | 13 (40.6) | 19 (59.4) | |||
| 20–29 | 21 (19.1) | 89 (80.9) | |||
| 30–39 | 36 (35.3) | 66 (64.7) | |||
| 40–49 | 24 (34.3) | 46 (65.7) | |||
| 50+ | 26 (59.1) | 18 (40.9) | |||
| Mean ± SD | 36.8 ± 14.4 | 14.3 ± 11.62 | T = 3.330 | 0.00* | |
| Nationality | Saudi | 33 (34%) | 64 (66) | Χ2 = 0.21 | 0.88 |
| Non-Saudi | 90 (33.2) | 181 (66.8) | |||
| Occupation | Outdoor jobs | 53 (34) | 103 (66) | Χ2 = 2.030 | 0.56 |
| Indoor jobs | 38 (30.6) | 86 (69.4) | |||
| Student | 16 (32) | 34 (68) | |||
| Not working | 14 (43.8) | 18 (56.3) | |||
| Address | North | 35 (29.4) | 84 (70.6) | Χ2 = 2.809 | 0.59 |
| Middle | 44 (32.1) | 93 (67.9) | |||
| South | 34 (39.5) | 52 (60.5) | |||
| East | 5 (35.7) | 9 (64.3) | |||
| Outside | 5 (41.7) | 7 (58.3) | |||
| Type of infection | Primary | 109 (31.9) | 233 (68.1) | Χ2 = 5.244 | 0.02* |
| Secondary | 14 (53.8) | 12 (46.2) | |||
| Access to health care (No. of fever days) | Mean ± SD | 3.37 ± 3.21 | 3.24 ± 2.38 | T = 0.528 | 0.598 |
| Comorbidities | No | 92 (29.2) | 223 (70.8) | Χ2 = 20.571 | 0.00* |
| DM | 12 (70.6) | 5 (29.4) | |||
| HTN | 13 (59.1) | 9 (40.9) | |||
| DM&HTN | 2 (33.3) | 4 (66.7) | |||
| Other | 4 (50) | 4 (50) | |||
| Serotype | Type1 | 14 (24.1) | 44 (75.9) | Χ2 = 5.405 | 0.144 |
| Type2 | 86 (37.1) | 146 (62.9) | |||
| Type3 | 20 (27.8) | 52 (72.2) | |||
| Type4 | 3 (50) | 3 (50) | |||
| WBC count (103/µl) | Mean ± SD | 4.11 ± 2.87 | 4.22 ± 3.811 | T = –0.29 | 0.771 |
| Platelet count (103/µl) | Mean ± SD | 123.8 ± 92.09 | 137.6 ± 99.8 | T = –0.899 | 0.369 |
| HTC | Mean ± SD | 43.4 ± 12.9 | 43.5 ± 9.31 | T = –0.025 | 0.468 |
Demographic profile of the studied sample_
| Variable | No. | % | |
|---|---|---|---|
| Age by year Category | (0–9) | 10 | 2.7 |
| (10–19) | 32 | 8.7 | |
| (20–29) | 110 | 29.9 | |
| (30–39) | 102 | 27.7 | |
| (40–49) | 70 | 19.0 | |
| (50-older) | 44 | 12.0 | |
| Gender | Male | 313 | 85.1 |
| Female | 55 | 14.9 | |
| Nationality | Saudi | 97 | 26.4 |
| Non-Saudi | 271 | 73.6 | |
| Type of infection | Primary | 342 | 92.9 |
| Secondary | 26 | 7.1 | |
| Occupation | Outdoor jobs | 156 | 42.4 |
| Indoor jobs | 124 | 33.7 | |
| Students | 50 | 13.6 | |
| Not working | 32 | 8.7 |