
Table I
Bacterial strains used in the specificity assessment.
| Strain | Origin | FAM | HEX |
|---|---|---|---|
| Proteus mirabilis | CVCC4106 | + | − |
| Proteus mirabilis | CVCC1969 | + | − |
| Proteus mirabilis | ATCC35659 | + | − |
| Proteus mirabilis | CMCC49001 | + | − |
| Proteus mirabilis | Isolated by lab | + | − |
| Proteus mirabilis | Isolated by lab | + | − |
| Proteus mirabilis | Isolated by lab | + | − |
| Proteus mirabilis | Isolated by lab | + | − |
| Proteus vulgaris | ATCC6896 | − | + |
| Proteus vulgaris | CMCC 49008 | − | + |
| Proteus vulgaris | CMCC49027 | − | + |
| Proteus vulgaris | CMCC 49105 | − | + |
| Proteus vulgaris | Isolated by lab | − | + |
| Proteus vulgaris | Isolated by lab | − | + |
| Proteus vulgaris | Isolated by lab | − | + |
| Proteus penneri | ATCC 33519 | − | − |
| Proteus penneri | NTCC 35198 | − | − |
| Providencia rettgeri | ATCC 31052 | − | − |
| Providencia rettgeri | CVCC3947 | − | − |
| Morganella morganii | ATCC9237 | − | − |
| Morganella morganii | CICC71786 | − | − |
| Salmonella | ATCC14028 | − | − |
| Salmonella | CVCC2227 | − | − |
| Salmonella | Isolated by lab | − | − |
| Salmonella | Isolated by lab | − | − |
| Escherichia coli | CICC52719 | − | − |
| Escherichia coli | Isolated by lab | − | − |
| Escherichia coli | Isolated by lab | − | − |
| Staphylococcus aureus | ATCC25923 | − | − |
| Staphylococcus aureus | Isolated by lab | − | − |
| Campylobacter jejuni | CICC 22936 | − | − |
| Campylobacter jejuni | Isolated by lab | − | − |
| Mannheimia haemolytica | ATCC29695 | − | − |
| Pseudomonas aeruginosa | Isolated by lab | − | − |
| Lactobacillus acidophilus | CICC6074 | − | − |
| Bacillus subtilis | CICC20445 | − | − |
Table II
Primer and TaqMan probe sequences used in this study.
| Pathogen | Target gene | Accession number | Primer (position) | Sequence (5’ → 3’) | Amplicon length (bp) |
|---|---|---|---|---|---|
| Proteus mirabilis | ureR | CP044134.1 | 64F | ACTACCCATCAGATTATGTCAT | 101 |
| 165R | CTGTTTGAGGAAAATGCAATTTA | ||||
| 136P | FAM-ATTCACACCCTACCCAACATTCAT-BHQ1 | ||||
| Proteus vulgaris | blaB | D37831.1 | 503F | TCGTAAAGAGCCTGAATTAA | 229 |
| 732R | ATCACCACTACCGGTTTTATC | ||||
| 532P | HEX-TCATGGTGATCCTCGTGATACTA-BHQ1 |
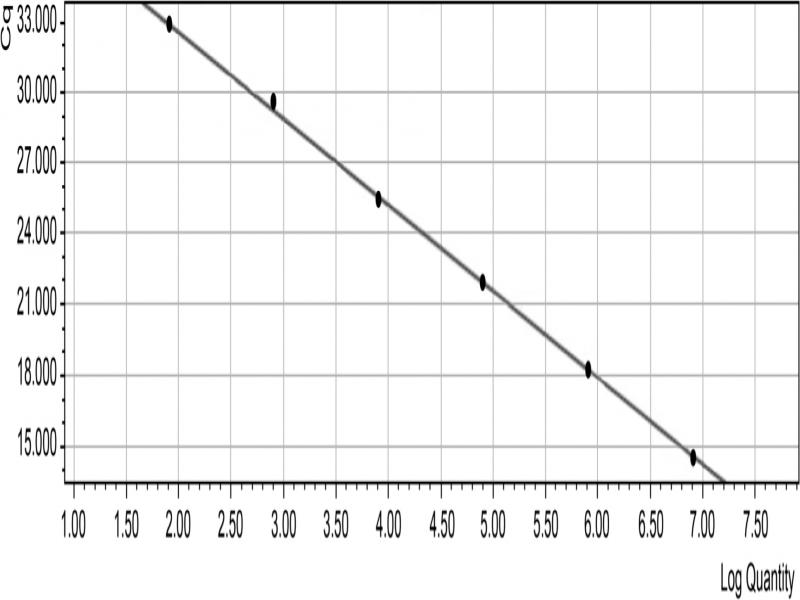
Fig. 1.
P. mirabilis standard curve (Note: log = 1og10).
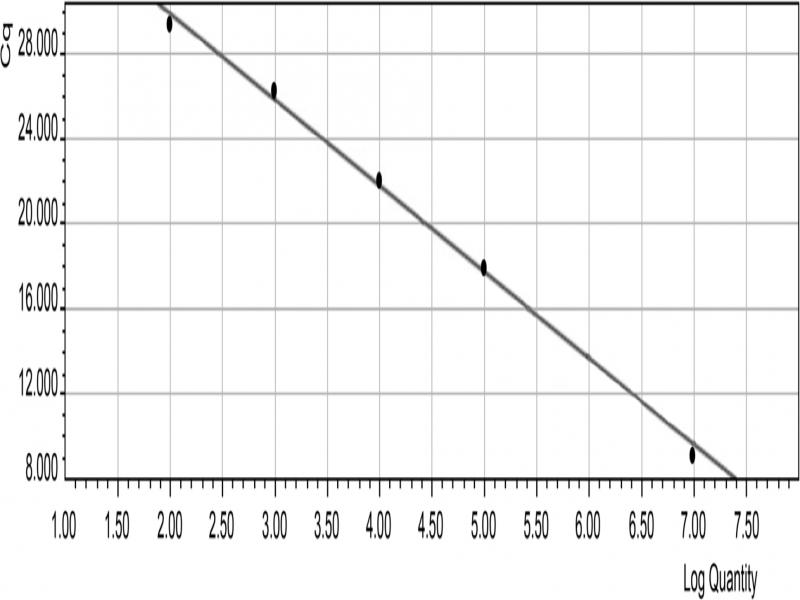
Fig. 2.
P. vulgaris standard curve (Note: log = 1og10).
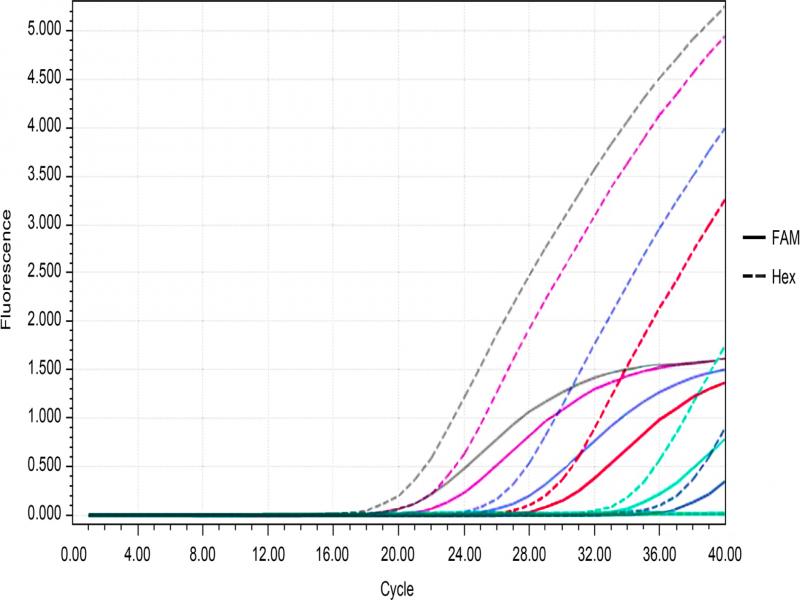
Fig. 3.
Detection limits of P. mirabilis and P. vulgaris in a Dual TaqMan Real-Time PCR Method.
The FAM channel was used to detect P. mirabilis, and the concentration of the ‘S’ amplification curve from left to right was in the range of 6.08 × 10⁷ – 6.08 × 10² CFU/ml. When the concentration of P. mirabilis was 6.08 × 10 CFU/ml, no amplification curve was obtained. The HEX channel was used to detect P. vulgaris, and the concentration of the ‘S’ amplification curve from left to right was in the range of 4.46 × 10⁷ – 4.46 × 10² CFU/ml. When the concentration of P. vulgaris was 4.46 × 10 CFU/ml, no amplification curve was obtained.
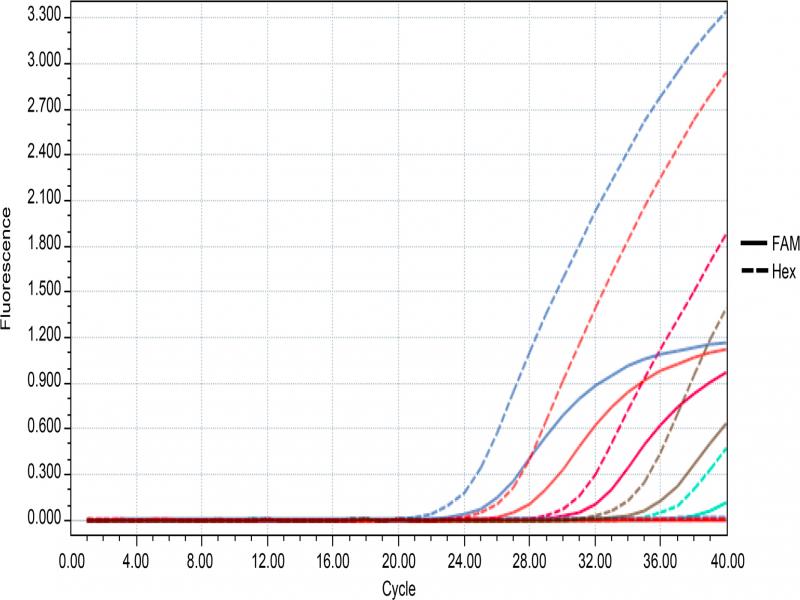
Fig. 4.
Detection limits of P. mirabilis and P. vulgaris in contaminated pork.
The FAM channel was used to detect P. mirabilis, and the concentration of the ‘S’ amplification curve from left to right was in the range of 107 – 103 CFU/g. The HEX channel was used to detect P. vulgaris, and the concentration of the ‘S’ amplification curve from left to right was in the range of 107 – 103 CFU/g.
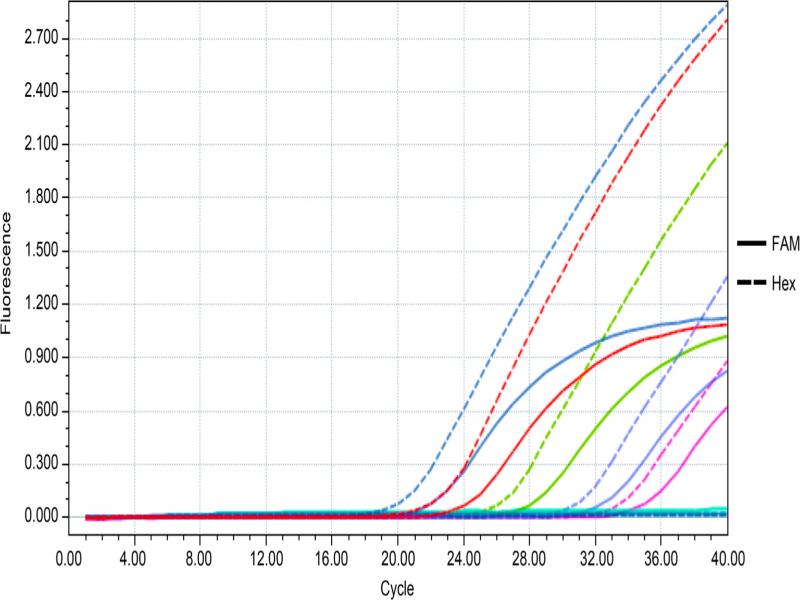
Fig. 5.
Detection limits of P. mirabilis and P. vulgaris in contaminated milk.
The FAM channel was used to detect P. mirabilis, and the concentration of the ‘S’ amplification curve from left to right was in the range of 107 – 103 CFU/g. The HEX channel was used to detect P. vulgaris, and the concentration of the ‘S’ amplification curve from left to right was in the range of 107 – 103 CFU/g.