
Fig. 1.
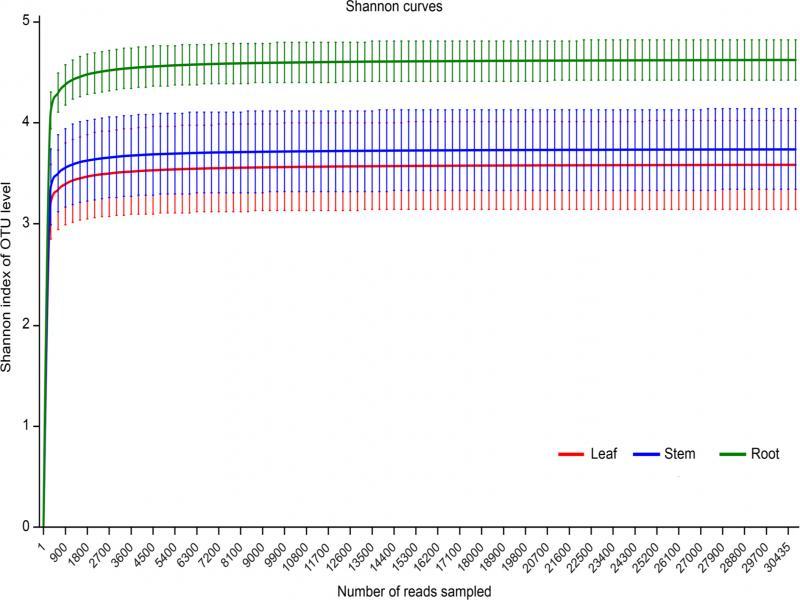
Fig. 2.
Fig. 3.
Fig. 4.
Fig. 5.
Fig. 6.
Fig. 7.
Characteristics of effective tags from samples of endophytic bacteria and rhizosphere bacteria associated with G_ littoralis_
| Sample | Sample site | Number of tags | Total length (bp) | Average length (bp) | Effective (%) |
|---|---|---|---|---|---|
| Leaf1 | 1 | 61,491 | 24,250,816 | 394 | 86.74 |
| Leaf2 | 2 | 70,539 | 27,826,647 | 394 | 87.38 |
| Leaf3 | 3 | 72,502 | 28,614,926 | 394 | 80.78 |
| Leaf4 | 4 | 56,679 | 22,401,393 | 395 | 71.51 |
| Stem1 | 1 | 74,176 | 29,259,670 | 394 | 85.41 |
| Stem2 | 2 | 71,883 | 28,374,408 | 394 | 79.27 |
| Stem3 | 3 | 73,232 | 28,877,138 | 394 | 66.46 |
| Stem4 | 4 | 68,971 | 27,201,006 | 394 | 81.54 |
| Root1 | 1 | 74,705 | 29,478,191 | 394 | 79.50 |
| Root2 | 2 | 70,456 | 27,847,105 | 395 | 70.56 |
| Root3 | 3 | 53,183 | 21,019,550 | 395 | 72.88 |
| Root4 | 4 | 72,017 | 28,464,459 | 395 | 73.40 |
Operational taxonomic unit (OTU) richness and diversity indices of different samples associated with G_ littoralis with a 97% similarity cut-off_
| Sample name | OTUs observed | Shannon | Chao1 | ACE | Coverage (%) |
|---|---|---|---|---|---|
| Leaf | 526 ± 34 b | 3.58 ± 0.43 b | 600 ± 66 b | 599 ± 69 b | 99.6 |
| Steam | 555 ± 22 b | 3.73 ± 0.39 b | 613 ± 82 b | 616 ± 77 b | 99.6 |
| Root | 694 ± 19 a | 4.60 ± 0.19 a | 803 ± 40 a | 818 ± 42 a | 99.6 |
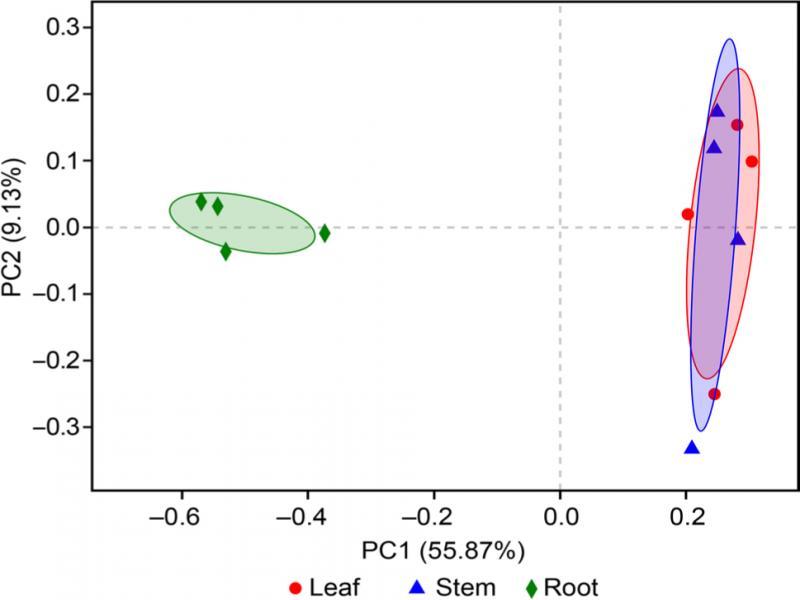
The Adonis analysis of the difference among samples associated with G_ littoralis_
| Tissues | Leaf | Stem |
|---|---|---|
| Root | R2 = 0.68, p = 0.027 | R2 = 0.46, p = 0.041 |
| Stem | R2 = 0.09, p = 0.748 |