
Table I
Statistical analysis of the risk factors associated with microscopic positives for Entamoeba species and PCR positives for E. histolytica in asymptomatic subjects.
| Variants | Total frequency | Frequency and percentages of positive by microscopy | Percentage within each group | 95%CI | p-value | |
|---|---|---|---|---|---|---|
| Lower | upper | |||||
| Gender | ||||||
| Male | 524 (55.2%) | 29 (41.4%) | 524 (5.5%) | 0.036 | 0.075 | 0.018* |
| Female | 426 (44.8%) | 41 (58.6%) | 426 (9.6%) | 0.069 | 0.125 | |
| Residency | ||||||
| Urban | 702 (73.9%) | 48 (68.6%) | 702 (6.8%) | 0.049 | 0.090 | 0.322 |
| Rural | 248 (26.1%) | 22 (31.4%) | 248 (8.9%) | 0.054 | 0.125 | |
| Age group | ||||||
| 15–18 | 87 (9.2%) | 4 (5.7%) | 87 (4.6%) | 0.009 | 0.090 | 0.76 |
| 19–25 | 311 (32.7%) | 24 (34.3%) | 311 (7.7%) | 0.048 | 0.108 | |
| 26–35 | 328 (34.5%) | 26 (37.1%) | 328 (7.9%) | 0.050 | 0.110 | |
| 36–45 | 157 (16.5%) | 13 (18.6%) | 157 (8.3%) | 0.00 | 0.100 | |
| > 45 | 67 (7.1%) | 3 (4.3%) | 67 (4.5%) | 0.00 | 0.308 | |
| Educational level | ||||||
| Primary school | 298 (31.4%) | 25 (35.7%) | 298 (8.4%) | 0.053 | 0.115 | 0.73 |
| Secondary and high school | 448 (47.2%) | 31 (44.3%) | 448 (6.9%) | 0.044 | 0.096 | |
| Bachelor | 204 (21.5%) | 14 (20%) | 204 (6.9%) | 0.036 | 0.107 | |
| Family size | ||||||
| 1–2 | 92 (9.7%) | 5 (7.1%) | 92 (5.4%) | 0.011 | 0.105 | 0.563 |
| 3–4 | 228 (24%) | 13 (18.6%) | 228 (5.7%) | 0.028 | 0.086 | |
| 5–6 | 301 (31.7%) | 24 (34.3%) | 301 (8%) | 0.050 | 0.112 | |
| > 6 | 329 (34.6%) | 28 (40%) | 329 (8.5%) | 0.055 | 0.116 | |
| Income status | ||||||
| Poor | 355 (37.4%) | 39 (55.7%) | 355 (11%) | 0.078 | 0.142 | 0.004* |
| Middle class | 594 (62.5%) | 31 (44.3%) | 594 (5.2%) | 0.033 | 0.069 | |
| Wealthy | 1 (0.1%) | 0 (0%) | 1 (0%) | 0.00 | 0.00 | |
| Source of water supply | ||||||
| Chlorinated water | 646 (68%) | 39 (55.7%) | 646 (6%) | 0.042 | 0.079 | 0.062 |
| Well water | 302 (31.8%) | 31 (44.3%) | 302 (10.3%) | 0.068 | 0.138 | |
| Others | 2 (0.2%) | 0 (0%) | 2 (0%) | 0.00 | 0.00 | |
| Eating out of home | ||||||
| Never | 259 (27.3%) | 17 (24.3%) | 259 (6.6%) | 0.039 | 0.096 | 0.857 |
| Sometimes | 310 (32.6%) | 24 (34.3%) | 310 (7.7%) | 0.045 | 0.110 | |
| Always | 381 (40.1%) | 29 (41.4%) | 381 (7.6%) | 0.050 | 0.104 | |
| History of taking medications | ||||||
| In the last 2 weeks | 140 (14.7%) | 6 (8.6%) | 140 (4.3%) | 0.013 | 0.075 | 0.161 |
| More than 2 weeks | 810 (85.3) | 64 (91.4%) | 810 (7.9%) | 0.059 | 0.098 | |
| Hygiene practice | ||||||
| Washing vegetables and fruits | 920 (96.8%) | 66 (94.3%) | 920 (7.2%) | 0.055 | 0.088 | 0.204 |
| Eating raw unwashed vegetables and fruits | 30 (3.2%) | 4 (5.7%) | 30 (13.3%) | 0.029 | 0.263 | |
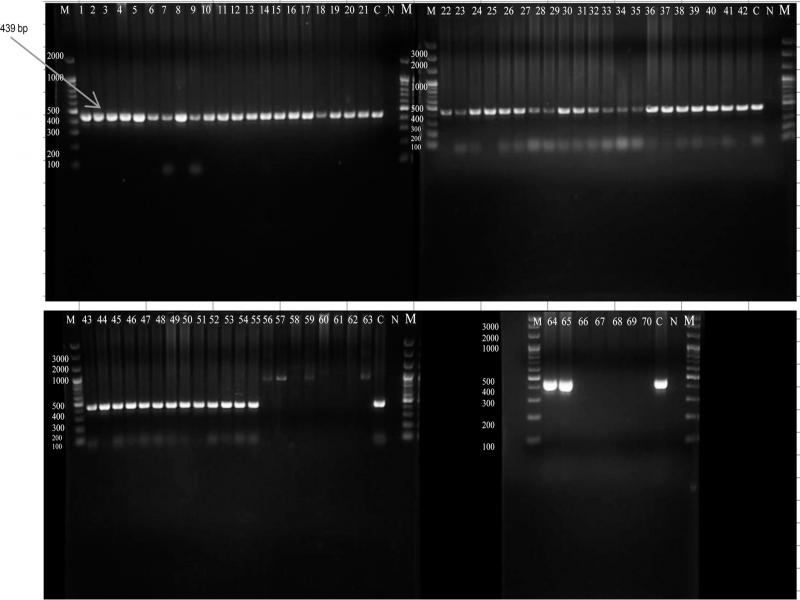
Fig. 1.
Agarose gel electrophoresis analysis for nested PCR products, using primers specific for E. histolytica, positive samples reveal 439 bp bands. Samples 1 to 55, 64,and 65 showed 439 bands; samples 56 to 63 and 66 to 70 tested negative for E. histolytica. Some of these negatives showed 900 bp bands, which are the product of the first PCR and an indicator for the presence of other Entamoeba species. C represented positive control, N represented negative control and M the 100 bp DNA marker.
Table II
Frequency and percentages of positive and negative results for E. histolytica, E. dispar and E. moshkovskii as single and mixed infections.
| Entamoeba species | Frequency & percentage of Positives by PCR per total (microscopic) positives | Frequency & percentage of Negatives by PCR per total (microscopic) positives | Frequency & percentage of positives per population | Frequency and percentage of single infection/positives | Frequency and percentage of mixed infection/positives | Frequency and percentage of single infection/total positives | Frequency and percentage of mixed infection/total positives |
|---|---|---|---|---|---|---|---|
| E. histolytica | 57/70 (81.4%) | 13/70 (18.6%) | 57/950 (6%) | 29/57 (50.9%) | 28/57 (49.1%) | 29/70 (41.4%) | 28/70 (40%) |
| E. dispar | 41/70 (58.6%) | 29/70 (41.4%) | 41/950 (4.3%) | 13/41 (31.7%) | 28/41 (68.3%) | 13/70 (18.6%) | 28/70 (40%) |
| E. moshkovskii | 3/70 (4.3%) | 67/70 (95.7%) | 3/950 (0.3%) | 0/3 (0%) | 3/3 (100%) | 0/70 (0%) | 3/70 (4.3%) |
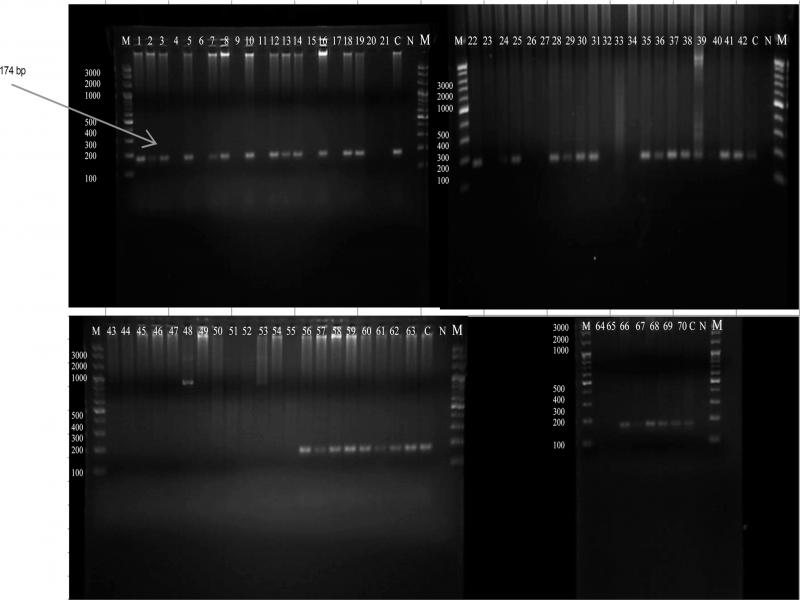
Fig. 2.
Detection of E. dispar after using species specific primers in the second round of the nested PCR; amplification products were analyzed by agarose gel electrophoresis and the stained gels were visualized under UV light. Positive samples exhibited 174 bp bands, which appeared in sample numbers (1, 2, 3, 5, 7, 8, 10, 12, 13, 14, 16, 18, 19,22, 24, 25, 28, 29, 30, 31), (35 to 42), (56 to 63), and (66 to 70). Samples (4, 6, 9, 11, 15, 17, 20, 21, 23, 26, 27, 32, 33, 34, 64, 65) and (43 to 55) tested negative for E. dispar. C represented positive control, N represented negative control and M was the 100 bp DNA marker.
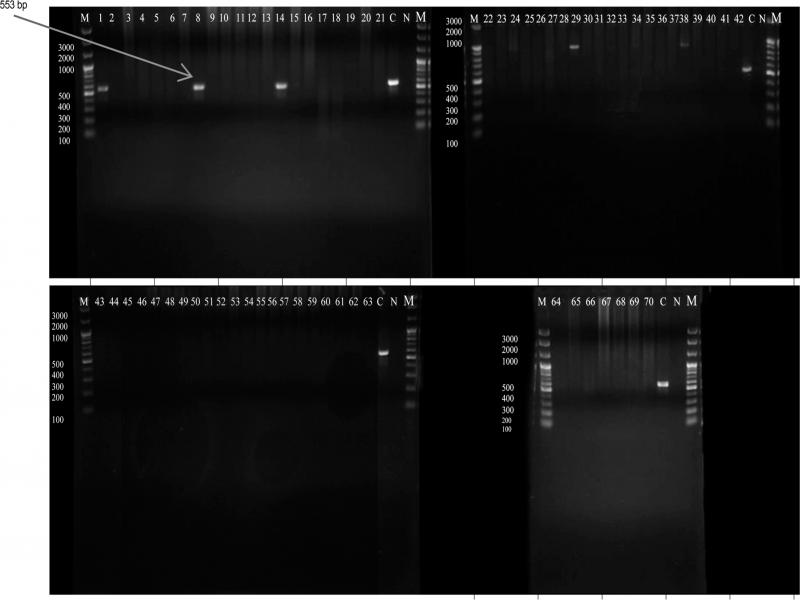
Fig. 3.
Nested PCR for identification of E. moshkovskii, determined with specific primers for each species, and analyzed by agarose gel electrophoresis. Positive samples amplifying 553 bp amplicon appeared in only three samples (1, 8, and 14); the remaining samples were negative. C represented positive control, N represented negativecontrol, and M was the 100 bp DNA marker.