
Table I
Diagnostic performance of anti-HEV IgM assays.
| Commercial tests | % Sensitivity (95% CI) | % Specificity (95% CI) | % PPV (95% CI) | % NPV (95% CI) | AUC (95% CI) | p | % Specificity with RD (95% CI) | % Specificity with CMV/EBV (95% CI) | % Specificity with healthy (95% CI) |
|---|---|---|---|---|---|---|---|---|---|
| Wantai | 84.9 (75.5–91.7) | 100 (98.7–100) | 100 (100–100) | 95.5 (92.8–97.2) | 0.924 (0.892–0.949) | < 0.01 | 100 (100–100) | 100 (100–100) | 100 (100–100) |
| Kehua | 86.0 (76.9–92.6) | 100 (98.7–100) | 100 (100–100) | 95.9 (93.2–97.5) | 0.930 (0.899–0.954) | < 0.01 | 100 (100–100) | 100 (100–100) | 100 (100–100) |
| Lizhu | 83.7 (74.2–90.8) | 100 (98.7–100) | 100 (100–100) | 95.2 (92.5–97.0) | 0.919 (0.886–0.945) | < 0.01 | 100 (100–100) | 100 (100–100) | 100 (100–100) |
| Genelabs | 82.6 (72.9–89.9) | 99.3 (97.4–99.9) | 97.3 (89.9–99.3) | 94.8 (92.1–96.7) | 0.909 (0.875–0.937) | < 0.01 | 97.8 (94.8–100) | 100 (100–100) | 100 (100–100) |
Table II
Concordance for anti-HEV IgM assays in the diagnosis of the acute HEV infections.
| Commercial tests | % Concordance | Kappa (95% CI) |
|---|---|---|
| Wantai | ||
| Kehua | 98.8 | 0.950 (0.852–1.000) |
| Lizhu | 98.8 | 0.953 (0.862–1.000) |
| Genelabs | 95.3 | 0.819 (0.648–0.990) |
| Kehua | ||
| Lizhu | 97.7 | 0.903 (0.771–1.000) |
| Genelabs | 96.5 | 0.860 (0.706–1.000) |
| Lizhu | ||
| Genelabs | 96.5 | 0.868 (0.722–1.000) |
Table III
Diagnostic performance of anti-HEV IgG assays.
| Commercial tests | % Sensitivity (95% CI) | % Specificity (95% CI) | % PPV (95% CI) | % NPV (95% CI) | AUC (95% CI) | p | % Specificity with RD (95% CI) | % Specificity with CMV/EBV (95% CI) | % Specificity with healthy (95% CI) |
|---|---|---|---|---|---|---|---|---|---|
| Wantai | 91.9 (83.9–96.7) | 74.8 (69.3–79.8) | 53.0 (47.7–58.3) | 96.7 (93.6–98.4) | 0.833 (0.791–0.870) | < 0.01 | 79.2 (71.0–87.3) | 81.3 (73.3–89.3) | 64.6 (55.0–74.1) |
| Kehua | 87.2 (78.3–93.4) | 97.5 (94.9–99.0) | 91.5 (83.7–95.7) | 96.1 (93.4–97.7) | 0.923 (0.891–0.949) | < 0.01 | 98.9 (96.6–100) | 97.8 (94.8–100) | 96.9 (93.4–100) |
| Lizhu | 89.5 (81.1–95.1) | 75.9 (70.4–80.8) | 53.5 (48.0–58.9) | 95.9 (92.6–97.8) | 0.827 (0.784–0.865) | < 0.01 | 83.5 (75.9–91.1) | 74.7 (65.8–83.6) | 69.8 (60.6–79.0) |
| Genelabs | 88.4 (79.7–94.3) | 97.5 (94.9–99.0) | 91.6 (83.9–95.8) | 96.4 (93.8–98.0) | 0.929 (0.898–0.953) | < 0.01 | 98.9 (96.6–100) | 96.7 (93.0–100) | 97.9 (95.0–100) |
Table IV
Concordance for anti-HEV IgG assays.
| Commercial tests | Concordance of HEV | Concordance of RD | Concordance of CMV/EBV | Concordance of healthy | ||||
|---|---|---|---|---|---|---|---|---|
| % | Kappa (95% CI) | % | Kappa (95% CI) | % | Kappa (95% CI) | % | Kappa (95% CI) | |
| Wantai | ||||||||
| Kehua | 95.3 | 0.753 (0.524–0.982) | 80.2 | 0.081 (–0.069–0.231) | 81.3 | 0.069 (–0.102–0.239) | 68.8 | 0.147 (0.015–0.279) |
| Lizhu | 98.8 | 0.927 (0.785–1.000) | 91.2 | 0.712 (0.525–0.898) | 88.5 | 0.809 (0.664–0.954) | 94.8 | 0.882 (0.782–0.982) |
| Genelabs | 96.5 | 0.805 (0.592–1.000) | 80.2 | 0.081 (–0.069–0.231) | 82.4 | 0.153 (–0.064–0.369) | 67.7 | 0.111 (–0.007–0.229) |
| Kehua | ||||||||
| Lizhu | 96.5 | 0.823 (0.629–1.000) | 84.6 | 0.107 (–0.087–0.300) | 76.9 | 0.125 (–0.034–0.283) | 74.0 | 0.183 (0.238–0.341) |
| Genelabs | 96.5 | 0.837 (0.658–1.000) | 100 | 1.000 (1.000–1.000) | 98.9 | 0.795 (0.403–1.000) | 99.0 | 0.852 (0.566–1.000) |
| Lizhu | ||||||||
| Genelabs | 95.3 | 0.752 (0.520–0.984) | 84.6 | 0.107 (–0.087–0.300) | 78.0 | 0.183 (0.001–0.366) | 72.9 | 0.139 (–0.005–0.282) |
Table V
Consistency for HEV Ag and HEV RNA assays in the diagnosis of the acute HEV infections.
| HEV RNA +, n (%) | HEV RNA −, n (%) | Total, n (%) | |
|---|---|---|---|
| HEV Ag +, n (%) | 36 (41.86) | 0 (0) | 36 (41.86) |
| HEV Ag −, n (%) | 8 (9.3) | 42 (48.84) | 50 (58.14) |
| Total, n (%) | 44 (51.16) | 42 (48.84) | 86 (100) |
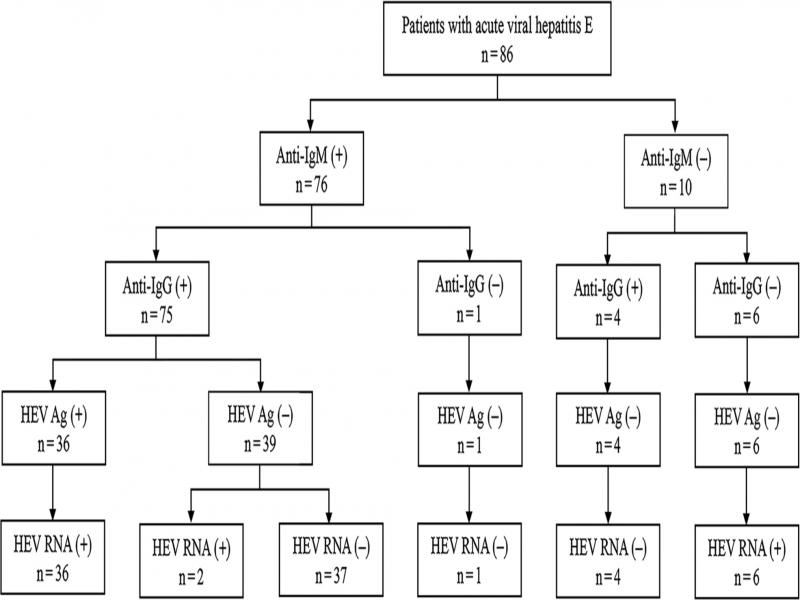
Fig. 1.
Flow diagram for patients with acute viral hepatitis E.