
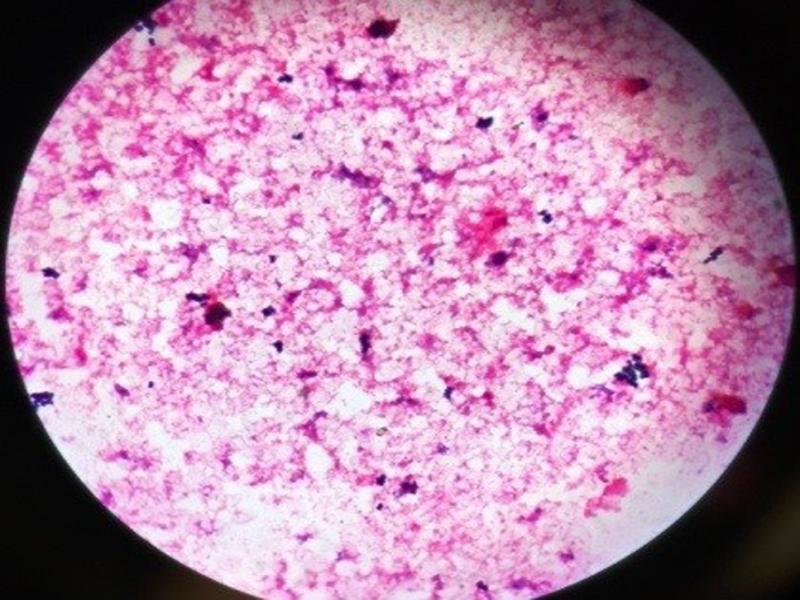
Fig. 1.
Microscopic appearance of Gram-positive bacteria after Gram staining with the routine method at a magnification of 1000×.
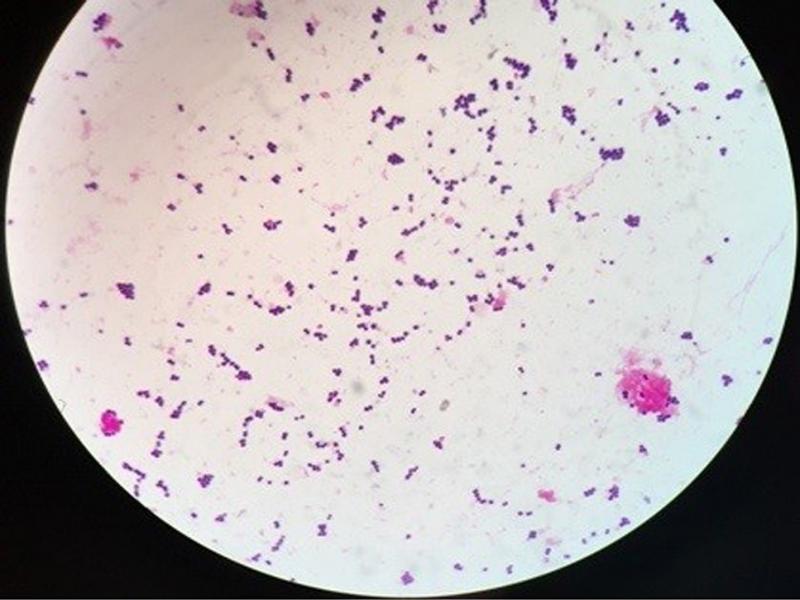
Fig. 2.
Microscopic appearance of Gram-positive bacteria after Gram staining with the rapid method at a magnification of 1000×.
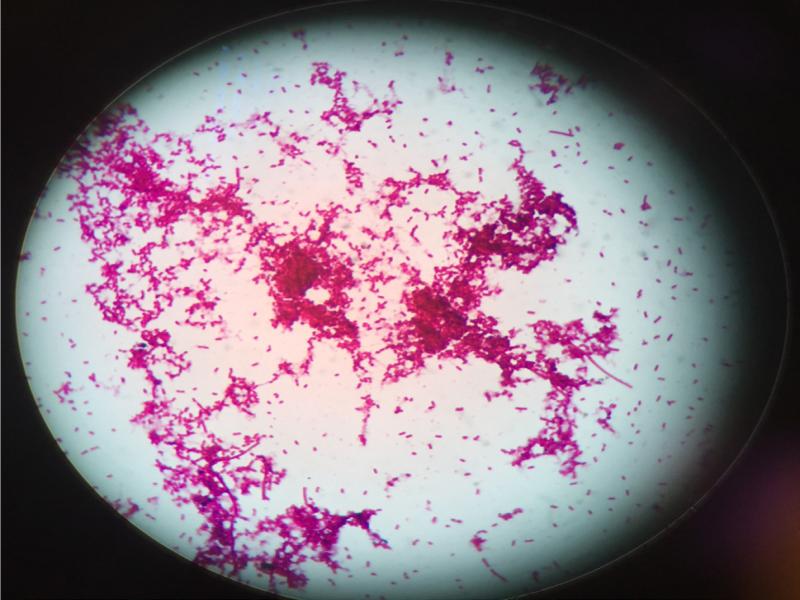
Fig. 3.
Microscopic appearance of Gram-negative bacteria after Gram staining with the routine method at a magnification of 1000×.
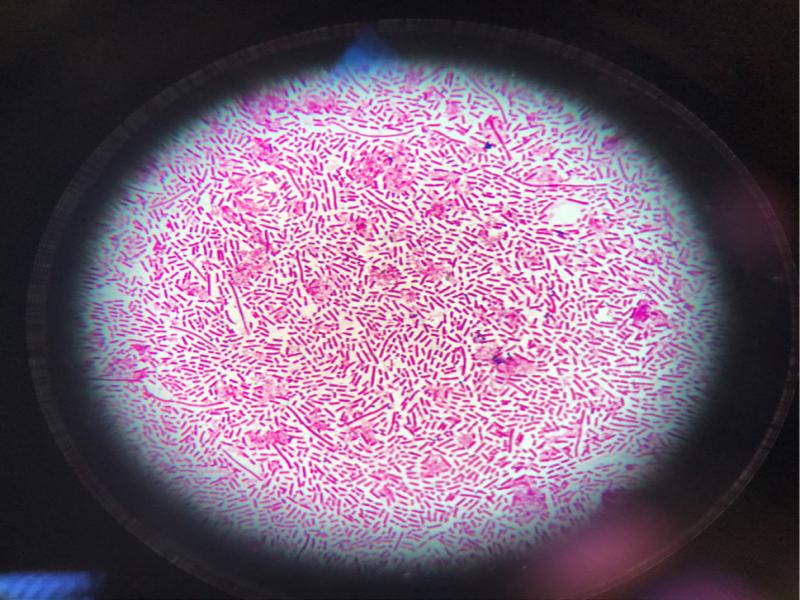
Fig. 4.
Microscopic appearance of Gram-negative bacteria after Gram staining with the rapid method at a magnification of 1000×.
Table I
Distribution of microorganisms detected by Gram staining after centrifugation according to the rapid method procedure.
| Gram-staining result | n (%) |
|---|---|
| Gram-positive cocci | 107 (70.4) |
| Gram-negative bacilli | 30 (19.7) |
| Gram-positive bacilli | 9 (5.3) |
| Gram-positive cocci + Gram-negative bacilli | 2 (1.3) |
| Yeast (Candida spp.) | 4 (2.6) |
| Total number of samples | 152 (100) |
Table II
Distribution of bacteria identified by both methods at the genus and species level.
| Rapid method | n (%) | Routine method | n (%) |
|---|---|---|---|
| Gram-positive bacteria (total) | 116 | Gram-positive bacteria (total) | 116 |
| Staphylococcus aureus | 7 (6.0) | Staphylococcus aureus | 8 (6.9) |
| MRSA: 2, MSSA: 5 | MRSA: 3, MSSA: 5 | ||
| Coagulase-negative Staphylococci | 71 (61.2) | Coagulase-negative Staphylococci | |
| Staphylococcus epidermidis: 45 | Staphylococcus epidermidis: 48 | 76 (65.5) | |
| Staphylococcus hominis: 16 | Staphylococcus hominis: 18 | ||
| Staphylococcusschleiferi: 4 | Staphylococcusschleiferi: 4 | ||
| Staphylococcus haemolyticus: 2 | Staphylococcus haemolyticus: 2 | ||
| Staphylococcus capitis: 2 | Staphylococcus capitis: 2 | ||
| Staphylococcus warneri: 2 | Staphylococcus warneri: 2 | ||
| Enterococci | 20 (17.2) | Enterococci | 20 (17.2) |
| Enterococcus faecalis: 18 | Enterococcus faecalis: 18 | ||
| Enterococcus faecium: 2 | 3 (2.6) | Enterococcus faecium: 2 | 2 (1.8) |
| Arcanobacterium haemolyticum | 3 (2.6) | Arcanobacterium haemolyticum | 2 (1.8) |
| Bacillus cereus/subtilis | 2 (1.8) | Bacillus subtilis | 2 (1.8) |
| Dermacoccus nishinomiyaensis | 4 (3.5) | Dermacoccus nishinomiyaensis | 2 (1.8) |
| Micrococcus luteus/lylae | 3 (2.6) | Micrococcus luteus/lylae | 2 (1.8) |
| Corynebacterium amycolatum | 3 (2.6) | Corynebacterium amycolatum | 2 (1.8) |
| Corynebacterium jeikeium | Corynebacterium jeikeium | ||
| Gram-negative bacteria (total) | 30 | Gram-negative bacteria (total) | 30 |
| Escherichia coli | 15 (50) | Escherichia coli | 15 (50) |
| Pseudomonas aeruginosa | 5 (16.7) | Pseudomonas aeruginosa | 5 (16.7) |
| Klebsiella pneumoniae | 5 (16.7) | Klebsiella pneumoniae | 5 (16.7) |
| Stenotrophomonas maltophilia | 3 (10.0) | Stenotrophomonas maltophilia | 3 (10.0) |
| Acinetobacter baumannii | 2 (6.7) | Acinetobacter baumannii | 2 (6.7) |
| Yeasts | 4 | Yeasts | 4 |
| Candida parapsilosis | 2 (50) | Candida parapsilosis | 2 (50) |
| Candida tropicalis | 2 (50) | Candida tropicalis | 2 (50) |
Table III
Distribution of the identified species according to MALDI-TOF MS results when working with both methods.
| Organisms | MALDI-TOF Biotyper scores < 1.7; 1.7–2.0; ≥ 2 n n n Total | Rapid method n | Routine method n |
|---|---|---|---|
| Gram-positive bacteria | 116 | 116 | 116 |
| Staphylococcus aureus | 0 0 8 8 | 7 | 8 |
| Staphylococcus epidermidis | 0 12 36 48 | 45 | 48 |
| Staphylococcus hominis | 0 2 16 18 | 16 | 18 |
| Staphylococcusschleiferi | 0 0 4 4 | 4 | 4 |
| Staphylococcus haemolyticus | 0 0 2 2 | 2 | 2 |
| Staphylococcus capitis | 0 0 2 2 | 2 | 2 |
| Staphylococcus warneri | 0 0 2 2 | 2 | 2 |
| Enterococcus faecalis | 0 0 18 18 | 18 | 18 |
| Enterococcus faecium | 0 0 2 2 | 2 | 2 |
| Arcanobacterium haemolyticum | 0 1 1 2 | 3 | 2 |
| Bacillus cereus/subtilis | 0 0 0 0 | 1 | 0 |
| Bacillus subtilis | 0 0 2 2 | 2 | 2 |
| Dermacoccus nishinomiyaensis | 0 0 2 2 | 2 | 2 |
| Micrococcus luteus/lylae | 0 1 1 2 | 4 | 2 |
| Corynebacterium amycolatum | 0 1 1 2 | 3 | 2 |
| Corynebacterium jeikeium | 0 1 1 2 | 3 | 2 |
| Gram-negative bacteria | 30 | 30 | 30 |
| Escherichia coli | 0 0 15 15 | 15 | 15 |
| Pseudomonas aeruginosa | 0 1 4 5 | 5 | 5 |
| Klebsiella pneumoniae | 0 0 5 5 | 5 | 5 |
| Stenotrophomonas maltophilia | 0 0 3 3 | 3 | 3 |
| Acinetobacter baumannii | 0 0 2 2 | 2 | 2 |
| Yeasts | 4 | 4 | 4 |
| Candida parapsilosis | 0 0 2 2 | 2 | 2 |
| Candida tropicalis | 0 0 2 2 | 2 | |
| Total | 0 19 131 150 | 150 | 150 |
Table IV
Analysis of the compatibility between the identification results of the rapid method when compared with the MALDI-TOF MS.
| Bacteria | Full consistency n (%) | Misidentified n (%) | Not identified n (%) |
|---|---|---|---|
| Gram-positive bacteria | 104 (89.7) | 12 (10.3) | 0 |
| Gram-negative bacteria | 30 (100) | 0 | 0 |
| Yeasts | 4 (100) | 0 | 0 |
| Total | 138 (92) | 12 (8) | 0 |
Table V
Distribution of the resistance profiles for Gram-positive and Gram-negative bacteria as a result of the antibiotic susceptibility testing when both methods were applied.
| Antibiotics | The rapid method, n (%) | The routine method, n (%) | ||||
|---|---|---|---|---|---|---|
| S | I | R | S | I | R | |
| Amikacin | 28 (93.3) | – | 2 (6.7) | 28 (93.3) | – | 2 (6.7) |
| Ampicillin | 18 (19.1) | – | 76 (80.9) | 18 (19.1) | – | 76 (80.9) |
| Amoxicillin/Clavulanic acid | 18 (15.8) | – | 96 (84.2) | 18 (15.8) | – | 96 (84.2) |
| Aztreonam | 18 (60) | 1 (3.3) | 11 (36.7) | 15 (50) | – | 15 (50) |
| Cefepime | 20 (66.7) | – | 10 (33.3) | 14 (46.7) | – | 16 (53.3) |
| Cefoxitin | – | 36 (41.9) | 50 (58.1) | – | 35 (40.7) | 51 (59.3) |
| Ceftazidime | 10 (33.3) | 10 (33.3) | 10 (33.3) | 10 (33.3) | 10 (33.3) | 10 (33.3) |
| Ceftriaxone | 18 (60) | – | 12 (40) | 18 (60) | – | 12 (40) |
| Ciprofloxacin | 82 (66.1) | – | 42 (33.9) | 66 (53.2) | 10 (8.1) | 48 (38.7) |
| Colistin | 30 (100) | – | – | 30 (100) | – | – |
| Clindamycin | 50 (53.2) | 1 (1.1) | 43 (45.7) | 51 (554.3) | – | 43 (45.7) |
| Daptomycin | 71 (75.5) | 23 (24.5) | – | 65 (69.1) | 29 (30.9) | – |
| Ertapenem | 28 (93.3) | – | 2 (6.7) | 28 (93.3) | – | 2 (6.7) |
| Erythromycin | 14 (14.9) | – | 80 (85.1) | 14 (14.9) | – | 80 (85.1) |
| Fusidic acid | 35 (40.7) | – | 51 (59.3) | 36 (41.9) | – | 50 (58.1) |
| Gentamicin | 66 (53.2) | – | 58 (46.8) | 66 (53.2) | 1 (0.8) | 57 (50) |
| Imipenem | 28 (93.3) | – | 2 (6.7) | 28 (93.3) | – | 2 (6.7) |
| Meropenem | 28 (93.3) | – | 2 (6.7) | 28 (93.3) | – | 2 (6.7) |
| Linezolid | 94 (100) | – | – | 94 (100) | – | – |
| Oxacillin | 12 (12.8) | – | 82 (87.2) | 12 (12.8) | – | 82 (87.2) |
| Piperacillin/Tazobactam | 10 (33.3) | 10 (33.3) | 10 (33.3) | 16 (53.3) | 2 (6.7) | 12 (40) |
| Rifampin | 62 (66) | – | 32 (34) | 62 (66) | – | 32 (34) |
| Teicoplanin | 94 (100) | – | – | 94 (100) | – | – |
| Tetracycline | 35 (40.7) | – | 51 (59.3) | 35 (40.7) | – | 51 (59.3) |
| Tigecycline | 84 (89.4) | 8 (8.5) | 2 (2.1) | 86 (91.5) | 6 (6.4) | 2 (2.1) |
| TMP/SX | 55 (44.4) | – | 69 (55.6) | 51 (41.1) | 3 (2.4) | 70 (56.5) |
| Vancomycin | 94(100) | – | – | 94 (100) | – | – |
| Total | 1102 (55.5) | 89 (4.5) | 793 (40) | 1077 (54.3) | 96 (4.8) | 811 (40.9) |
Table VI
Categorical distribution of discrepancies in the antibiotic susceptibility results of the rapid method compared to the routine method.
| Antibiotics | Agreement n (%) | mEs n (%) | MEs n (%) | VMEs n (%) | Total n |
|---|---|---|---|---|---|
| Amikacin | 30 (100) | 30 | |||
| Ampicillin | 94 (100) | 94 | |||
| Amoxicillin/Clavulanic acid | 114 (100) | 114 | |||
| Aztreonam | 26 (86.7) | 1 (3.3) | 3 (10) | 30 | |
| Cefepime | 24 (80) | 6 (20) | 30 | ||
| Cefoxitin | 85 (98.8) | 1 (1.2) | 86 | ||
| Ceftazidime | 30 (100) | 30 | |||
| Ceftriaxone | 30 (100) | 30 | |||
| Ciprofloxacin | 108 (87.1) | 10 (8.1) | 6 (4.8) | 124 | |
| Colistin | 30 (100) | 30 | |||
| Clindamycin | 93 (98.9) | 1 (1.1) | 94 | ||
| Daptomycin | 88 (93.6) | 6 (6.4) | 94 | ||
| Ertapenem | 30 (100) | 30 | |||
| Erythromycin | 94 (100) | 94 | |||
| Fusidic acid | 85 (98.8) | 1 (1.2) | 86 | ||
| Gentamicin | 123 (99.2) | 1 (0.8) | 124 | ||
| Imipenem | 30 (100) | 30 | |||
| Meropenem | 30 (100) | 30 | |||
| Linezolid | 94 (100) | 94 | |||
| Oxacillin | 94 (100) | 94 | |||
| Piperacillin/Tazobactam | 22 (73.3) | 8 (26.7) | 30 | ||
| Rifampin | 94 (100) | 94 | |||
| Teicoplanin | 94 (100) | 94 | |||
| Tetracycline | 86 (100) | 86 | |||
| Tigecycline | 92 (97.9) | 2 (2.1) | 94 | ||
| TMP/SX | 120 (96.8) | 3 (2.4) | 1 (0.8) | 124 | |
| Vancomycin | 94 (100) | 94 | |||
| Total | 1934 (97.4) | 33 (1.7) | 1 (0.1) | 16 (0.8) | 1984 |