
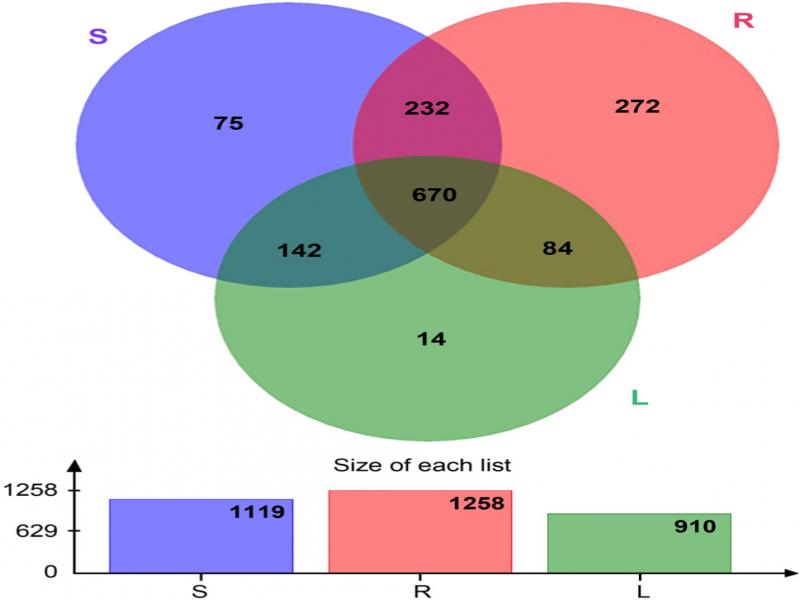
Fig. 1.
OTU relative abundances of roots, stems, and leaves (n = 6). S represents stems, R represents root, and L represents leaf.
Table I
Microbial diversity indices in roots, stems, and leaves (mean ± SD) (n = 6).
| Index | Mean ± SD (R) | Mean ± SD (S) | Mean ± SD (L) | p-value (R-S) | p-value (L-S) | p-value (L-R) |
|---|---|---|---|---|---|---|
| Shannon | 2.66 ± 0.72 | 1.55 ± 0.58 | 0.72 ± 0.28 | 1.51E-02 | 1.07E-02 | 1.10E-04 |
| Chao1 | 614.36 ± 44.24 | 467.46 ± 111.12 | 386.30 ± 66.16 | 1.32E-02 | 1.55E-01 | 3.63E-05 |
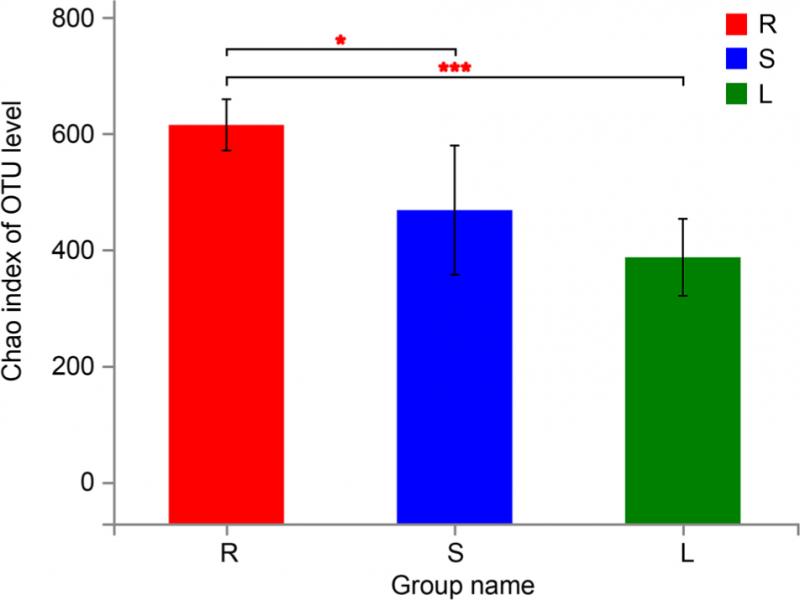
Fig. 2.
Chao index of OTU level of roots, stems, and leaves (mean ± SD) (n = 6). S represents stems, R represents root, and L represents leaf. (0.01 < p ≤ 0.05 marked as *, 0.001 < p ≤ 0.01 marked as **, p ≤ 0.001 marked as ***).
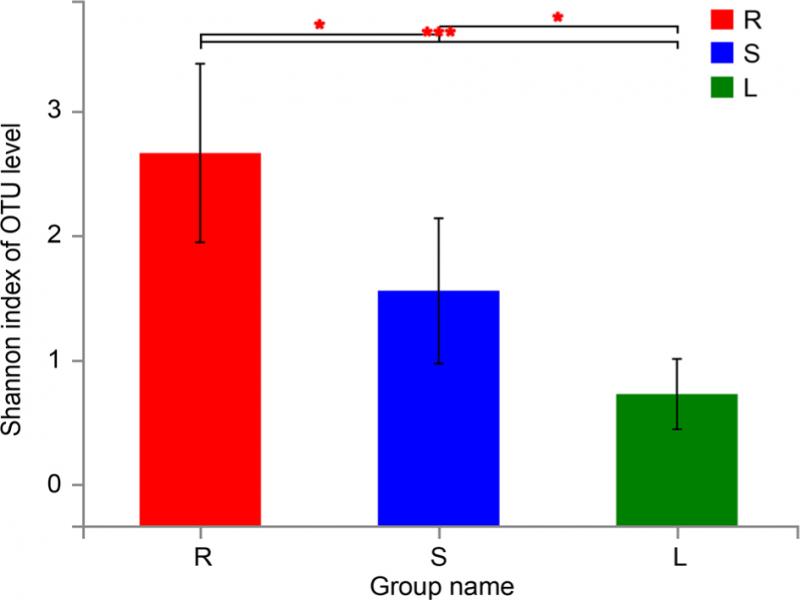
Fig. 3.
Shannon index of OTU level of roots, stems, and leaves (mean ± SD) (n = 6). S represents stems, R represents root, and L represents leaf. (0.01 < p ≤ 0.05 marked as *, 0.001 < p ≤ 0.01 marked as **, p ≤ 0.001 marked as ***).
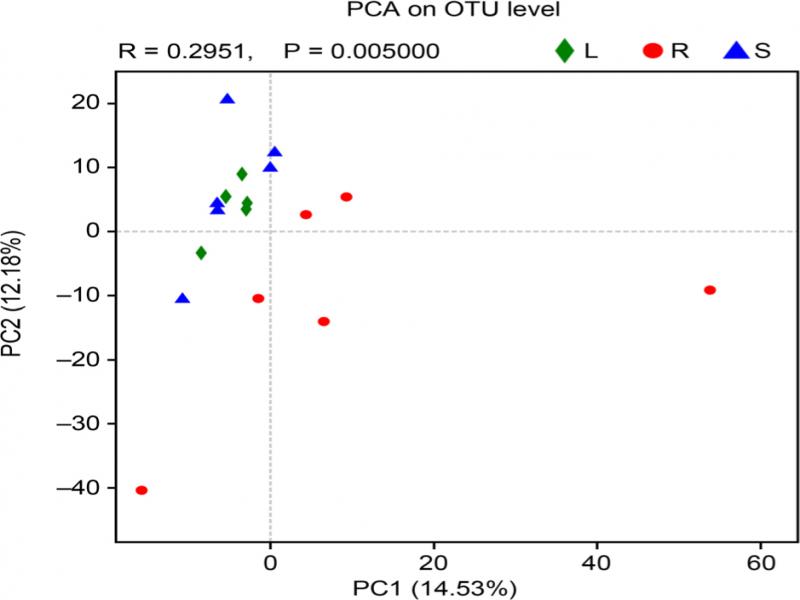
Fig. 4.
PCA of roots, stems, and leaves (n = 6). S represents stems, R represents root, and L represents leaf.
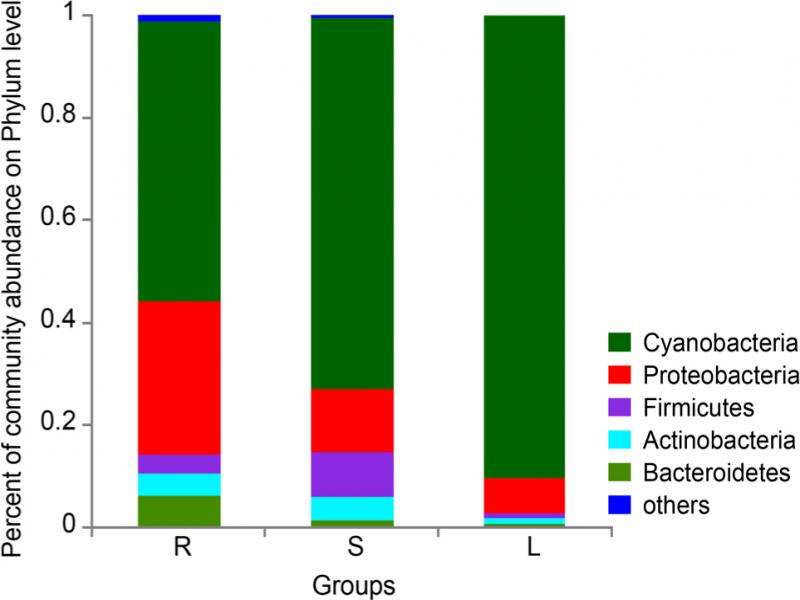
Fig. 5.
Percent of community abundance on the phylum level of roots, stems, and leaves (n = 6). S represents stems, R represents root, and L represents leaf.
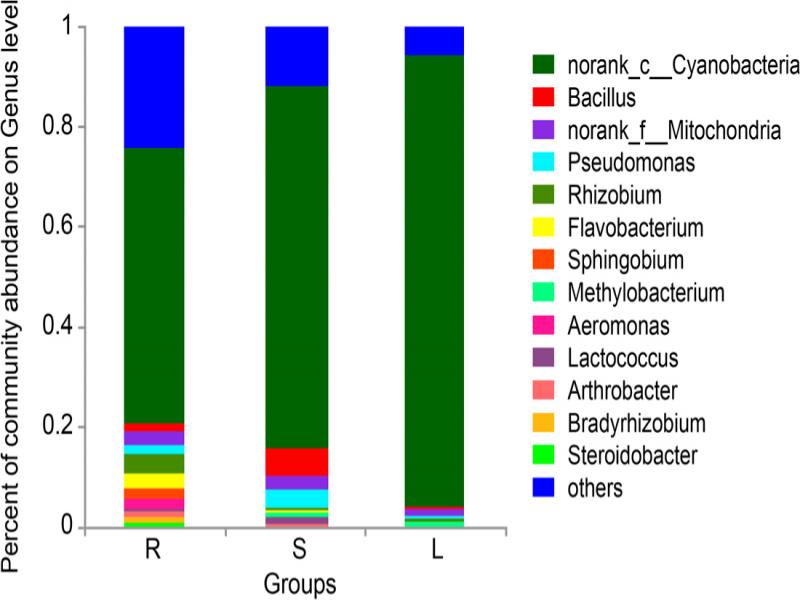
Fig. 6.
Percent of community abundance on Genus level of roots, stems, and leaves (n = 6). S represents stems, R represents root, and L represents leaf.
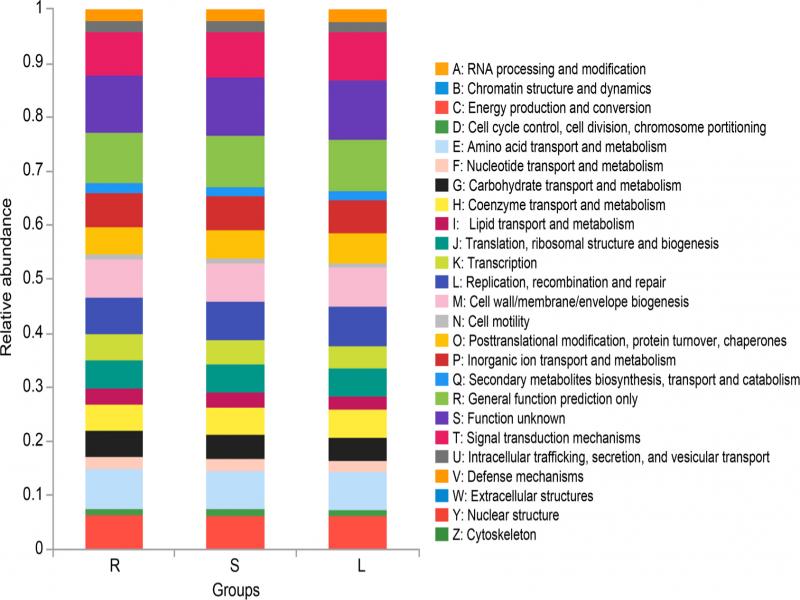
Fig. 7.
Functional relative abundance of roots, stems, and leaves (n = 6). S represents stems, R represents root, and L represents leaf.
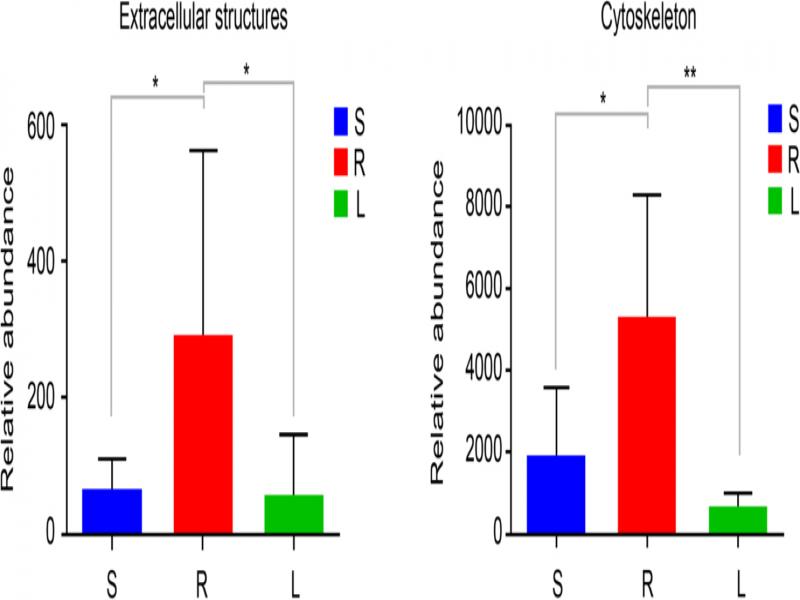
Fig. 8.
Significantly relative abundance of roots, stems, and leaves (mean ± SD) (n = 6). A: enriched in extracellular structures. B: enriched in the cytoskeleton. S represents stems, R represents root, and L represents leaf. (0.01 < p ≤ 0.05 marked as *, 0.001 < p ≤ 0.01 marked as **).