
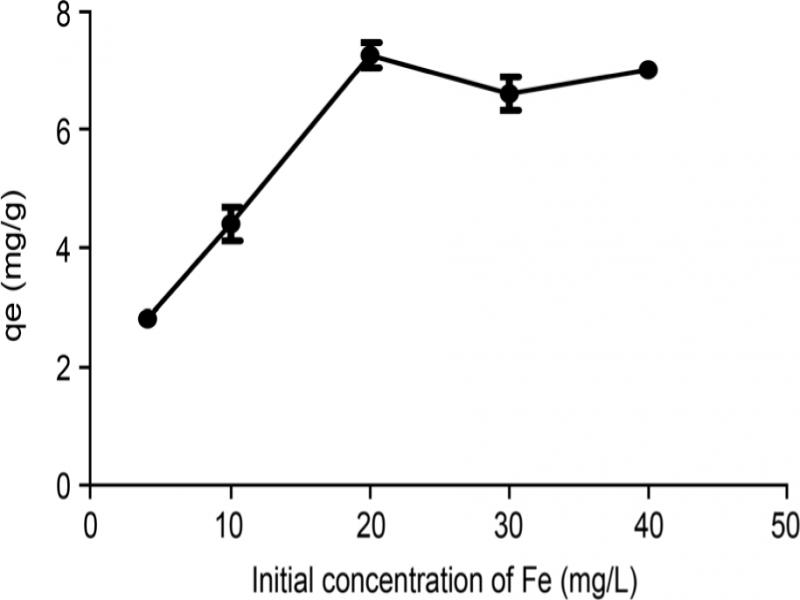
Fig. 1.
Effect of initial concentration on biosorption of Fe (II) by Bacillus subtilis at a biomass concentration of 1 g/l, pH 4.5, and 100 rpm.
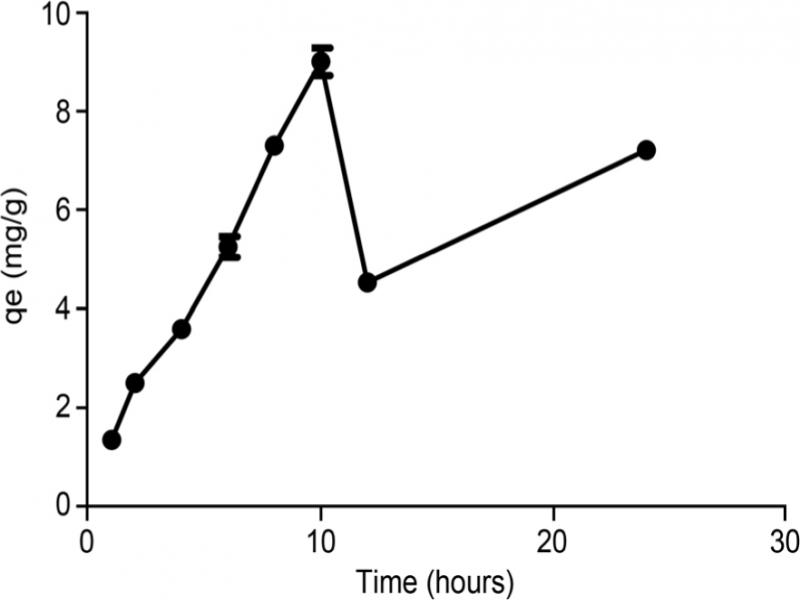
Fig. 2.
Effect of contact time on biosorption Fe (II) by Bacillus subtilis at a biomass concentration of 1 g/l, pH 4.5, 20 mg/l of Fe (II) and 100 rpm.
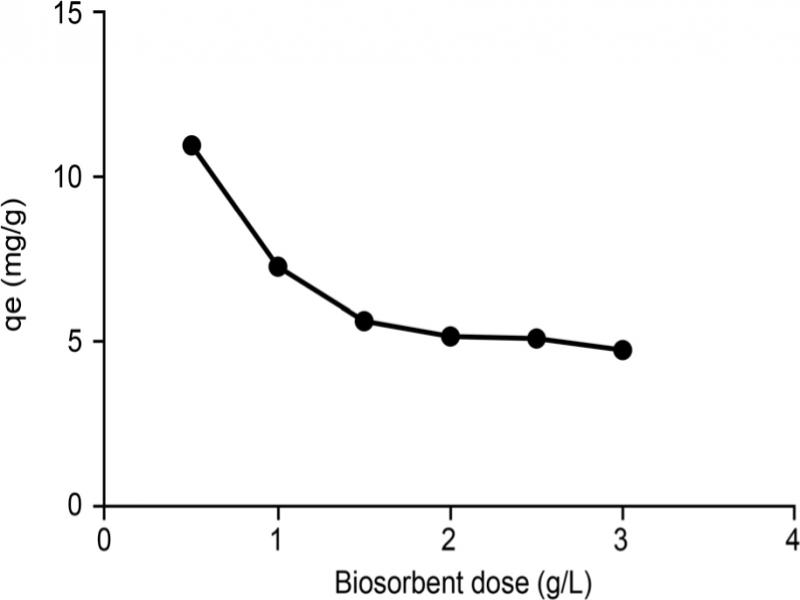
Fig. 3.
Effect of biosorbent dose on biosorption Fe (II) by Bacillus subtilis at initial metal ion concentration of 20 mg/l, pH 4.5, and 100 rpm.
Table I
Constants of Langmuir, Freundlich and Temkin isotherm models used for the biosorption of Fe (II) ions onto B. subtilis biomass.
| Langmuir isotherm | Freundlich isotherm | Temkin isotherm | |||
|---|---|---|---|---|---|
| qmax (mg/g) | 3.831 | n | 3.425 | B (J/mol) | 1.3583 |
| KL (l/mg) | 1.845 | KF (mg/g) | 2.766 | A (l/g) | 6.78 g/l |
| R2 | 0.9353 | R2 | 0.9057 | R2 | 0.8715 |
| RL | 0.013 | ||||
Table II
Constants of pseudo-first and pseudo-second-order kinetic models obtained for the biosorption of Fe (II) ions onto B. subtilis.
| Pseudo-first-order kinetic model | Pseudo-second-order kinetic model | ||||
|---|---|---|---|---|---|
| qe (mg/g), | K1 (min–1) | R2 | qe (mg/g) | K2 (gmg–1 min–1) | R2 |
| 10.6 | 0.2001 | 0.9201 | 17.76 | 0.0042 | 0.7154 |
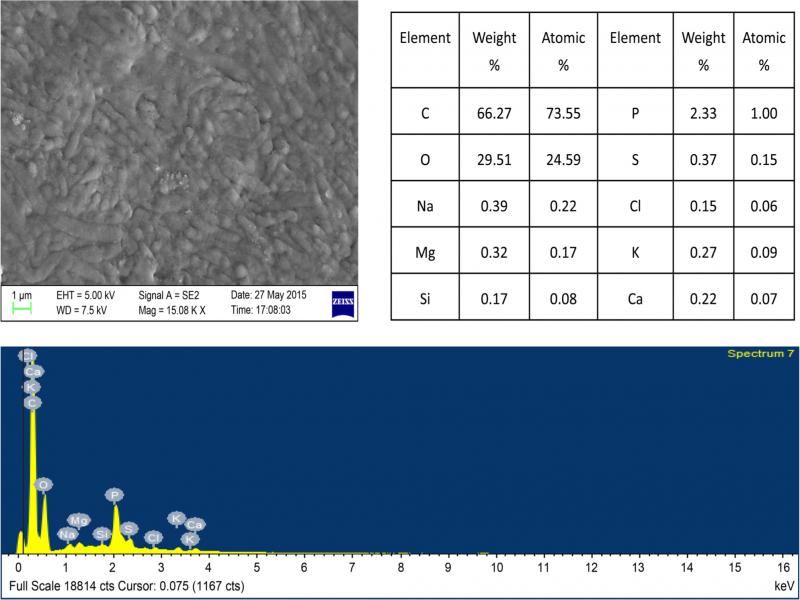
Fig. 4.
SEM image, EDX spectra and elemental composition of unloaded (control) biomass of B. subtilis.
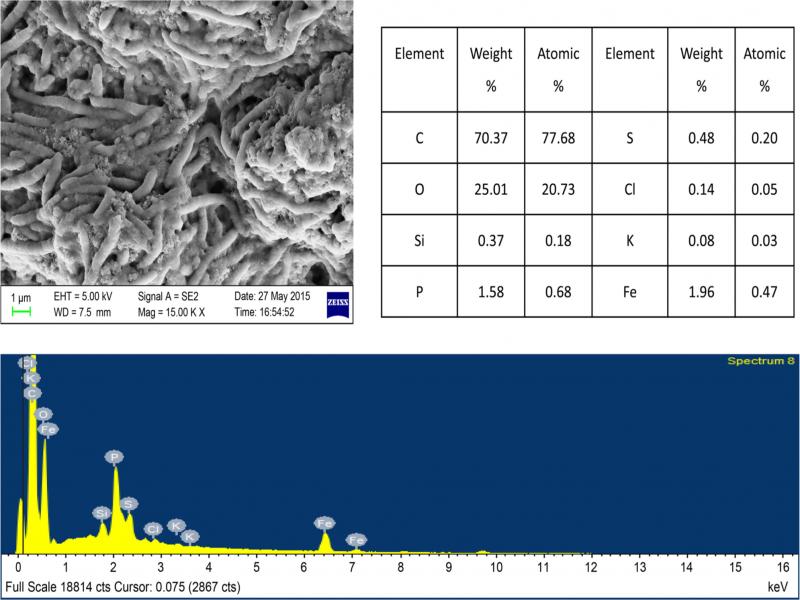
Fig. 5.
SEM image, EDX spectra and elemental composition of B. subtilis biosorbed with Fe (II) ions.
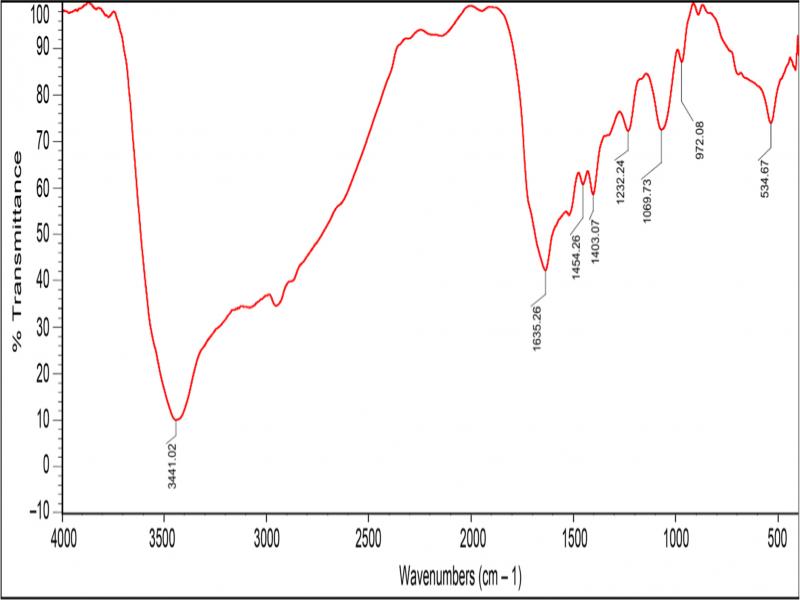
Fig. 6a.
FTIR spectra of unloaded (control) biomass of B. subtilis.
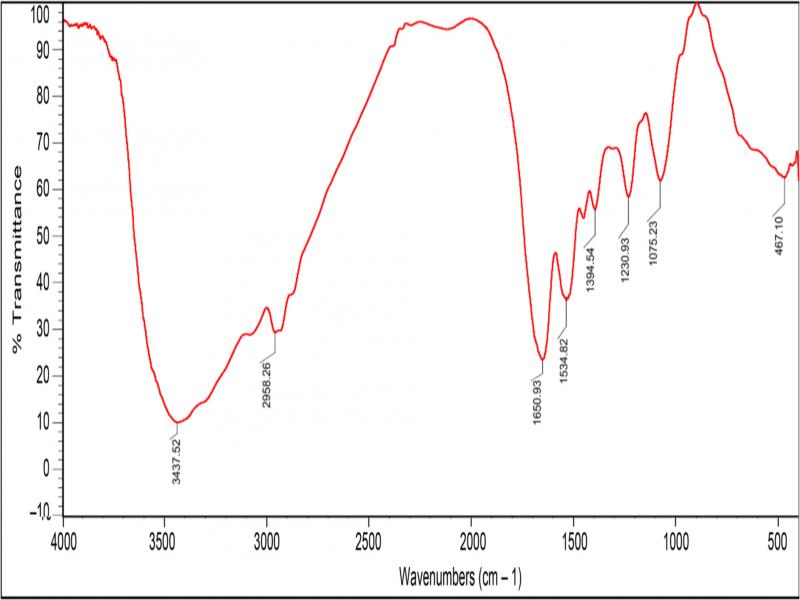
Fig. 6b.
FTIR spectra of Fe (II) ion biosorbed by B. subtilis biomass.
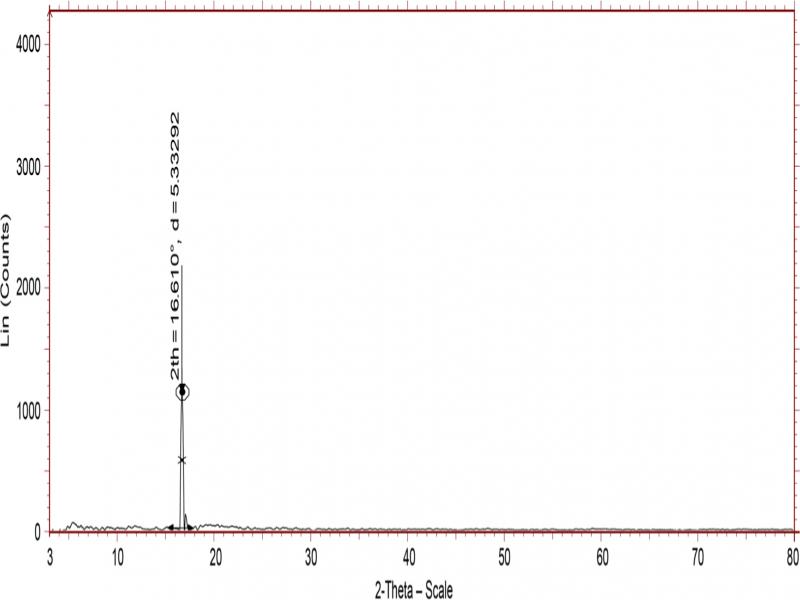
Fig. 7a.
X-ray diffraction pattern of B. subtilis before biosorption with Fe (II) ions.
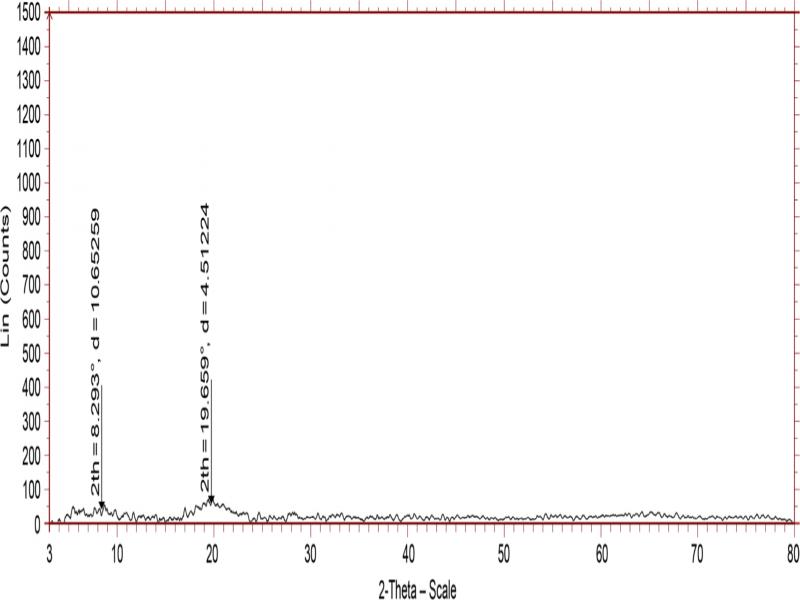
Fig. 7b.
X-ray diffraction pattern of B. subtilis after biosorption with Fe (II) ions.
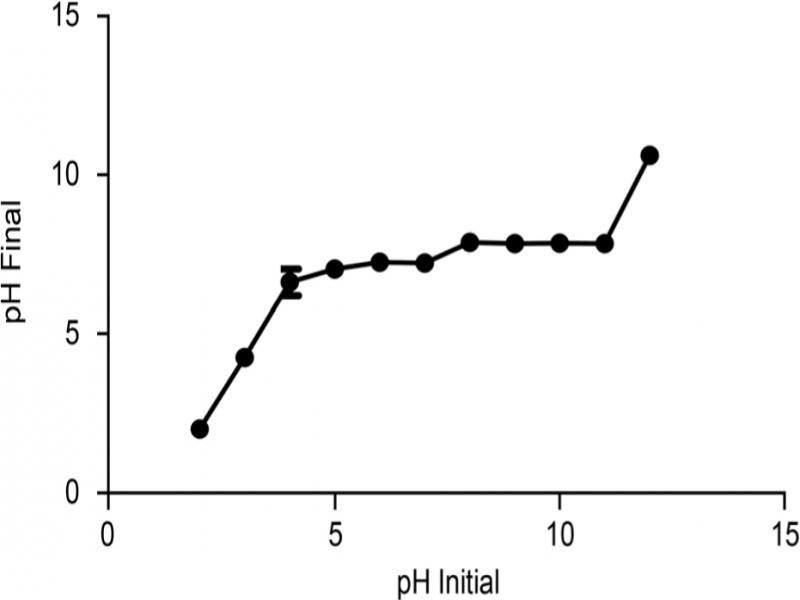
Fig. 8.
Point zero charge (pHpzc) of B. subtilis.