
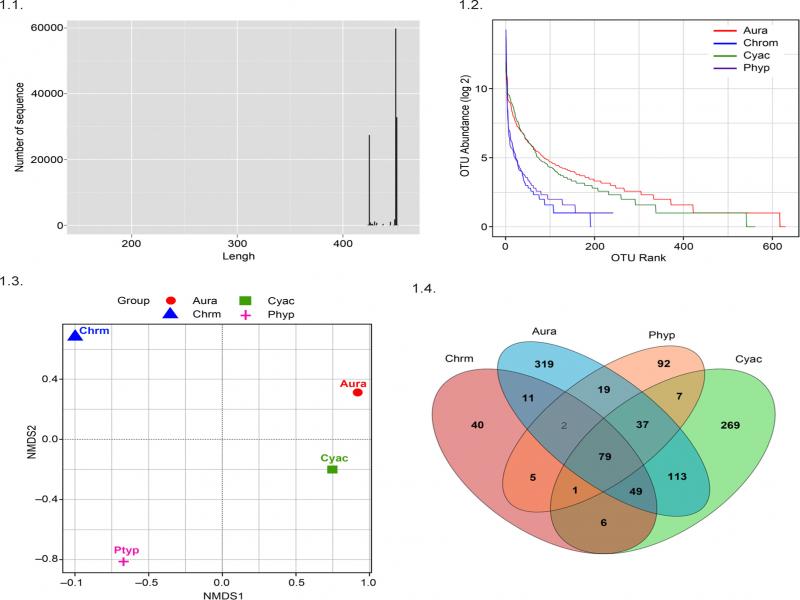
Fig. 1.
Diversity of the bacterial communities of the four jellyfish species at OTU level. 1.1. Sequence length distribution of bacteria in the four jellyfish. 1.2. Rank abundance curve of the four jellyfish species. 1.3. Unweighted UniFrac NMDS plot of the bacterial communities associated with the four jellyfish species. 1.4. Venn diagram representing the shared operational taxonomic units (OTUs) among jellyfish species. Chrm, C. melanaster; Aura, A. coerulea; Phyp, P. punctata; Cyac, C. capillata.
Table I
Summary of α-diversity indices of the bacterial communities in the four jellyfish species.
| Species | Chao1 | ACE | Simpson | Shannon |
|---|---|---|---|---|
| Phyp | 242 | 242 | 0.5 | 2.01 |
| Cyac | 561.93 | 570.29 | 0.96 | 5.96 |
| Chrm | 193.04 | 194.13 | 0.39 | 1.73 |
| Aura | 629.4 | 634.45 | 0.95 | 6.14 |
Table II
Core microbiotas (OTU intersection) of the four jellyfsh species.
| Phylum | Class | Order | Family | Genus | Matched OTUs |
|---|---|---|---|---|---|
| Firmicutes | Bacilli | Bacillales | Staphylococcaceae | Staphylococcus | 1528 |
| Bacillaceae | Bacillus | 1198, 1208 | |||
| Unclassified_Bacillaceae | 238, 3199 | ||||
| Geobacillus | 1362 | ||||
| Lactobacillales | Streptococcaceae | Lactococcus | 1589, 2873 | ||
| Carnobacteriaceae | Carnobacterium | 1719 | |||
| Proteobacteria | Alphaproteobacteria | Rhizobiales | Brucellaceae | Ochrobactrum | 1108 |
| Methylobacteriaceae | Methylobacterium | 3041 | |||
| Methylobacteriaceae | Unclassified_Methylobacteriaceae | 2810 | |||
| Phyllobacteriaceae | Aminobacter | 2641 | |||
| Sphingomonadaceae | Sphingomonas | 2987, 3014 | |||
| Sphingomonadales | Sphingomonadaceae | Unclassified_Sphingomonadaceae | 2284 | ||
| Betaproteobacteria | Burkholderiales | Comamonadaceae | Unclassified_Comamonadaceae | 861 | |
| Oxalobacteraceae | Cupriavidus | 366 | |||
| Unclassified_Burkholderiales | Unclassified_Burkholderiales | 476 | |||
| Gammaproteobacteria | Pseudomonadales | Moraxellaceae | Unclassified_ Moraxellaceae | 2146, 1618, 2256, 1522, 2988, 303, 2486, 303, 141, 2317, 929, 3334, 75, 1212, 2345, 1235, 3227, 1057, 2091, 3331, 3766, 2425, 2535, 389, 3630, 3372, 3440, 565, 1954, 1508, 3325, 872, 268, 1805, 2942 | |
| Pseudomonadaceae | Pseudomonas | 1241, 3991, 3058, 2494, 1363, 2255, 1633, 2730, 1743, 306, 1348, 2740, 899, 3160, 909, 3051, 3320 | |||
| Pseudomonadaceae | Unclassified_Pseudomonadaceae | 692 | |||
| Xanthomonadales | Xanthomonadaceae | Unclassified_Xanthomonadaceae | 3013 | ||
| Vibrionales | Vibrionaceae | Vibrio | 2553 | ||
| Actinobacteria | Actinobacteria | Actinomycetales | Pseudonocardiaceae | Amycolatopsis | 2507 |
| [Termi] | Deinococci | Thermales | Thermaceae | Thermus | 3649 |
| Bacteroidetes | [Saprospirae] | [Saprospirales] | Chitinophagaceae | Sediminibacterium | 3146, 1112 |
| Planctomycetes | Phycisphaerae | Phycisphaerales | Unclassified_ Phycisphaerales | Unclassified_ Phycisphaerales | 3775 |
Table III
A classification table of the OTUs and bacteria of the four jellyfish at diferent levels.
| Te jellyfish species | Phylum | Class | Order | Family | Genus | |
|---|---|---|---|---|---|---|
| Bacteria (OTUs) | Phyp | 10 (234) | 16 (234) | 26 (228) | 40 (218) | 36 (98) |
| Cyac | 22 (558) | 39 (556) | 52 (534) | 77 (424) | 74 (226) | |
| Chrm | 12 (189) | 17 (188) | 26 (181) | 33 (171) | 25 (81) | |
| Aura | 18 (628) | 37 (622) | 56 (606) | 95 (555) | 120 (308) |
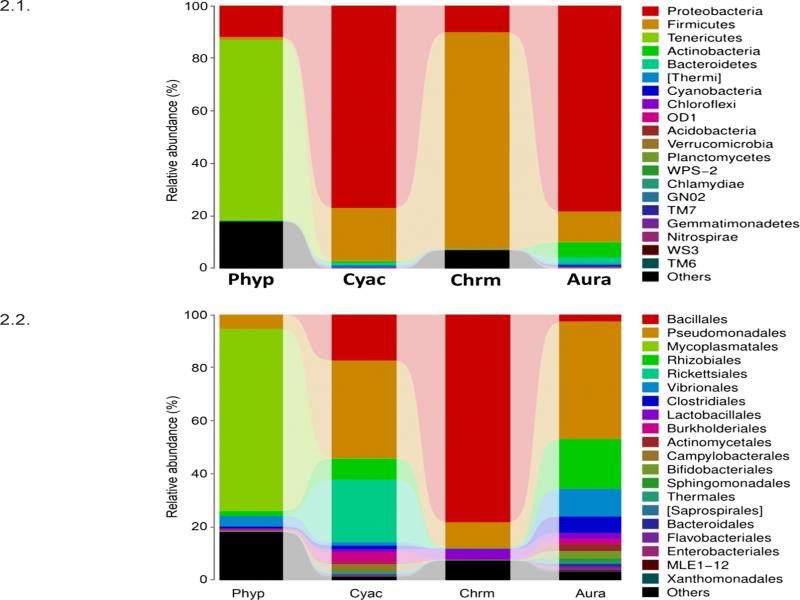
Fig. 2.
Comparative analysis of the composition of the bacterial communities in the four jellyfish species across different classification levels. 2.1. Relative abundances of the representative phyla. 2.2. Relative abundances of the representative classes
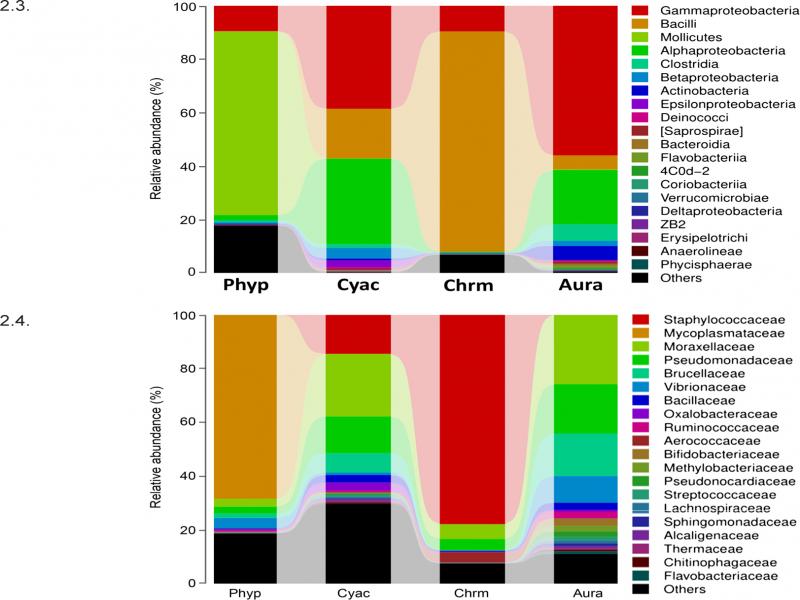
Fig. 2.
Comparative analysis of the composition of the bacterial communities in the four jellyfish species across different classification levels. 2.3. Relative abundances of the representative order. 2.4. Relative abundances of the representative families.
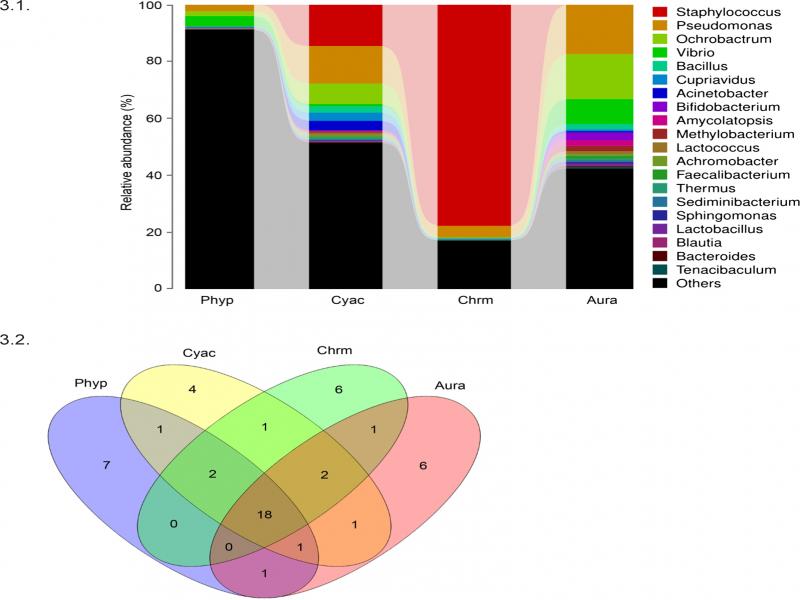
Fig. 3.
Analysis of the differences in the composition of the bacterial communities associated with the four jellyfish species across the genus levels. 3.1. Relative abundances of the representative genus found in the four jellyfish species. 3.2. The Venn diagram representing the shared top 30 genera of the bacterial communities in the jellyfish species.
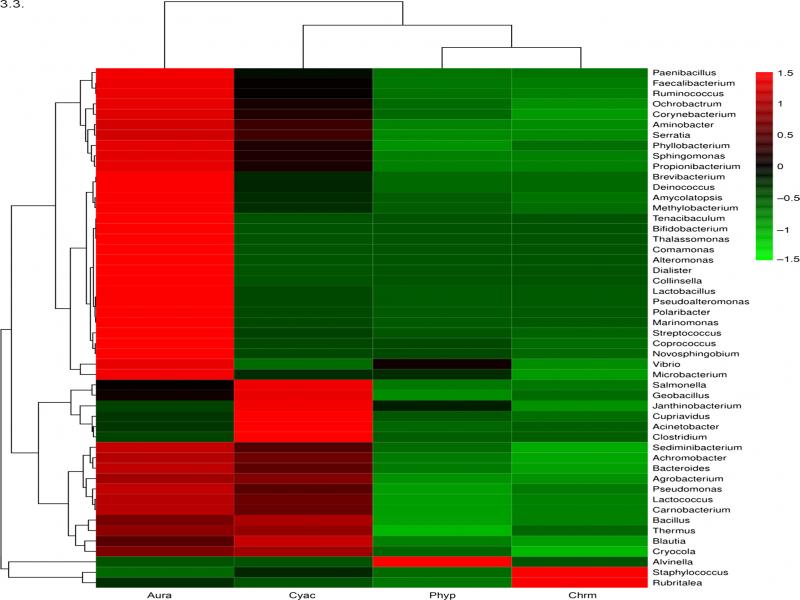
Fig. 3.
Analysis of the differences in the composition of the bacterial communities associated with the four jellyfish species across the genus levels. 3.3. Heat map of the top 50 genera of the bacterial communities in the four species of jellyfish. Red represents the genera with high abundance in the corresponding jellyfish species, while green represents genera with low abundance. “Others” indicates the other bacterial genera in each jellyfish species except the top 20 genera with the highest abundance. Chrm, C. melanaster; Aura, A. coerulea; Phyp, P. punctata; Cyac, C. capillata.
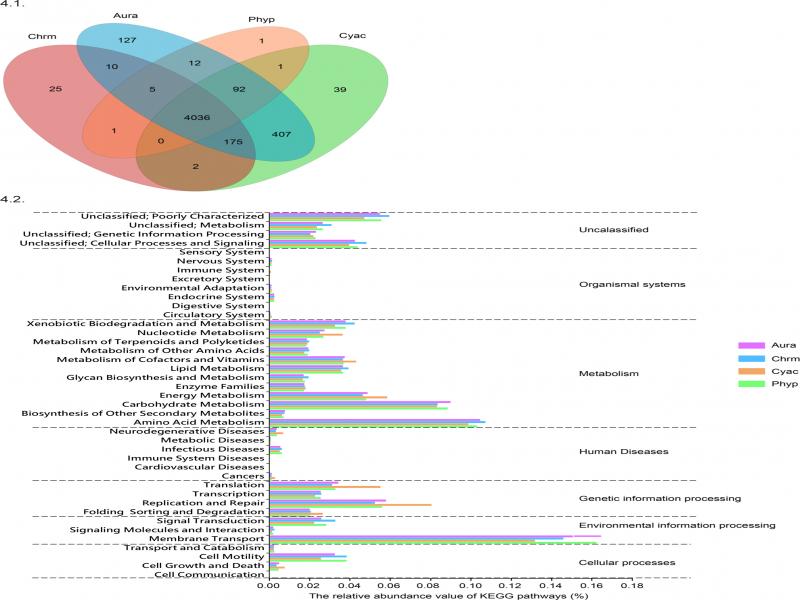
Fig. 4.
The function prediction and KEGG pathway analysis of bacteria in four jellyfish species. 4.1. The Venn diagram analysis of common bacterial functional groups in the four jellyfish species. 4.2. The relative abundance of each predicted functional category given in the KEGG pathways (level 2).