
Table I
Characteristics of S. Typhimurium, S. Enteritidis, and S. Choleraesuis strains.
| Serovars | Strains | Characteristics of virulence plasmid |
|---|---|---|
| S. Typhimurium | OU5045 | With a 90-kb pSTV as a wild type |
| OU5046 | Without pSTV from wild type | |
| S. Enteritidis | OU7130 | With a 60-kb pSEV as a wild type |
| OU7067 | Without pSEV from wild type | |
| S. Choleraesuis | OU7085 | With a 50-kb pSCV as a wild type |
| OU7266 | Without pSCV from wild type |
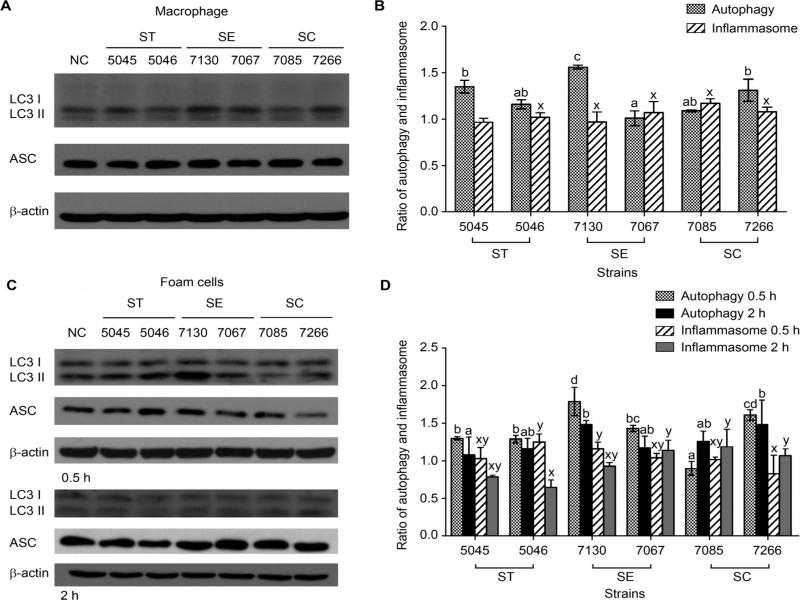
Fig. 1.
Autophagy and inflammasome induced by Salmonella infection.
(A, C) Western blotting was performed with anti-LC3-I/II and anti-ASC antibodies. β-Actin Western blots were used as loading controls. LC3 was identified as a double band (i.e., LC3-I and LC3-II). (A) THP-1 macrophages and (C) THP-1 macrophage-derived foam cells were infected by different serotypes of Salmonella with or without virulence plasmid for 0.5 and 2 h. Uninfected macrophages and foam cells were the negative controls. (B, D) The LC3 I/II and ASC bands were quantified, and the ratios of autophagy and inflammasome were calculated from the ratios of infected to uninfected LC3-II/I cells and of infected to uninfected ASC, respectively. All values are represented as means ± standard error (n = 3). a–e indicate significant differences of autophagy formation between strains in the 0.5 and 2 h post-infection (p < 0.05); x, y, z indicate significant differences of inflammasome formation between strains in the 0.5 and 2 h post-infection. (p < 0.05). nc: uninfected cells.
Table II
CD36 expression based on fluorescence density and gate (%) on foam cell interaction among different Salmonella serotypes.
| Sample | %Parent | Mean |
|---|---|---|
| Foam NC | 4.5 | 2 594 |
| Foam NC-CD36 FITC | 5.4 | 8 796 |
| Foam 5045-CD36 FITC | 5.2 | 7 204 |
| Foam 5046-CD36 FITC | 7.7 | 11 194 |
| Foam 7130-CD36 FITC | 1.8 | 4 807 |
| Foam 7067-CD36 FITC | 6.3 | 3 204 |
| Foam 7085-CD36 FITC | 7.2 | 5 341 |
| Foam 7266-CD36 FITC | 9.6 | 11 067 |
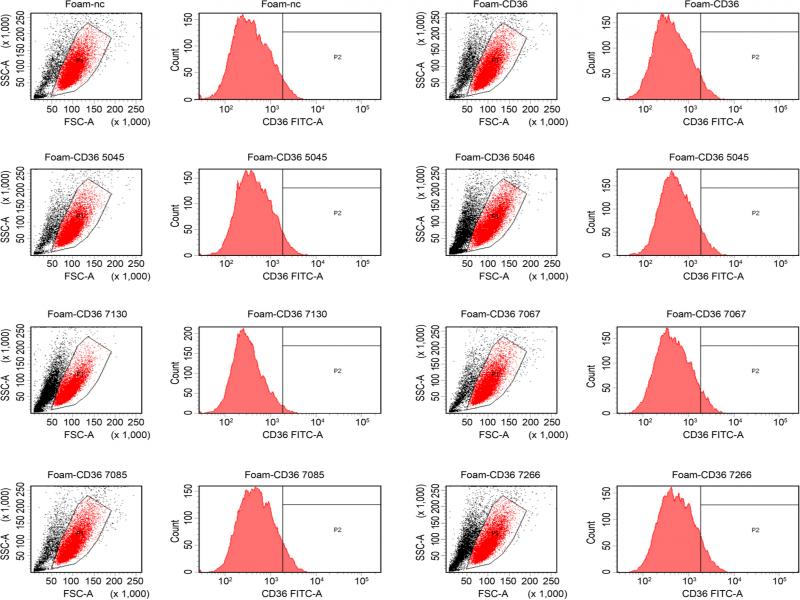
Fig. 2.
CD36 expression in THP-1 macrophage-derived foam cells after different serotypes Salmonella infection. After treated with ox-LDL, THP-1 macrophage-derived foam cells were infected with plasmid-bearing and -less S. Typhimurium, Enteritidis, and Cholerae suis, respectively. CD36 expression was analyzed through flow cytometry.
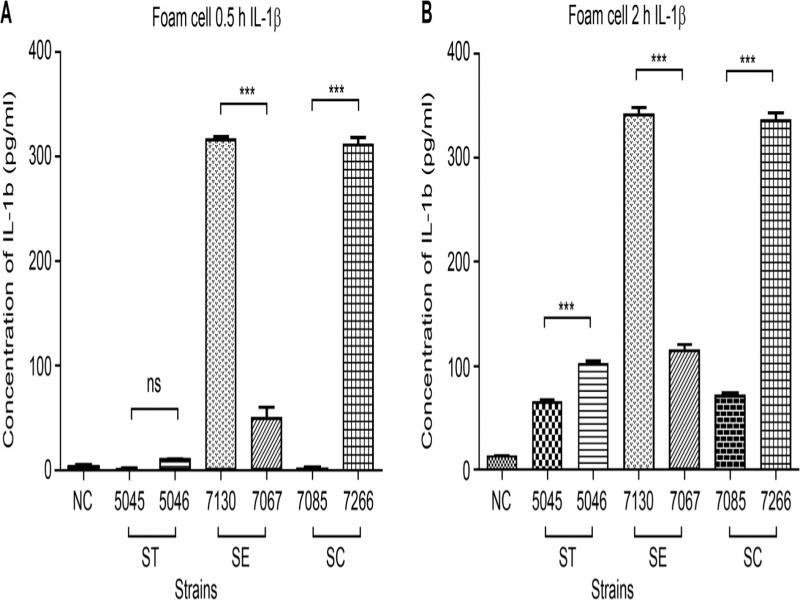
Fig. 3.
IL-1β production by THP-1 macrophage-derived foam cells after Salmonella infection.
ELISA was performed for IL-1β produced after infection by different Salmonella serotypes. Foam cells were infected by plasmid-bearing S. Typhimurium OU5045, plasmid-less S. Typhimurium OU5046, plasmid-bearing S. Enteriditis OU7130, plasmid-less S. Enteriditis OU7067, and plasmid-bearing S. Choleraesuis OU7085 and plasmid-less S. Choleraesuis OU7266 for 0.5 and 2 h, and the supernatants were harvested and used for experiments. The experiments were performed in triplicate and presented as mean ± SD. (***p < 0.005, one-way ANOVA). NC: uninfected cells; ST: S. Typhimurium; SE: S. Enteritidis; SC: S. Choleraesuis.
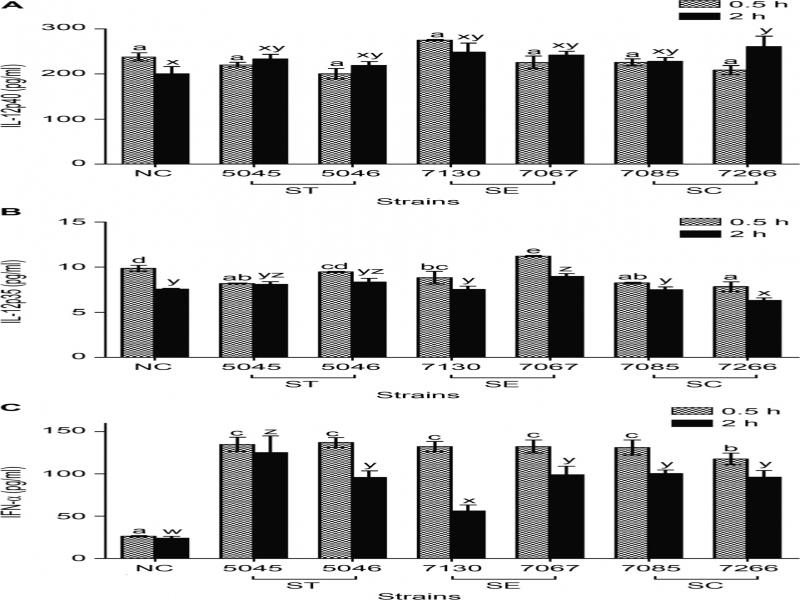
Fig. 4.
Cytokines expression in response to Salmonella infection.
ELISA for (A) interleukin (IL)-12p40, (B) IL-12p35, and (C) IFN-α produced after infection by different Salmonella serotypes. THP-1 macrophage-derived foam cells were infected by Salmonella with or without virulence plasmids for 0.5 and 2 h, and the supernatants were harvested and used for experiments. All values are presented as means ± standard error (n = 3). a-e indicate significant differences between strains 0.5 h after infection (p < 0.05); w-z indicate significant differences between strains 2 h after infection (p < 0.05). nc: uninfected cells.