
Table I
External symptoms of vibriosis and the site of isolation of pathogen from infected shrimp collected from the shrimp farms.
| Sample No. | Symptoms | Site of isolation |
|---|---|---|
| 01–04 | Deformed and yellowish colored hepatopancreas | Hepatopancreas |
| 05–06 | Blackish colored hepatopancreas | Hepatopancreas |
| 07–11 | Discolored hepatopancreas | Hepatopancreas |
| 12–13 | Yellowish colored hepatopancreas | Hepatopancreas |
| 14–15 | No visible symptom | Hepatopancreas |
Table II
Medicinal herbs used for in vitro antibacterial assay against V. alginolyticus isolates.
| Sl. No. | English name | Scientific name | Plant parts used |
|---|---|---|---|
| 1 | Zinger | Zingiber officinale | Rhizome |
| 2 | Turmeric | Curcuma longa | Rhizome |
| 3 | Clove | Syzygium aromaticum | Bud |
| 4 | Garlic | Allium sativum | Bulb |
| 5 | Onion | Allium cepa | Bulb |
| 6 | Black cumin | Nigella sativa | Seed |
| 7 | Mehogoni | Swietenia mahagoni | Seed |
| 8 | Bottle gourd | Laganaria siceraria | Seed, Fruit |
| 9 | Guava | Psidium guajava | Fruit |
| 10 | Olive | Olea europaea | Fruit |
| 11 | Chilli | Capsicum pendulum | Fruit |
| 12 | Rose periwinkle | Catharanthus roseus | Leaf and flower |
| 13 | Amla | Emblica officinalis | Leaf |
| 14 | Tamarind | Tamarindus indica | Leaf |
| 15 | Arjun | Terminalia arjuna | Leaf |
| 16 | Papaya | Carica papaya | Leaf |
| 17 | Carunda | Carissa carandas | Leaf |
| 18 | Bermuda grass | Cynodon dactylon | Leaf |
| 19 | Neem | Azadiracha indica | Leaf |
| 20 | Pomegranate | Punica granatum | Leaf |
| 21 | Carambola | Averrhoa carambola | Leaf |
Table III
Colony, morphological, and biochemical characteristics of Vibrio sp. isolates.
| Test Type | Test | Characteristics |
|---|---|---|
| Colony characteristics | Color in NA media | Brownish |
| Color in TCBS media | Yellowish | |
| Size | Large | |
| Shape | Round | |
| Elevation | Convex | |
| Morphological characteristics | Shape | Comma |
| Motility | + | |
| Growth in 0% NaCl | – | |
| Growth in 2,4 and 8% NaCl containing media | + | |
| Growth at 4°C | – | |
| Growth at 40°C | + | |
| Biochemical characteristics | Gram’s staining | – |
| Oxidative-Fermentative | F | |
| Oxidase | + | |
| Catalase | + | |
| Acetoin production | – | |
| H2S production | – | |
| Indole | + | |
| Sensitivity to a vibriostatic agent 0/129 | + | |
| Arginine dihydrolase | – | |
| Lysine decarboxylase | + | |
| Acid production from | Glucose | + |
| Arabinose | – | |
| Manitol | + | |
| Sorbitol | + | |
| Sucrose | + |
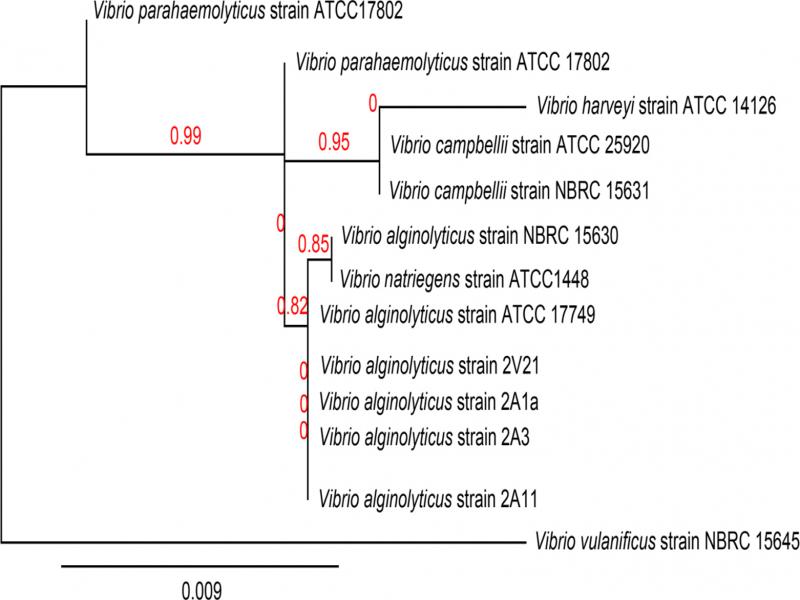
Fig. 1.
Unrooted phylogenetic tree showing evolutionary relationship of V. alginolyticus isolates with other maximum identical related species on the basis of 16S rRNA gene sequences evolutionary distance.
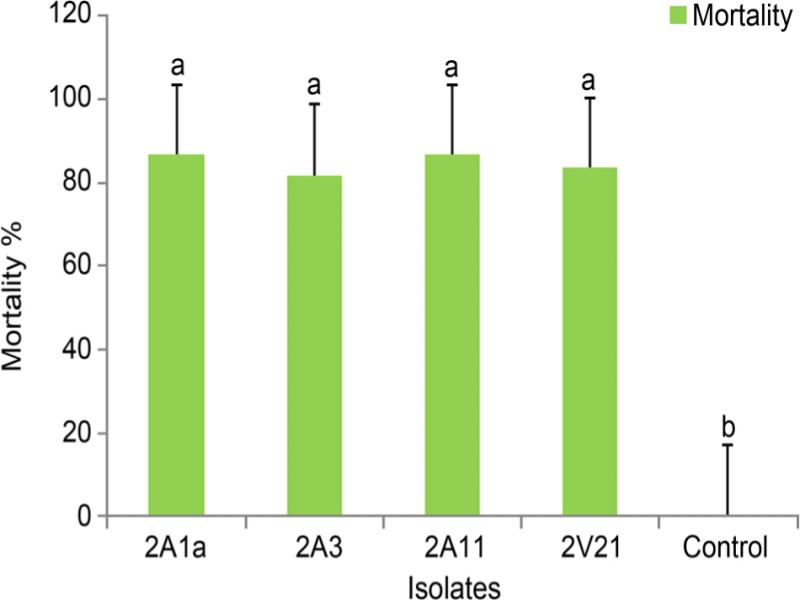
Fig. 2.
Mortality of juvenile shrimp exposed to V. alginolyticus isolates in laboratory conditions. One way ANOVA was performed at ≤ 0.05 level of significance. Same letters indicate there is no significant variations in mortality of shrimp in different groups challenged with different isolates of V. alginolyticus.
Table IV
Iv vitro antibiogram profiles of the V. alginolyticus isolates. Eleven commercial antibiotic discs were used.
| Isolates | Inhibition zone ratio against different antibiotics | ||||||||||
|---|---|---|---|---|---|---|---|---|---|---|---|
| Er | Pe | Am | Va | Amp | Le | Cx | Az | Ni | Ce | Ge | |
| 2A1a | R | R | R | R | R | 7.3 ± 0.2 | 4.6 ± 0.3 | 3.8 ± 0.3 | 6.8 ± 0.1 | R | 6 ± 0.2 |
| 2A3 | R | R | R | R | R | 7.3 ± 0.3 | 3.7 ± 0.2 | 3.3 ± 0.1 | 7 ± 0.1 | R | 5.7 ± 0.1 |
| 2A11 | R | R | R | R | R | 7.2 ± 0.1 | 4.8 ± 0.6 | 3.7 ± 0.6 | 6.5 ± 0.5 | R | 5.8 ± 0.1 |
| 2V21 | R | R | R | R | R | 7.0 ± 0.1 | 4.2 ± 0.2 | 3.3 ± 0.2 | 7.0 ± 0.2 | R | 5.7 ± 0.3 |
1 Note: Er = Erythromycin (15 μg/disc), Pe = Penicillin (10 μg/disc), Am = Amoxycillin (30 μg/disc), Va = Vancomycin (30 μg/disc), Amp = Ampicillin (25 μg/disc), Le = Levoflaxin (5 μg/disc), Cx = Cefuroxime (30 μg/disc), Az = Azithromycin (30 μg/disc), Ni = Nitrofurantoin (30 μg/disc), Ce = Cefradine (25 μg/disc), Ge = Gentamicin (10 μg/disc), R = Resistant.
Table V
An in vitro inhibitory activity of herbal extracts on shrimp pathogenic V. alginolyticus isolates.
| Plants | Type of extracts | Inhibition zone ratio of herbal extracts for V. alginolyticus isolates | |||
|---|---|---|---|---|---|
| 2A1a | 2A3 | 2A11 | 2V21 | ||
| E. officinalis | Aqueous extract | 5.33 ± 0.64 | 4.17 ± 0.38 | 4.67 ± 0.12 | 4.10 ± 0.44 |
| n-Hexane extract | – | – | – | – | |
| EtOAc extract | 6.1 ± 0.19 | 5.6 ± 0.20 | 5.0 ± 0.23 | 6.1 ± 0.07 | |
| MeOH extract | – | – | – | – | |
| Acetone extract | – | – | – | – | |
| A. sativum | Aqueous extract | 4.00 ± 0.46 | 4.10 ± 0.10 | 4.60 ± 0.53 | 3.80 ± 0.66 |
| n-Hexane extract | 1.9 ± 0.06 | 1.8 ± 0.15 | 1.6 ± 0.05 | 1.8 ± 0.17 | |
| EtOAc extract | 4.1 ± 0.11 | 4.3 ± 0.03 | 3.3 ± 0.05 | 3.8 ± 0.25 | |
| MeOH extract | 2.5 ± 0.06 | 2.1 ± 0.25 | 2.4 ± 0.11 | 1.9 ± 0.15 | |
| Acetone extract | 1.5 ± 0.25 | 1.4 ± 0.15 | 1.4 ± 0.36 | 1.5 ± 0.06 | |
| S. aromaticum | Aqueous extract | 3.93 ± 0.15 | 3.47 ± 0.55 | 3.93 ± 0.21 | 3.50 ± 0.53 |
| n-Hexane extract | 3.5 ± 0.04 | 3.6 ± 0.24 | 3.6 ± 0.13 | 3.8 ± 0.14 | |
| EtOAc extract | – | – | – | – | |
| MeOH extract | 4.9 ± 0.21 | 4.6 ± .17 | 4.0 ± 0.06 | 4.4 ± 0.08 | |
| Acetone extract | 4.3 ± 0.12 | 4.4 ± 0.06 | 4.0 ± 0.15 | 4.1 ± 0.22 | |
| T. indica | Aqueous extract | 1.17 ± 0.40 | 0.97 ± 0.21 | 1.20 ± 0.36 | 0.93 ± 0.15 |
| n-Hexane extract | 1.9 ± 0.09 | 1.8 ± 0.06 | 1.5 ± 0.09 | 1.8 ± 0.21 | |
| EtOAc extract | 1.8 ± 0.14 | 1.9 ± 0.21 | 1.9 ± 0.06 | 1.5 ± 0.08 | |
| MeOH extract | 1.5 ± .22 | 1.5 ± .19 | 1.4 ± 0.08 | 1.4 ± 0.11 | |
| Acetone extract | 2.3 ± 0.12 | 1.8 ± 0.11 | 1.5 ± 0.13 | 1.8 ± 0.05 | |
1 Note: Eight millimeter diameter filter paper discs were soaked with 30 microliter of aqueous, n-hexane, ethyl acetate (EtOAc), methanol (MeOH) and acetone extracts (25 mg/ml) of E. ofiicinalis, A. sativum, S. aromaticum, and T. indica and then allowed to dry in a laminar airflow cabinet before placing them to the NBA petri dish inoculated with respective isolates of the pathogen. Each treatment was replicated for three times. Data presented here is the mean ± SE.
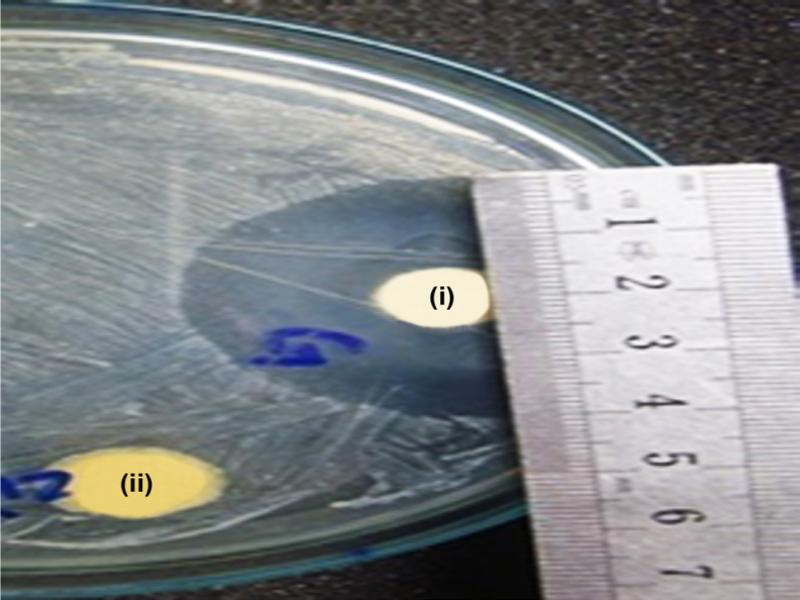
Fig. 3.
An in vitro antibacterial activity of disc containing organic solvent extracts of herbs. (i) EtOAc extract of A. sativum, and (ii) control (no plant extract).
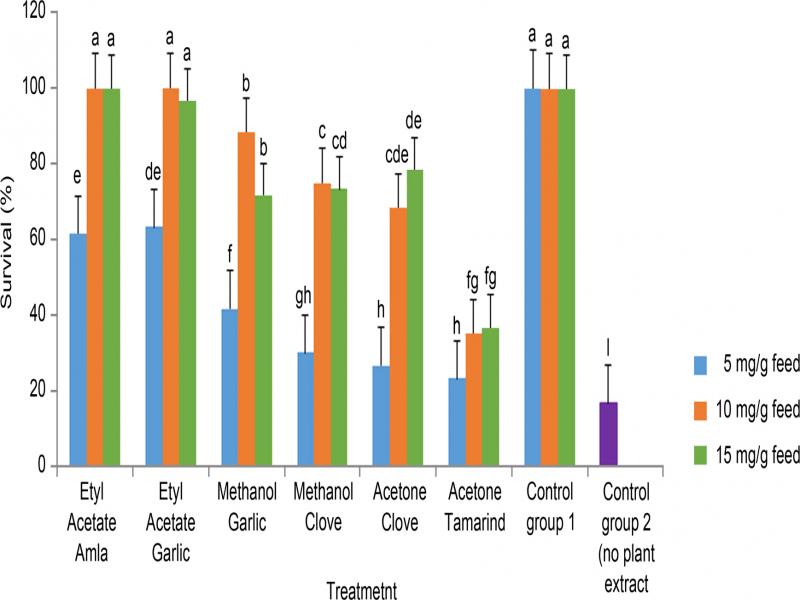
Fig. 4.
Survival rate of shrimps fed with herbal extracts at day 7 after infection with a virulent strain of V. alginolyticus 2A1a. One way ANOVA was used for analysis of the data and mean value with standard deviation in the bar followed by the same letter (s) are not significantly different as assessed by LSD (Least Significance Difference) at p ≤ 0.05. Control group-1 was not exposed to the pathogen; Control group-2 was infected with the pathogen but fed normal commercial feed.