
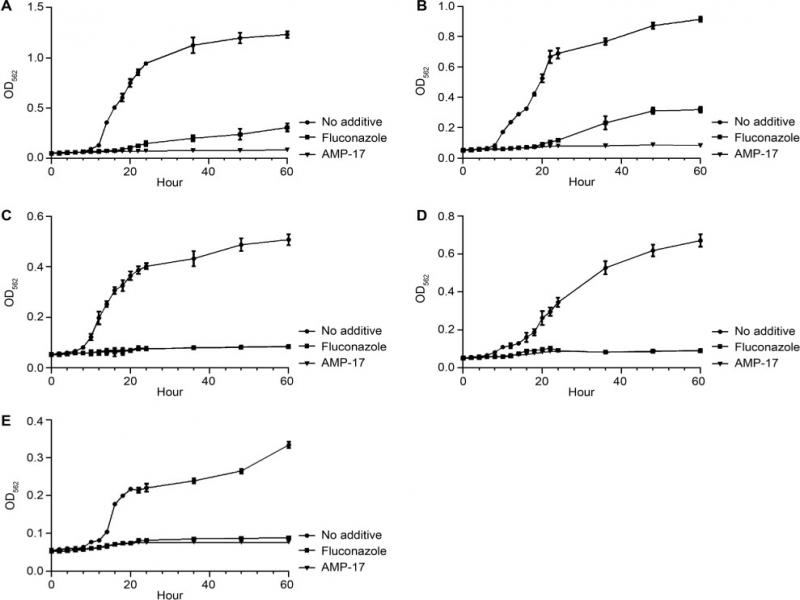
Fig. 1.
Time- kill curves of the AMP-17 against the fungal species tested. The growth of five fungi was monitored in the presence of 100 μg/ml AMP-17. Growth of C. albicans (A), C. tropicalis (B), C. krusei (C), C. parapsilosis (D), and C. neoformans with AMP-17 were monitored by reading the optical density (OD562) of the cultures. 100-μg/ml fluconazole was used as a positive control for fungi. Sabouraud’s dextrose broth (0 μg/ml AMP-17) was used as a negative control. The OD562 values of the remaining viable cells were monitored in 96-well plates at different times.
Table I
MIC values of AMP-17 against the fungi species tested.
| Peptide | MIC (μg/ml) | ||||
|---|---|---|---|---|---|
| C. albicans ATCC10231 | C. krusei IFM56881 | C. tropicalis IFM57016 | C. parapsilosis ATCC22019 | C. neoformans IFM51426 | |
| AMP-17 | 18.75 | 18.75 | 18.75 | 18.75 | 9.375 |
Table II
MFC values of AMP-17 against the fungi species tested.
| Peptide | MIC (μg/ml) | ||||
|---|---|---|---|---|---|
| C. albicans ATCC10231 | C. krusei IFM56881 | C. tropicalis IFM57016 | C. parapsilosis ATCC22019 | C. neoformans IFM51426 | |
| AMP-17 | 37.5 | 37.5 | 37.5 | 37.5 | 18.75 |
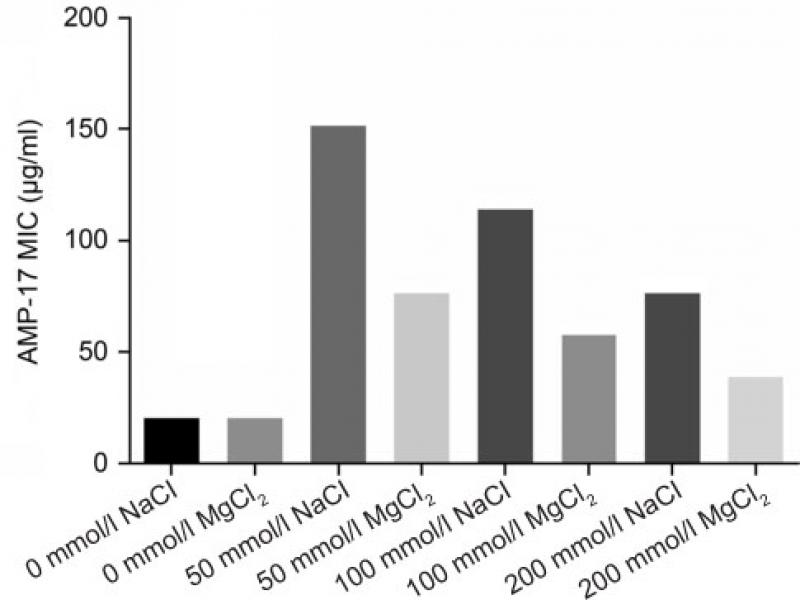
Fig. 2.
Influences of various NaCl or MgCl2 concentrations on the antifungal activity of AMP-17. The MIC value of AMP-17 against C. albicans was determined under the influence of different concentrations of NaCl or MgCl2 according to the conditions recommended by CLSI (2008).
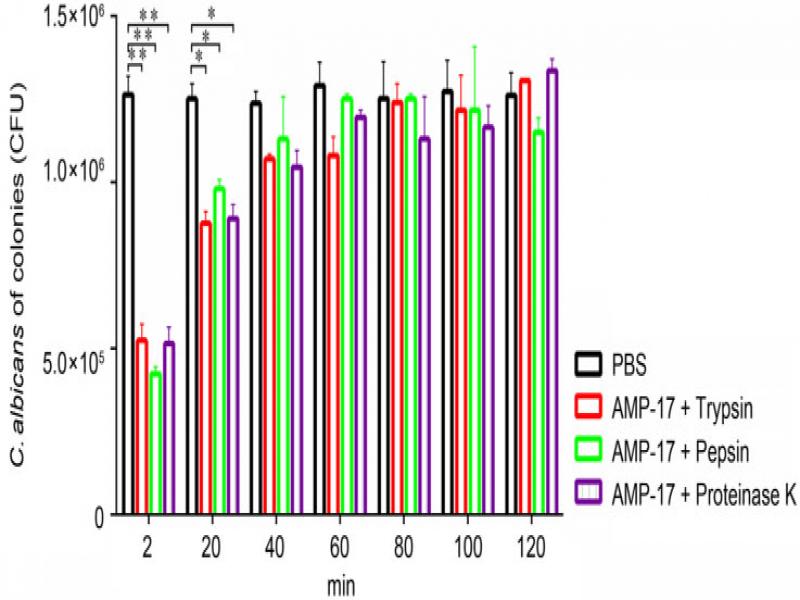
Fig. 3.
Influences of trypsin/pepsin/proteinase K on AMP-17 when used against C. albicans. Fifty μl of the proteases (at a concentration of 1 mg/ml) and 50 μl AMP-17 (at a concentration of 37.5 μg/ml) were mixed in a 96-well plate and placed in a 37°C water bath for 2, 20, 40, 60, 80, 100, and 120 min. Then, it was subjected to CFU enumeration after being treated with 100 μl of the fungal suspension for 18 hours. PBS was used as a negative control. Compared with PBS control, *P < 0.05; **P < 0.01.
Table III
Influences of temperature and the number of freeze-thaw times on the antifungal activity of AMP-17.
| Temperature (98°C) (min) | Colony count ( ± SD) | Temperature (−80°C) (Times) | Colony count ( ± SD) |
|---|---|---|---|
| 5 | 69.50 ± 4.95** | 1 | (240.50 ± 3.54**) × 102 |
| 20 | 6.00 ± 2.83** | 2 | (273.50±3.54**) × 102 |
| 30 | 4.50 ± 2.12** | 4 | (342.00 ± 8.49**) × 102 |
| 60 | 6.50 ± 0.71** | 6 | (357.00 ± 1.41**) × 102 |
| 90 | 9.50 ± 3.54** | 8 | (351.50 ± 6.36**) × 102 |
| 120 | 3.50 ± 0.71** | 10 | (370.50 ± 3.54**) × 102 |
| Negative control (ddH2O) | 565900.00 ± 17112.00 | Negative control (ddH2O) | (5507.00 ± 147.08) × 102 |
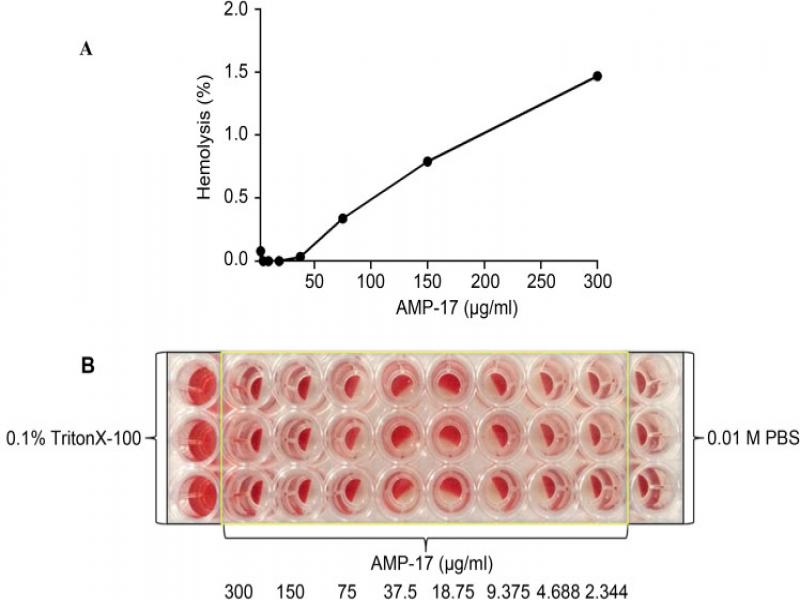
Fig. 4.
Hemolytic activities of AMP-17 in vitro. The diluted human red blood cells (100 μl) were incubated with AMP-17 at 37°C for 1 h and spun at 225×g for 10 minutes. The supernatants (100 μl) were transferred to a 96-well plate for measurement of the absorbance of the supernatants at 450 nm by the ultra-microplate spectrophotometer. 0.1% Triton-X 100 and 0.01M PBS were used as a positive control and a negative control, respectively. Fig. 4A is based on Fig. 4B calculated by the hemolysis rate formula. Fig. 4B was the original experimental diagram.