
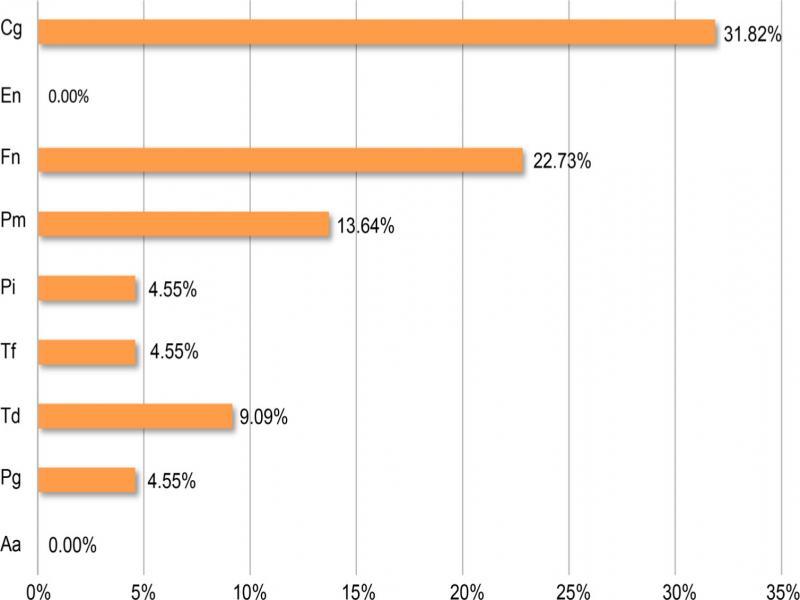
Fig. 1.
Clinical data of adult patients with cystic fibrosis that were colonised or not colonised by periopathogens_
| PLI | GI | PPD | TOTAL BACTERIA COUNT (CFU/ml) | |||||
|---|---|---|---|---|---|---|---|---|
| C | 1.76 ± 0.70 | p < 0.01 | 0.56 ± 0.36 | p < 0.05 | 1.33 ± 0.24 | p < 0.01 | 8.9 × 10⁶ ± 1.5 × 10⁷ | p > 0.05 |
| NC | 0.86 ± 0.28 | 0.21 ± 0.26 | 0.98 ± 0.12 | 1.8 × 10⁷ ± 5.3 × 10⁷ | ||||
| TOTAL | 1.31 ± 0.69 | 0.39 ± 0.36 | 1.16 ± 0.26 | 1.3 × 10⁷ ± 3.8 × 10⁷ | ||||
The number of bacteria isolated from gingival sulcus and the percentage of the species tested within the total bacterial count in samples_
| The periopathogens tested | Number of bacteria (CFU/ml) Mean ± SD | Percentage of the periopathogens tested within the total bacterial count (%) | |
|---|---|---|---|
| Aggregatibacter actinomycetemcomitans | 0.00 | 0.00 | |
| Red complex | Porphyromonas gingivalis | 2.0 × 10 ± 9.4 × 10 | 0.01 |
| Tannerella forsythia | 2.4 × 10 ± 1.1 × 10² | 0.01 | |
| Treponema denticola | 1.4 × 10² ± 6.3 × 10² | 0.01 | |
| Orange complex | Fusobacterium nucleatum | 7.3 × 10² ± 2.5 × 10³ | 0.93 |
| Prevotella intermedia | 8.2 × 10³ ± 3.9 × 10⁴ | 0.01 | |
| Peptostreptococcus micros | 1.7 × 10³ ± 8.2 × 10³ | 1.50 | |
| Eubacterium nodatum | 0.00 | 0.00 | |
| Green complex | Capnocytophaga gingivalis | 6.8 × 10⁴ ± 3.1 × 10⁵ | 3.51 |