
Fig. 1.
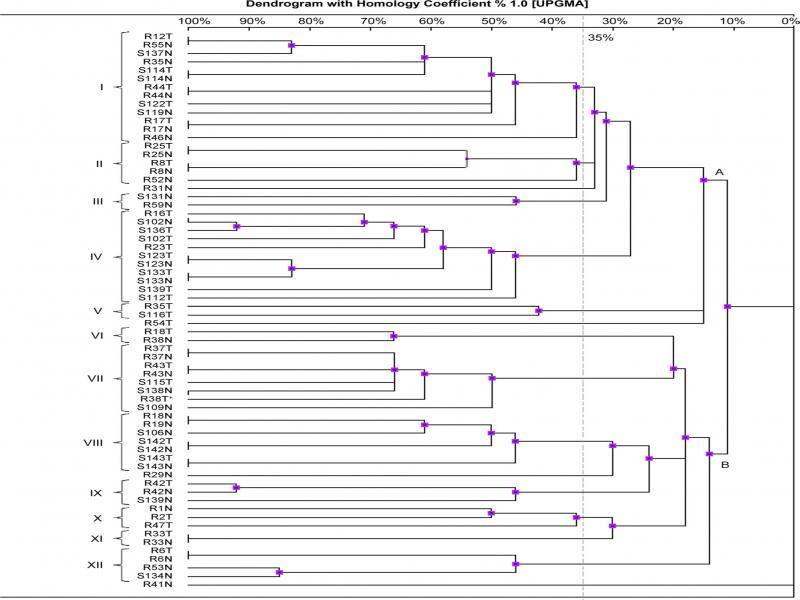
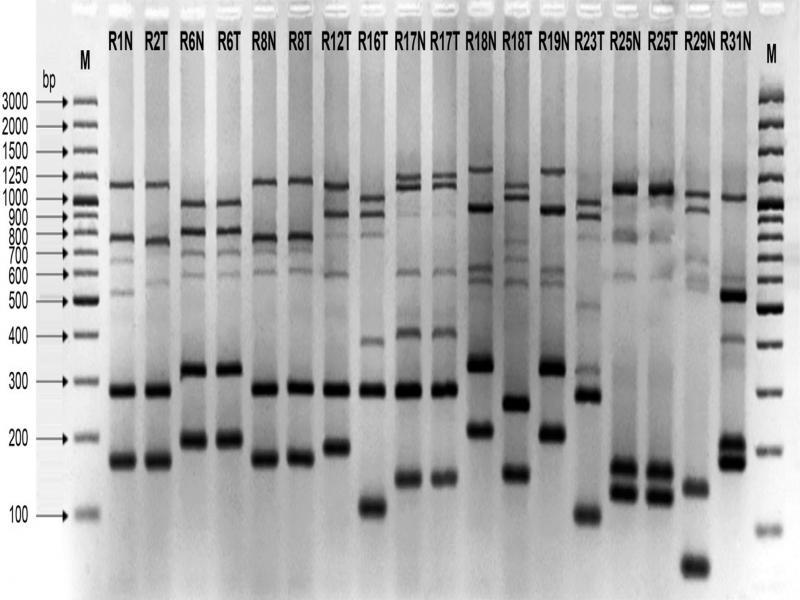
Fig. 2.
Basic demographic characteristics of participants and the prevalence of S_ aureus colonization_
| Total | Residents | Staff | |
|---|---|---|---|
| Age (years) | |||
| Median (range) | 68 (26-97) | 81.5 (56-97) | 43 (26-67) |
| Gender n (%) | |||
| Female | 78 (76.5) | 43 (71.7) | 35 (83.3) |
| Male | 24 (23.5) | 17 (29.3) | 7 (16.7) |
| S. aureus colonization n (%) | 47 (46.1) | 28 (46.7) | 19 (45.2) |
| Nares | 17 (36.2) | 10 (35.7) | 7 (36.8) |
| Throat | 11 (23.4) | 6 (21.4) | 5 (26.4) |
| Nares and throat | 19 (40.4) | 12 (42.9) | 7 (36.8) |
The antimicrobial resistance profiles of S_ aureus strains isolated from residents and staff in a nursing home_
| Main cluster | Sub-cluster | S. aureus strain | Resistance profile |
|---|---|---|---|
| A | IV | R23T | TET |
| IV | S123T, S123N | TET | |
| IV | S133T, S133N | TET | |
| V | S116T | TOB, GEN | |
| B | VII | R38T | FOX, TOB, CIP, LEV, DAP |
| IX | R42T, R42N | TET | |
| IX | S139N | E, CC | |
| X | R2T | E, CC | |
| XI | R33T, R33N | E, CC | |
| XII | S134N | E, CC | |
| - | - | R41N | TET, TOB, GEN |