
Fig. 1.
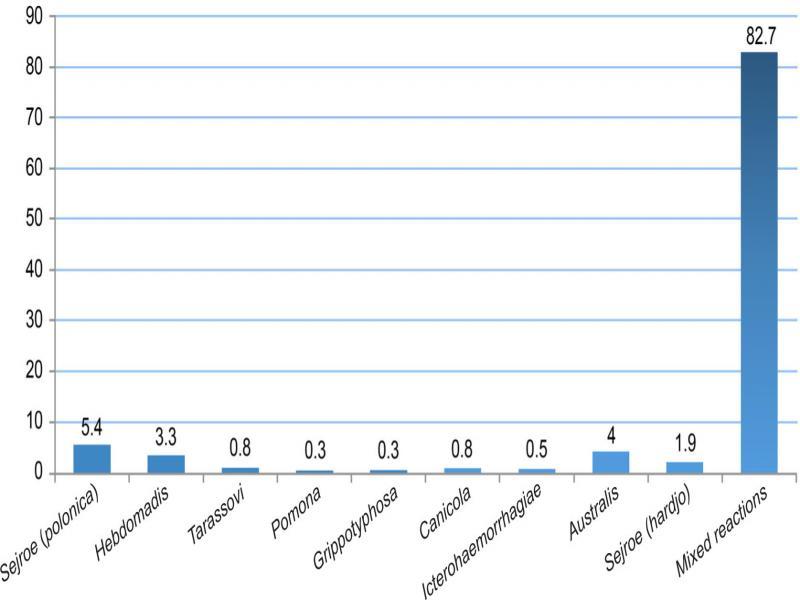
Fig. 2.
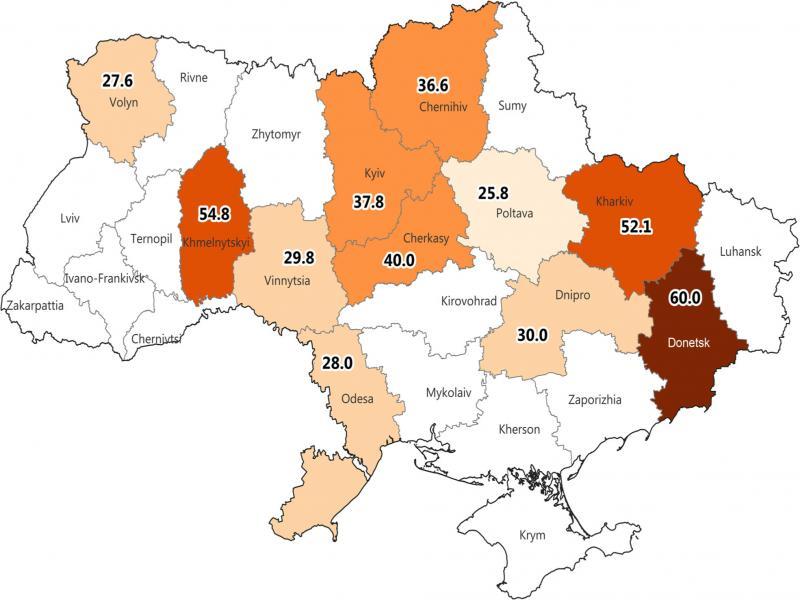
The indicators of cattle infection with serovars hardjo and polonica from leptospirosis-affected farms in different regions of Ukraine_
| Regions | Number of the cattle investigated | Number of the positively reacting cattle sera (% from total sera investigated) | Number of the positively reacting cattle sera to serovars hardjo and polonica (%) | Number of the sera positively reacting with leptospirosis antigens that did not react to hardjo and polonica (% from the positive reacting sera) | ||
|---|---|---|---|---|---|---|
| Sejroe (hardjo) and other serogroups without Sejroe (polonica) (% from the positive reacting sera) | Sejroe (polonica) and other sero-groups without Sejroe (hardjo) (% from total positive reacting) | Two serovars together and other serogroups (% from the positive reacting sera) | ||||
| Khmelnytskyi | 38 | 31 (81.6) | 3 (9.7) | 13 (41.9) | 14 (45.2) | 1 (3.2) |
| Chernihiv | 86 | 41 (47.7) | 6 (14.6) | 14 (34.1) | 9 (22.0) | 12 (29.3) |
| Kyiv | 73 | 45 (61.6) | 4 (8.9) | 23 (51.1) | 13 (28.9) | 5 (11.1) |
| Volyn | 33 | 29 (87.9) | 1 (3.4) | 8 (27.6) | 7(24.1) | 13 (44.9) |
| Donetsk | 12 | 10 (83.3) | 1 (10.0) | 4 (40.0) | 5 (50.0) | - |
| Poltava | 53 | 31 (58.5) | 3 (9.7) | 5(16.1) | 5(16.1) | 18 (58.1) |
| Kharkiv | 106 | 71 (67) | 11 (15.5) | 33 (46.5) | 26 (36.6) | 1 (1.4) |
| Vinnytsia | 65 | 57 (87.7) | 8 (14.0) | 18 (31.6) | 9 (15.8) | 22 (38.6) |
| Odesa | 40 | 25 (62.5) | 2 (8.0) | 16 (64.0) | 5 (20.0) | 2 (8.0) |
| Dnipro | 32 | 10 (31.3) | - | 4 (40.0) | 3 (30.0) | 3 (30.0) |
| Cherkasy | 35 | 20 (57.1) | 4 (20.0) | 5 (25.0) | 4 (20.0) | 7 (35.0) |
| Total | 573 | 370 (64.6) | 39 (10.5) | 143 (38.7) | 100 (27.0) | 88 (23.8) |
The prevalence of antibodies to different Leptospira serogroups in mixed reactions diagnosed with MAT_
| Total number of positive reactions to serovars in mixed reactions (%) | 570 (100%) | ||
| The average number of serovars per mixed reaction | 2 | ||
| Specific combinations of multiple serovars that were commonly seen in samples | Serovars polonica and kabura, polonica and hardjo, hardjo and bratislava | ||
| Number of positive reactions in the samples with antibodies against Leptospira serogroups | Sejroe (serovar polonica) | number | 142 |
| % | 24.9 | ||
| Hebdomadis | number | 84 | |
| % | 14.7 | ||
| Tarassovi | number | 31 | |
| % | 5.4 | ||
| Pomona | number | 37 | |
| % | 6.5 | ||
| Grippotyphosa | number | 14 | |
| % | 2.5 | ||
| Canicola | number | 10 | |
| % | 1.8 | ||
| Icterohaemorrhagiae | number | 15 | |
| % | 2.6 | ||
| Australis (serovar bratislava) | number | 105 | |
| % | 18.4 | ||
| Sejroe (serovar hardjo) | number | 132 | |
| % | 23.2 | ||