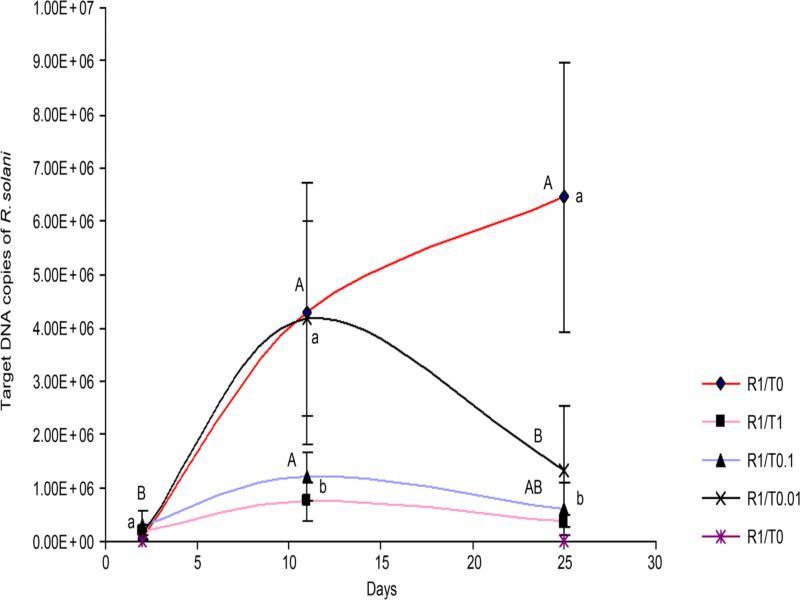
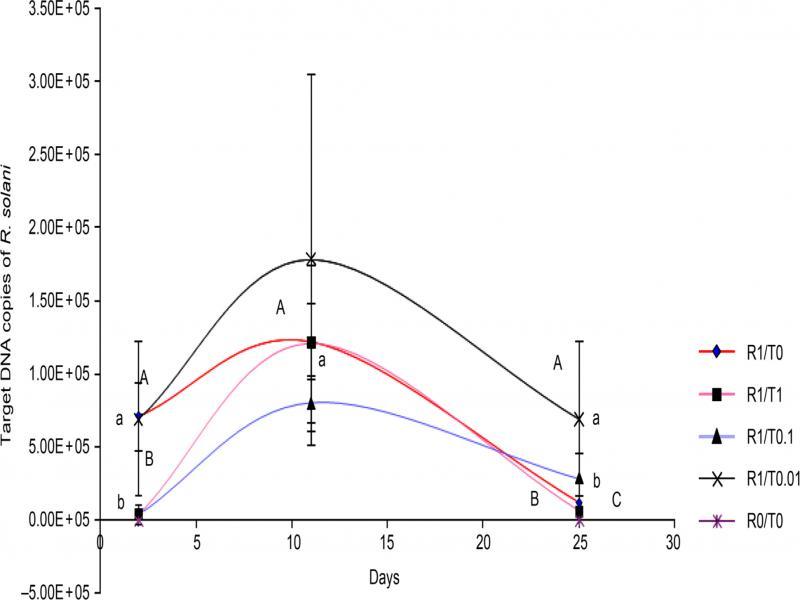
Have a personal or library account? Click to login

In situ Impact of the Antagonistic Fungal Strain, Trichoderma gamsii T30 on the Plant Pathogenic Fungus, Rhizoctonia solani in Soil

Open Access
|Jun 2019

Figures & Tables

Fig. 1.

The influence of different doses of T. gamsii T30 on the R. solani G6 growth in the autoclaved soil (R1/T0 represents the R. solani G6/T. gamsii T30 in the ratios 1/0 and similarly R1/T0.01 = 1/0.01 ratio, R1/T0.1 = 1/0.1 ratio, and R1/T1 = 1/1 ratio; with 1 = 105 copies of the targeted DNA per g of soil). The significant differences in the number of DNA copies are shown using different letters (p ≤ 0.05). Different small letters show the significant differences among different treatments for a given sampling time. Different capital letters indicate significant differences among different sampling times for a given treatment. If the letters happen to be identical at a given data point (either small or capital), they are written only once for the sake of clarity.

Fig. 2.

The influence of different doses of T. gamsii T30 on the R. solani G6 growth in the non-autoclaved soil (R1/T0 represents R. solani G6/T. gamsii T30 in the ratio 1/0 and similarly R1/T0.01 = 1/0.01 ratio, R1/T0.1 = 1/0.1 ratio, R1/T1 = 1/1 ratio; with 1 = 105 copies of the target DNA per g of soil). The significant differences in the number of DNA copies are shown using different letters (p ≤ 0.05). Different small letters show significant differences among different treatments for a given sampling time. Different capital letters indicate the significant differences among different sampling times for a given treatment. If the letters happen to be identical at a given data point (either small or capital), they are written only once for the sake of clarity.
DOI: https://doi.org/10.33073/pjm-2019-021 | Journal eISSN: 2544-4646 | Journal ISSN: 1733-1331
Language: English
Page range: 211 - 216
Submitted on: Oct 14, 2018
Accepted on: Feb 12, 2019
Published on: Jun 28, 2019
Published by: Polish Society of Microbiologists
In partnership with: Paradigm Publishing Services
Publication frequency: 4 times per year

© 2019 MUHAMMAD ANEES, MUHAMMAD ABID, SOBIA CHOHAN, MUHAMMAD JAMIL, NADEEM AHMED, LIXIN ZHANG, EUI SHIK RHA, published by Polish Society of Microbiologists
This work is licensed under the Creative Commons Attribution-NonCommercial-NoDerivatives 4.0 License.