
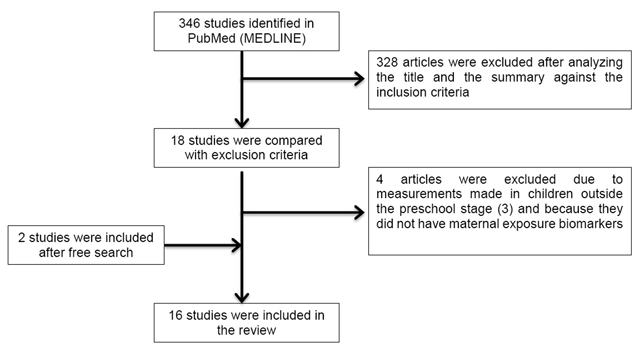
Figure 1
Flowchart for the selection of studies included in the systematic review.
Table 1
Characteristics of cohort studies.
| Author, location, period of study, follow-up and sample size | Exposure | Outcome | Effect size[β, OR, RR (CI95%)] | Adjustment | NOS |
|---|---|---|---|---|---|
| Percentage (%) of fat mass | |||||
| Buckley et al. 2016 [11] New York, USA (1998–2002) Follow up: 4 to 9 y (n = 173) | Phenols in maternal urine (3rd trimester of pregnancy). | % of fat massa, BMIb and overweighte | % fat mass (4 y) 2,5-DCP Boys [β = 0.61 (–1.21, 2.41)], girls [β = 2.94 (0.74, 5.09)] BP-3 Boys [β = –0.02 (–1.73, 1.70)], girls [β = –0.96 (–2.66, 0.75)] BPA Boys [β = 1.42 (–0.35, 3.20)], girls [β = 1.20 (–0.49, 2.85)] Triclosan Boys [β = 0.04 (–1.86, 1.97)], girls [β = 1.01 (–0.55, 2.56)] | Race/maternal ethnicity, age, education, employment, smoking in pregnancy, height and BMI before pregnancy, gestational weight gain, phthalate prenatal exposure (sum of DEHP), lactation, age of the child in months and physical activity in the stage of follow up. | 9 |
| Buckley et al. 2016 [12] New York, USA (1998–2002) Follow up: 4 to 9 y (n = 180) | Phthalates in maternal urine (3rd trimester of pregnancy). | % of fat massa and BMIb,c | % fat mass (4 to 9 y) ΣDEHP: T2 vs. T1 [β = –1.77 (–4.48, 0.97)], T3 vs. T1 [β = –3.06 (–5.99, –0.09)] BMI z-score (4 to 9 y) ΣDEHP: T2 vs. T1 [β = –0.10 (–0.49, 0.29)], T3 vs. T1 [β = –0.13 (–0.55, –0.29)] | Race/maternal ethnicity, age, education, employment, smoking in pregnancy, height and BMI before pregnancy, gestational weight gain, breastfeeding, age of the child in months and physical activity in the follow-up stage. | 8 |
| Body mass index (BMI) | |||||
| Maresca et al. 2016 [20] New York, USA (1998–2006) Follow up: 5 to 7 y (n = 337) | Phthalates in maternal urine (3rd trimester of pregnancy) and child urine (3 and 5 years). | BMIb,c,d, obesityf and % of fat massa | BMI z-score (5 to 7 y) Non DEHP Boys [β = –0.30 (–0.50, –0.10)], girls [β = 0.07 (–0.18, 0.31)] % fat mass (7 y) Non DEHP Boys [β = –1.62 (–2.91, –0.34)], girls [β = 0.62 (–0.64, 1.88)] | Race/maternal ethnicity (self-report), public assistance during pregnancy, obesity before pregnancy (self-report), birth weight, age of the child in months at follow-up time and specific urinary gravity (z-score). | 7 |
| Høyer et al. 2015 [17] Greenland and Ukraine “INUENDO” cohort (2002–2004) Follow up: 5 to 9 y (n = 1022) | PFOA and PFOS in maternal plasma (2nd trimester of pregnancy). | BMIb,c, overweightg and waist/height ratio (WHtR) > 0.5 | Overweight (5 to 9 y) PFOA T3 vs.1 Greenland. Boys [RR = 1.03 (0.66, 1.59)], girls [RR = 1.81 (1.04, 3.17)] WHtR > 0.5 (5 to 9 y) Pooled analysis PFOA [RR = 1.30 (0.97, 1.74)], PFOS: [RR = 1.38 (1.05, 1.82)]. | Maternal age at birth, parity, smoking during pregnancy, education and BMI before pregnancy. The waist/height ratio models were also adjusted for the child’s age and sex. | 8 |
| Tang-Péronard et al. 2014 [21] Faroe Islands (1997–2000) Follow up: 5 to 7 y (n = 561) | PCBs and DDE in maternal serum (3rd trimester of pregnancy) and breast milk. | BMIb, overweight and obesityh | BMI at 5 y in girls born of mothers without overweight PCBs [β = –0.12 (–0.82, 0.58)]; DDE [β = –0.18 (–0.82, 0.45)] BMI at 5 y in girls born of mothers with overweight Q4 vs.1 PCBs [β = 0.59 (–0.47, 1.65)]; DDE [β = 0.15 (–0.9, 1.20)] | Parity and maternal age. | 8 |
| Braun et al. 2014 [14] Cincinnati, USA “HOME” cohort (2003–2006) Follow up: 2 to 5 y (n = 297) | BPA in maternal urine (2nd trimester of pregnancy) and child urine (1–2 years). | BMIb,c, waist circumference (WC) and overweighte | Change in BMI (2 to 5 y) Boys [β = 0.0 (–0.5, 0.6)], girls [β = –0.4 (–0.9, 0.2)] WC Global [β = –1.5 (–4.0, 1.0)] Overweight [OR = 0.65 (0.19, 2.18)] | Maternal race, marital status, parity, age at birth, economic income, education, employment, social security, BMI at 16 weeks of pregnancy, depressive symptoms at baseline and prenatal serum cotinine levels. | 8 |
| Valvi et al. 2013 [24] Spain (2004–2006) Follow up: 4 y (n = 344) | BPA in maternal urine (average of the 1st and 3rd trimesters of pregnancy). | BMIb,c, overweighte and waist circumference (WC) | The prevalence of overweight at 4 years was 21%. WC [β per 10 log units = 0.28 (0.01, 0.57)] BMI z-score [β = 0.28 (–0.06, 0.63)] Overweight [RR = 1.38 (0.72, 2.67)] | Sex of the child, exact age of event measurement, time of the day in which the woman’s urine sample was collected, country of origin, age at delivery, education, parity, BMI prior to pregnancy and smoking during pregnancy. | 7 |
| Verhulst et al. 2009 [6] Belgium (2002–2004) Follow up: 1 to 3 y (n = 344) | HCB, DDE, PCB and dioxins in umbilical cord blood. | BMIb,c | Difference in the BMI z-score (1 to 3 y) DDE [β = –0.002 ± 0.001, p = 0.2]; DDE*smoking [β = –0.003 ± 0.001, p = 0.06] PCBs [β = 0.003 ± 0.001, p-value = 0.03] No association with HCB and dioxins was observed | Age of the child, BMI of the parents, maternal age at birth, birth weight in z-score, breastfeeding, maternal smoking before or during pregnancy and household income. | 5 |
| Weight and height | |||||
| Gardner et al. 2013 [16] Bangladesh (2002–2009) “MINIMat” cohort Follow up: 5 y (n = 1505) | As (weeks 6–8 and 30), Cd (week 8) and Pb (weeks 14 and 30) in maternal urine. | Weight and heighti | None of the maternal biomarkers was associated with anthropometric outcomes at 5 years | SES, chewing tobacco during pregnancy, cooking on fire indoors, maternal education, season of the year in which the birth occurred, parity, sex of the child, anthropometric characteristics and gestational age at birth. | 9 |
| Waist circumference | |||||
| Philippat et al. 2014 [13] France (2003–2006) “EDEN” cohort Follow up: 1 to 3 y (n = 520) | Phenols in maternal urine (week 22–29 of pregnancy). | Weight, height and waist circumference (WC) | WC growth rate (mm/week) in children from 1 to 3 years estimated by the increase in 1 IQR 2,4-DCP β = 2.34 (–0.19, 4.86)], 2,5-DCP [β = 2.18 (–0.91, 5.27)], BPA [β = 0.62 (–2.57, 3.81)], BP-3 [β = 1.18 (–1.36, 3.71)], Triclosan [β = 2.66 (–1.21, 6.53)], Methylparaben [β = 4.18 (0.70, 7.65)], Ethylparaben [β = 1.89 (–1.91, 5.69)] Propylparaben [β = 3.37 (–0.30, 7.04)], Butylparaben [β = 3.61 (–0.43, 7.66)] | Maternal and paternal height, weight before pregnancy, maternal smoking (passive and active) during pregnancy, maternal education, recruitment center, parity and duration of breastfeeding. | 6 |
| Cardiometabolic markers | |||||
| Vafeiadi et al. 2016 [15] Greece (2007–2009) “Rhea” cohort Follow up: 6 mo to 4 y (n = 235) | BPA free and conjugated in maternal urine (1st trimester of pregnancy) and child urine (3 and 5 years). | BMIb,c, obesityh, waist circumference (WC), skin folds, blood pressurej and biochemical parameters in blood samplesk. | BMI z-score at 4 y Boys [β = 0.4 (0.005, 0.8)], girls [β = –0.4 (–0.9, 0.05)]. WC (cm) Boys [β = 1.3 (–0.7, 3.2)], girls [β = –1.8 (–4.1, 0.5)]. Skin folds (mm) Boys [β = 1.9 (–4.0, 7.8)], girls [β = –5.1 (–12.1, 1.9)]. | Maternal variables: education, age, BMI before pregnancy, employment and smoking during pregnancy. Variables of the child: birth weight for gestational age, breastfeeding, time to watch television and energy intake at 4 years. | 7 |
| Vafeiadi et al. 2015 [18] Greece (2007–2009) “Rhea” cohort Follow up: 6 mo to 4 y (n = 689) | PCBs, DDE and HCB in maternal serum (1st trimester of pregnancy). | BMIb,c, obesityh, waist circumference (WC), skinfolds, blood pressurej and biochemical parameters in blood samplesk. | BMI z-score at 4 y HCB: [β = 0.49 (0.12, 0.86)], DDE: [β = 0.27 (0.04, 0.51)] Obesity HCB: RR = 8.14 (1.85, 35.81)], DDE: [RR = 3.80 (1.19, 12.14)] WC > P HCB: [RR = 3.49 (1.08, 11.28)], DDE: [RR = 3.76 (1.70, 8.30)] Skin folds HCB: [β = 7.71 (2.04, 13.39)], DDE: [β = 2.75 (–0.86, 6.35)] Systolic blood pressure HCB: [β = 4.34 (0.63, 8.05)], DDE: [β = 2.31 (–0.07, 4.69)] Diastolic blood pressure HCB: [β = 2.48 (–0.13, 5.09)], DDE: [β = 1.79 (0.13, 3.46)] Exposure to PCBs was not associated with obesity or cardiometabolic risk factors in children | Maternal variables: triglycerides and cholesterol, age, BMI before pregnancy, parity, educational level, smoking during pregnancy. Variables of the child: weight at birth, sex, lactation, gestational age and exact age at the time of measurement. | 7 |
| Tang-Péronard et al. 2015 [7] Faroe Islands (1997–2000) Follow up: 5 y (n = 520) | PCBs and DDE in maternal serum (3rd trimester of pregnancy), HCB in breast milk (4–5 days after delivery). | Insulin and leptin in blood samplesl | Insulin > P75 Q4 vs. 1 PCBs: Boys [OR = 1.13 (0.51, 2.48)], girls [OR = 3.74 (1.36, 10.27)] DDE: Boys [OR = 1.56 (0.71, 3.44)], girls [OR = 2.74 (1.08, 6.94)] HCB: Boys [OR = 1.36 (0.80, 2.30)], girls [OR = 1.86 (0.99, 3.47] Leptin > P75 Q4 vs. 1 PCBs: Boys [OR = 0.78 (0.34, 1.79)], girls [OR = 0.61 (0.24,1.53)] DDE: Boys [OR = 1.01 (0.45, 2.28)], girls [OR = 0.75 (0.31,1.82)] HCB: Boys [OR = 1.25 (0.67, 2.36)], girls [OR = 0.68 (0.34,1.36)] | Maternal age, BMI before pregnancy, parity, BMI of the child at 5 years of age and time of the day in which the blood sample was collected. | 8 |
| Valvi et al. 2015 [19] Spain (2004–2006) Follow up: 4 y (n = 391) | Phthalates in maternal urine (1st and 3rd trimesters of pregnancy). | BMIb,c, overweighte, waist circumference (WC), waist/height ratio (WHtR) > 0.5, systolic and diastolic blood pressurem | Systolic blood pressure (4 y) ΣHMWPm Girls T2 vs. 1[β = –0.30(–0.60, –0.01)]; T3 vs. 1[β = –0.32 (–0.62, –0.03)] Boys T2 vs. 1[β = –0.01(–0.34, 0.32)]; T3 vs. 1[β = –0.06 (–0.39, 0.26)]. No association with WHtR was observed | Sex of the child, exact age at the time of measurement, characteristics of the mother (country of origin, age at birth, parity, education, social class, pre-pregnancy BMI and smoking in pregnancy). | 7 |
| Kalish et al. 2014 [22] Massachusetts, USA (1999–2002) “Viva” Study Follow up: 4 to 9 y (n = 1031) | Hg in maternal blood (2nd trimester of pregnancy). | Blood pressurej | Prenatal exposure to mercury was not associated with systolic blood pressure in children | Maternal variables: age, race/ethnicity, education, smoking and prenatal alcohol consumption, fish consumption, marital status, height and weight before pregnancy and history of hypertension. Variables of the child: age and sex. | 6 |
| Hawkesworth et al. 2013 [23] Bangladesh (2002–2009) “MINIMat” cohort Follow up: 4.5 y (n = 1280) | As (week 8 and 30) and Cd (week 8) in maternal urine. | Blood pressurej | Systolic blood pressure (4.5 y) As [β = 3.69 (0.74, 6.63)], Cd [β = –0.49 (–1.44, 0.45)] Diastolic blood pressure (4.5 y) As [β = 2.91 (0.41, 5.42)], Cd [β = –0.21 (–1.02, 0.59)] | Sex of the child, age, socioeconomic index of the parents, height at 4.5 years, season of the year in which the child was born and maternal blood pressure at the beginning of pregnancy. | 8 |
[i] Q: quartile; T: tertile; P: percentile; WC: waist circumference; AC: abdominal circumference; IQR: interquartile range; 2,5-DCP: 2,5 dichlorophenol; BP-3: Benzophenone-3; BPA: Bisphenol A; 2,4-DCP: 2,4 dichlorophenol; DEHP: Di (2-ethylhexyl) phthalate; ΣDEHP: summary measures for DEHP; ΣHMWPm: summary of high-molecular-weight phthalate metabolites; PFOA: perfluorooctanoate; PFOS: perfluorooctane sulfonate; PCBs: polychlorinated biphenyls; DDE: p,p´-dichlorodiphenyldichloroethylene; HCB: hexachlorobenzene; Hg: mercury; As: arsenic; Cd: cadmium. a% fat mass was calculated using the estimates reported by the bioelectrical impedance scale [(fat mass/weight) × 100]. bBMI was calculated as the weight(kg)/height(m2) and cwas transformed to z-score according to the sex and age of the children. eOverweight=BMI ≥ P85. fObesity=BMI ≥ P95. gOverweight=BMI>1SD. hOverweight (boys 17.39, girls 17.23) and obesity (boys 19.27, girls 19.2) classification according to the International Obesity Task Force (IOTF) at 5 years of age. iWeight for age and height for age. jBlood pressure was measured with a digital oscillometer. kBiochemical parameters were evaluated in blood samples obtained without fasting. lInsulin and leptin determination was performed using LuminexÒ mPercentiles according to sex, age and height of children.
Table 2
Quality assessment of the cohort studies (adapted from the Newcastle-Ottawa scale). The stars are obtained if the criterion written in italics is met.
| Selection of the study groups |
|
| Comparability of the groups |
|
| Outcome |
|