
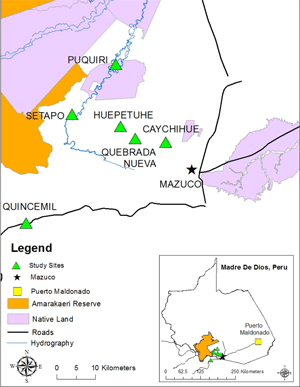
Figure 1
Map of study sites and location where HbA1c values were obtained using point-of-care analyzers. Green triangles represent the location of the six communities selected for this study, and the black star represents the site of HbA1c analysis using the point-of-care analyzers.
Table 1
HbA1c concentration (% DCCT units) by method.
| Afinion (n = 187) | DCA Vantage (n = 203) | HPLC (n = 203) | |
|---|---|---|---|
| Mean (standard deviation) | 5.8 (0.5) | 5.5 (0.5) | 5.2 (0.5) |
| Range | 5.0–9.6 | 4.7–9.1 | 4.4–9.0 |
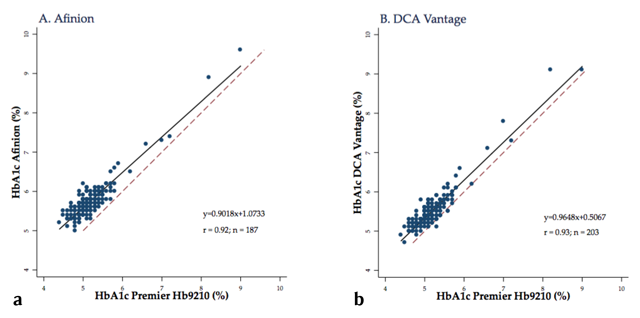
Figure 2
Correlation between each point-of-care analyzer to the Premier Hb9210 for measuring HbA1c (DCCT units). Blue dots represent individual samples, the dotted red line represents the line of identity x = y, and the solid black line is the regression line. Abbreviations: HbA1c, hemoglobin A1c; DCCT, Diabetes Control and Complications Trial.
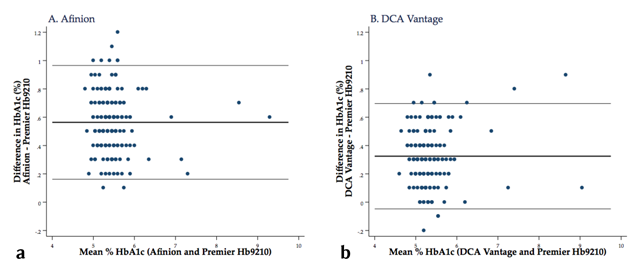
Figure 3
Bland-Altman plot of the differences in HbA1c measurement (using DCCT units) between each point-of-care analyzer and the Premier Hb9210 by mean HbA1c level. Blue dots represent individual samples. The horizontal black lines represent the bias (mean difference between the point-of-care analyzer and the Premier Hb9210) and its limits of agreement. Abbreviations: HbA1c, hemoglobin A1c; LOA, DCCT, Diabetes Control and Complications Trial.