Figure 1
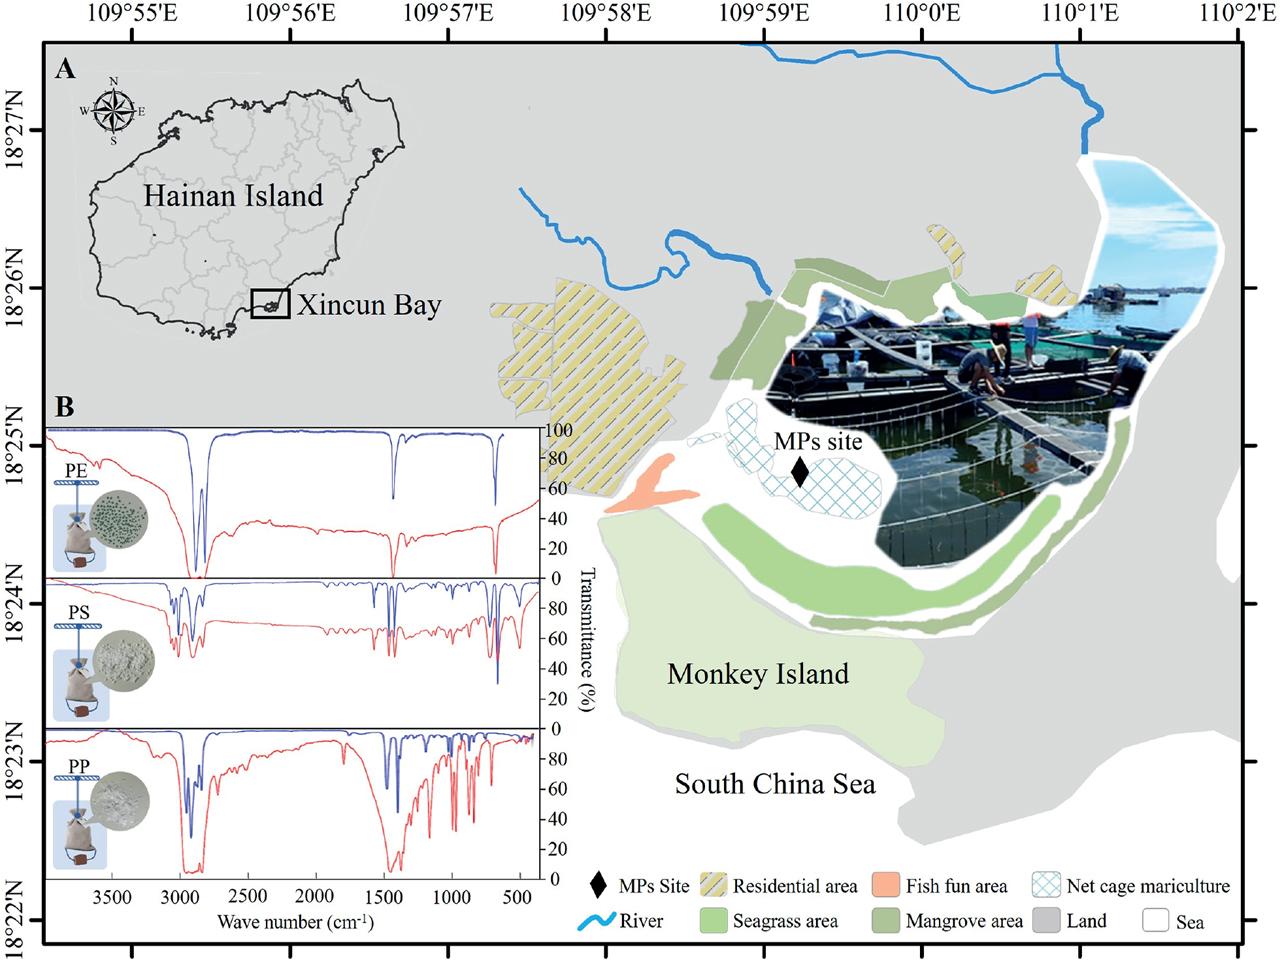
Figure 2
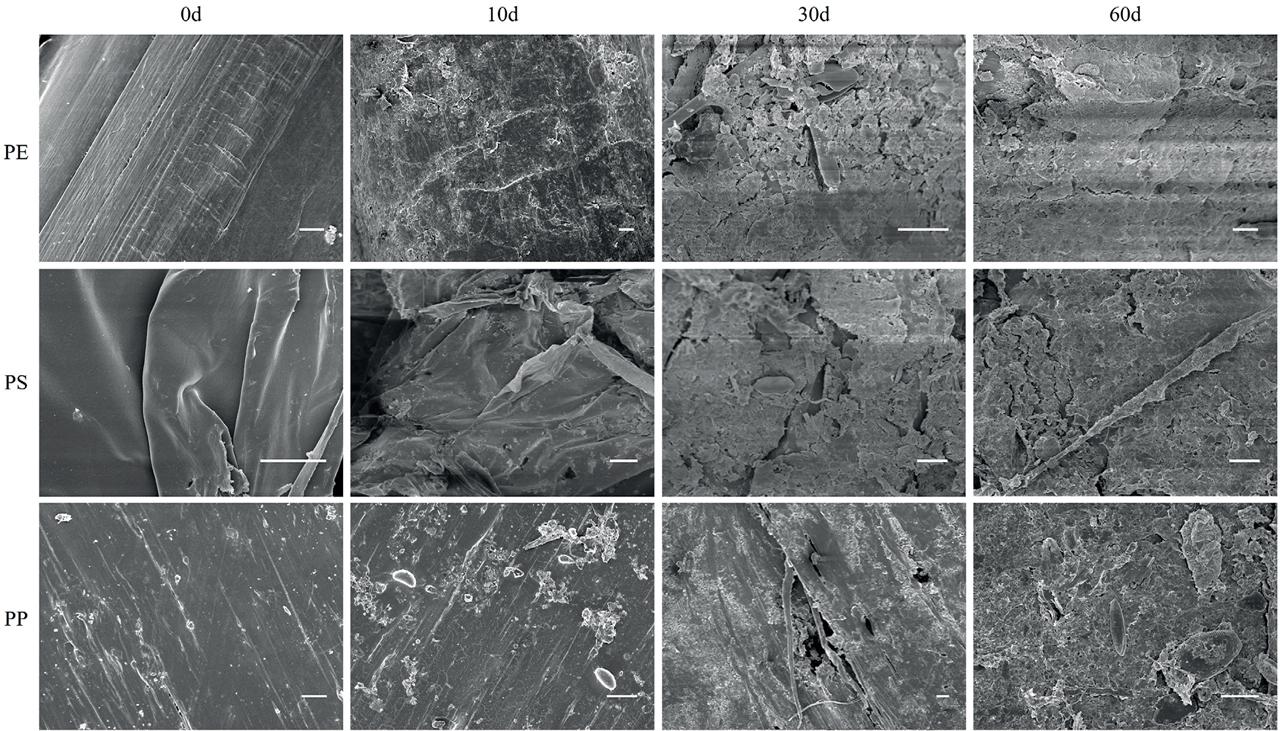
Figure 3
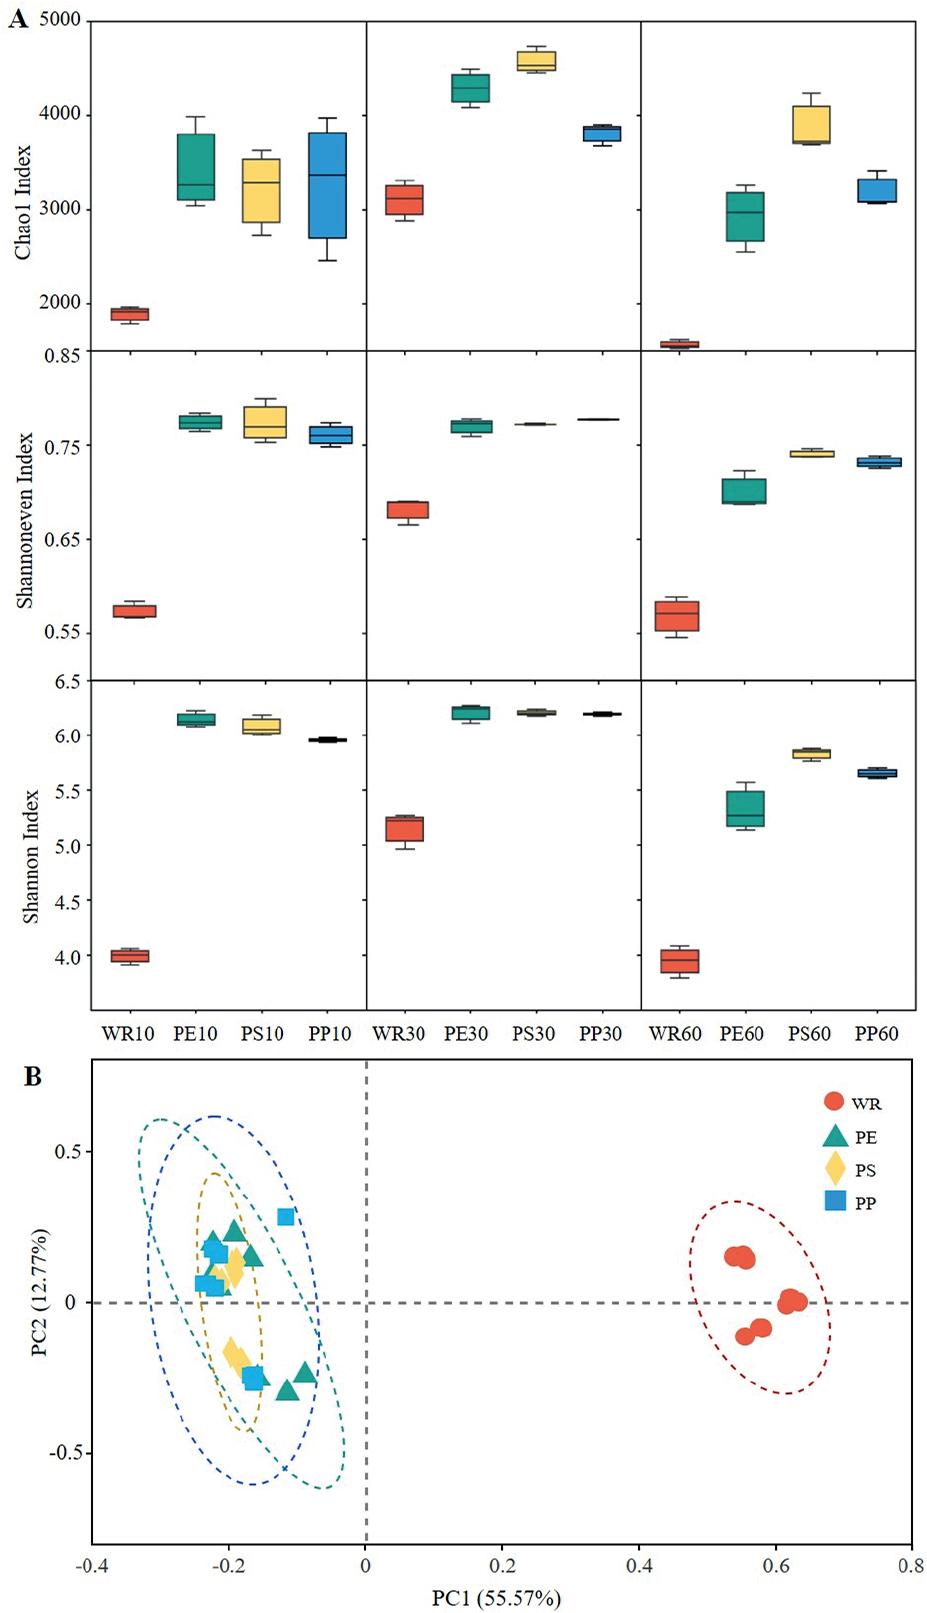
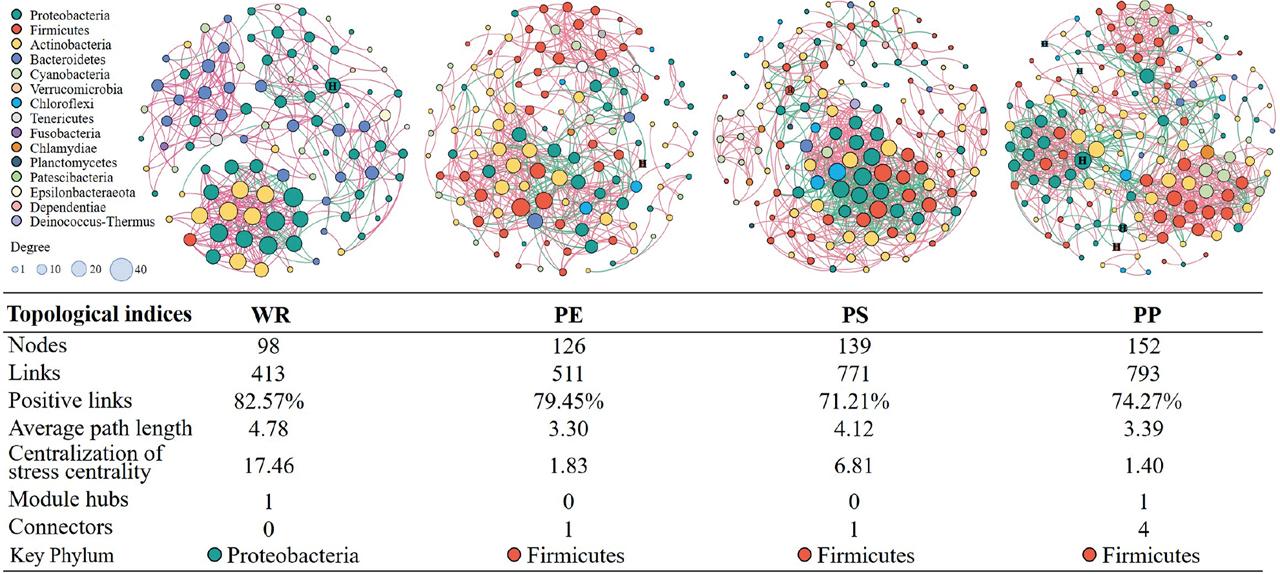
Figure 4
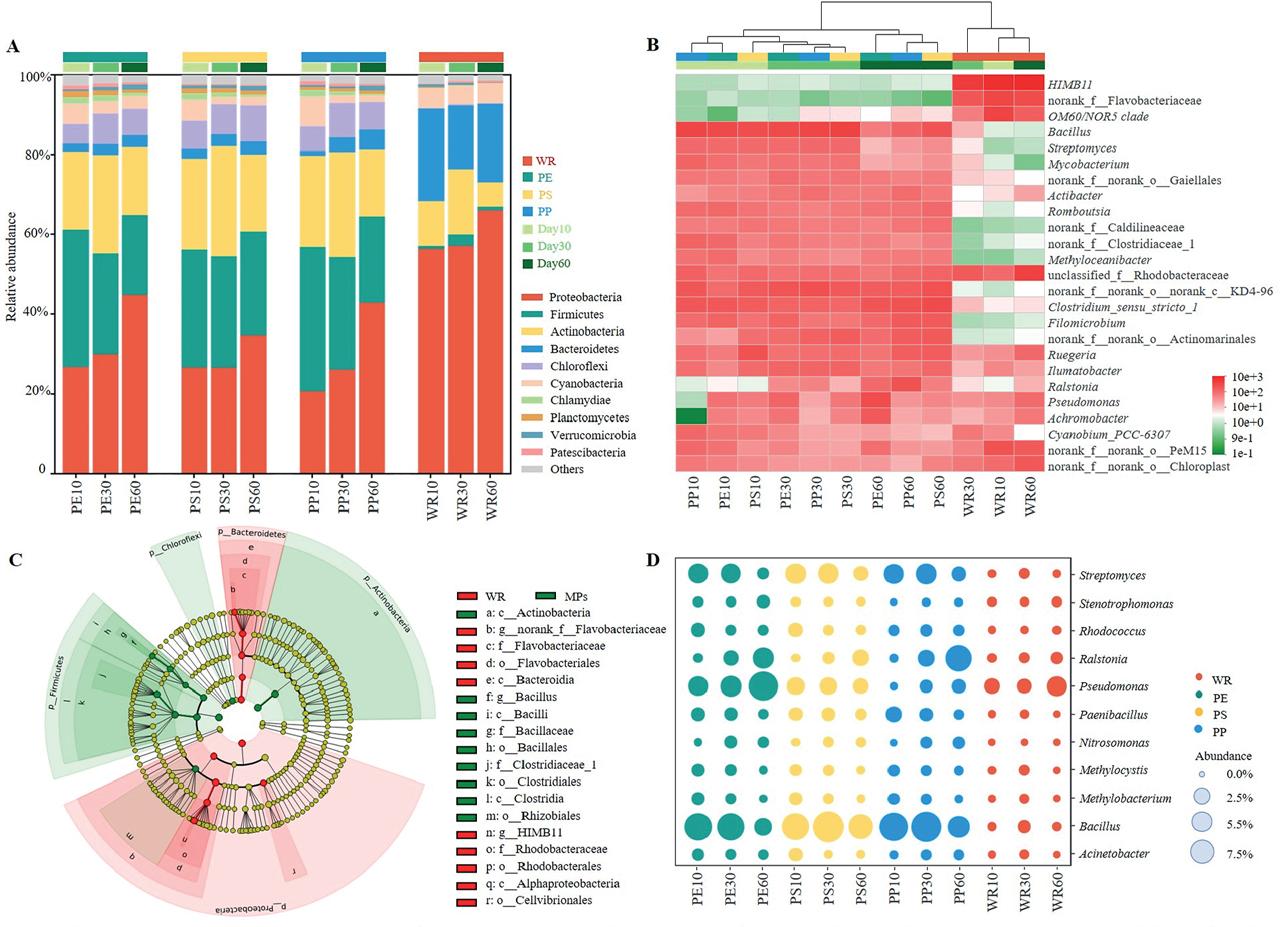
Figure 5
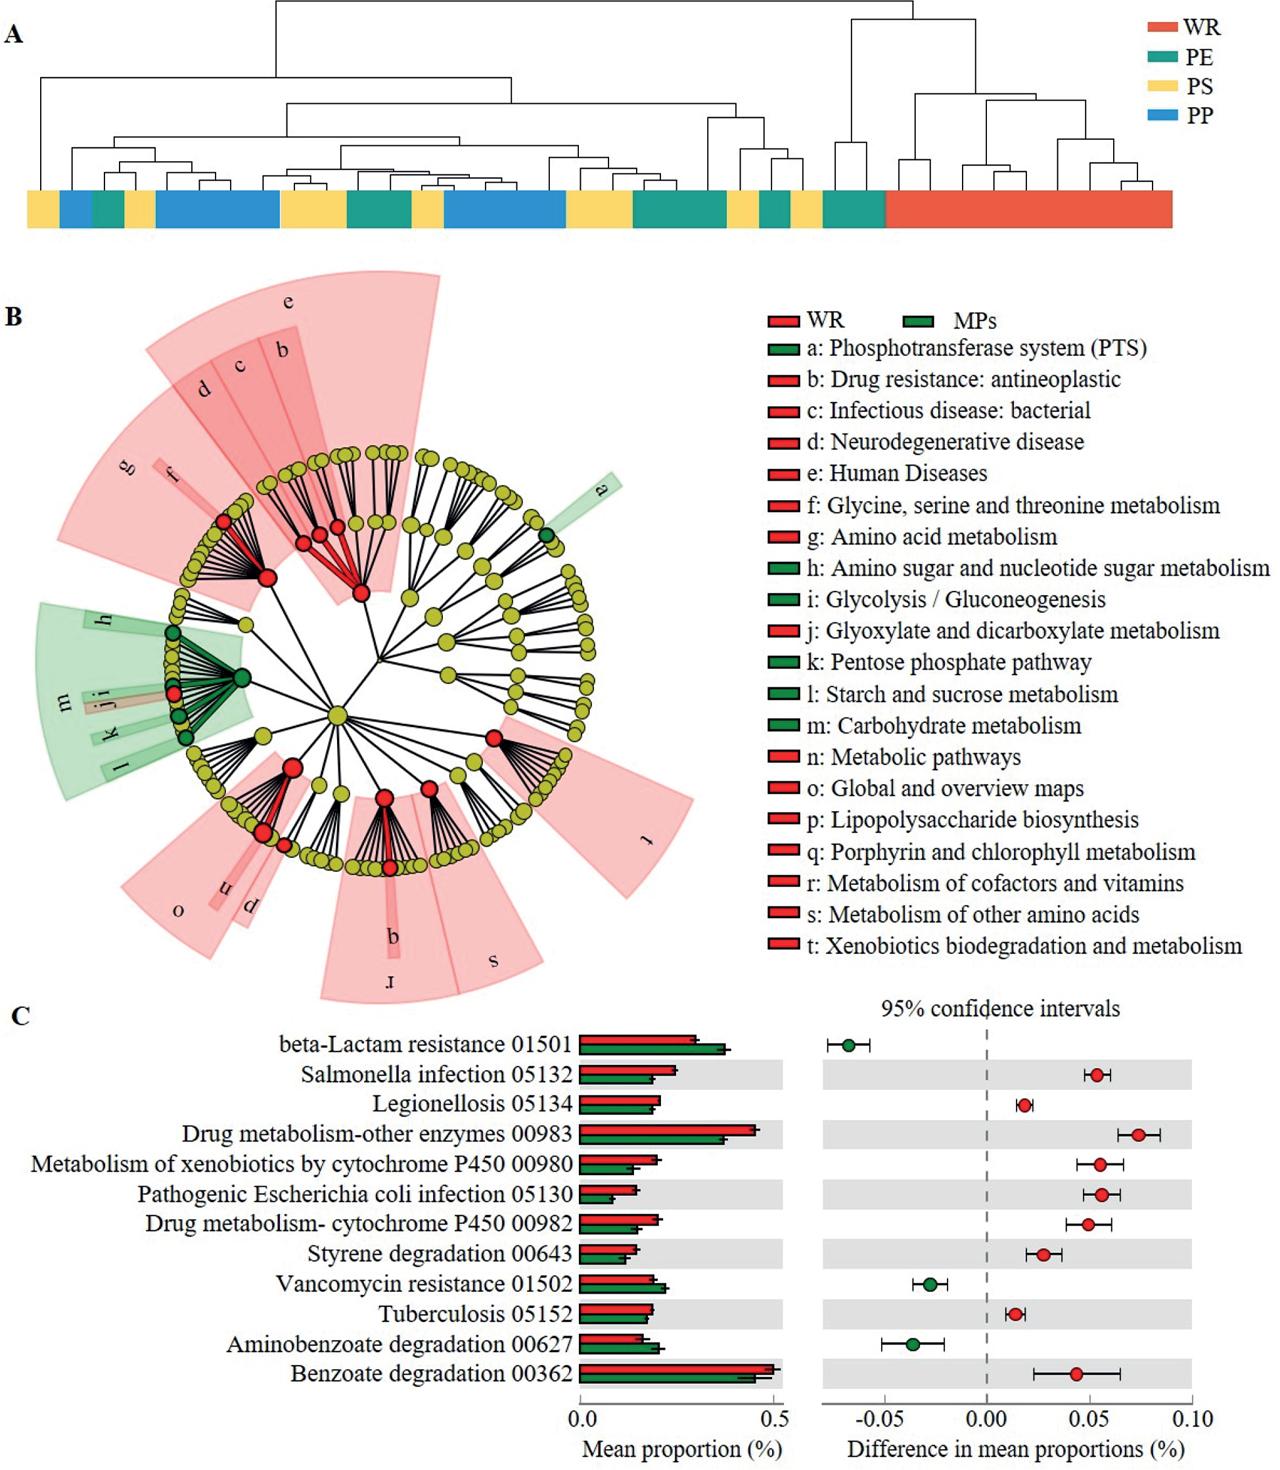
Figure 6

© 2022 Yunfeng Shi, Shuai Wang, Hui Wang, Zhaoyang Li, Jiali Cai, Qiuying Han, Muqiu Zhao, published by University of Gdańsk
This work is licensed under the Creative Commons Attribution-NonCommercial-NoDerivatives 4.0 License.