
1. Introduction
Museum collections serve as an important complement that can help draw inferences about historical fish assemblages and the environmental conditions to which they were adapted (Suarez & Tsutsui, 2004). Researchers can study how characteristics, including compositional shifts, affect species and biodiversity patterns, biogeographic distribution, accumulation of toxins, and morphological features are changing at both spatial and temporal scales using these collections, and the collections chosen for support are also important conservation tools (Bakker et al., 2020). These changes may be due to natural processes or human disturbances (Al Fatle et al., 2026a), such as channelization (Lau et al., 2006), water contamination (Hill et al., 2010), environmental change, or changes in land use (Daniels et al., 2016). Museum specimens, such as marine and freshwater fish, have been analyzed for mercury (Barber et al., 1972; Hill et al., 2010; Miller et al., 1972), to characterize patterns over time of fish communities in Costa Rica (Reznick et al., 1994), and to show how anthropogenic impoundments induce morphological shifts in fish populations (Franssen, 2011). Museum specimens are extremely useful when available as they greatly increase our ability to reconstruct historical environmental and ecological conditions across a broad range of research questions.
From the details of creation to the archiving and care of museum specimens, extremely careful protocols must be followed to ensure the longevity of these objects. It is imperative to understand the most effective ways to safeguard collections and to recognize that all precautions have their place, while ensuring adequate protection. Formalin has historically been used as a fixative as well as a preservative, but due to its toxic nature (Morgan, 1997), modern methods often pair formalin fixation with ethyl alcohol preservation or use freezing techniques (Al-Hassan et al., 2000; Al-Hassan & Shawafi, 1997; Kelsch & Shields, 1996). But, in some other species, size has been shown to impact preservation reproducibility (Al-Hassan et al., 1993, 2000; Cunningham et al., 2000; Ehrlich et al., 1976; Hjoöleifsson & Klein-MacPhee, 1992; Jawad, 2003; Lee et al., 2012; Santos et al., 2009) or even preservation type (Cunningham et al., 2000; Jawad, 2003; Santos et al., 2009).
Among preservation artifacts, shrinkage is the most common one and has been reported to significantly affect morphometric measurements (Al-Hassan et al., 2000; Cunningham et al., 2000; Lee et al., 2012). There is a trade-off as water is lost or replaced by preservatives, but the degree of distortion varies by method. Thus, while ethanol produces more shrinkage than buffered formalin (Cunningham et al., 2000; Moku et al., 2004), freezing causes evaporative water loss with no fluid replacement (Jawad, 2003).
While research on length-based shrinkage in preserved fish is abundant (Al-Hassan et al., 2000; Fox, 1996; Jawad, 2003; Thorstad et al., 2007), studies on proportional shrinkage, or the uniformity of the dimension’s shrinkage, are lacking. As morphometric studies are common in ecology and evolutionary research (Aguilar-Medrano & Cendejas, 2022; Franssen, 2011; Langerhans et al., 2003; Meyer, 1989; Reznick et al., 1994), it is essential to evaluate whether the shrinkage caused by preservation has an impact on these analyses. This study examined how fixation, fixation combined with preservation, and freezing affect the morphometric characteristics of three species of cichlids, C. zillii, O. aureus, and O. niloticus, captured in the Tigris River in the vicinity of Al-Zubaidiyah, Iraq, and provides standardized conversion formulae for reference purposes.
2. Materials and methods
Seventy specimens of each of C. zillii, O. aureus, and O. niloticus (Fig. 1) were obtained from fishermen using a sein net in the Tigris River at Al-Zubaidiyah City (32.76°N, 45.18°E) (Fig. 2), Kut Province, Iraq, in 23–25 August 2024. The mean (M) and standard deviation (SD)of the total length (TL), standard length (SL), and head length (HL) for the three cichlid species investigated are: C. zillii (TL = 136 ± 2.8, SL = 116 ± 4.61, HL = 30 ± 1.63), O. aureus (TL = 144 ± 1.36, SL = 116 ± 1.24, HL = 37 ± 1.81), and O. niloticus (TL = 170 ± 2.63, SL = 140 ± 2.98, HL = 28 ± 1.58). For each species, specimens were divided into 7 groups of 10 individuals for use in formalin, alcohol, and formalin and freezing experiments. The seven lots are: 10% formalin diluted in tap water, 10% formalin diluted in distilled water, 5% formalin diluted in tap water, 5% formalin diluted in distilled water, 70% ethanol diluted in tap water, 70% ethanol diluted in distilled water, and freezing. A “bump” (general) measuring board was used to take field measurements from captured specimens, with all measurements being recorded to the nearest 0.1 mm. Body measurements were selected based on the most commonly used by taxonomists and fisheries biologists, namely TL, SL, and HL. Measurements were taken once a week for a total of 20 weeks on each group of specimens to reflect the time needed for morphometric measurements to cease shrinking. All the fixative and preservative solutions were made in pairs of two: 10% formalin in tap water and distilled water and 70% ethanol in tap water and distilled water. Lot number 5 was the one used in the freezing test, and it was kept in a freezer unit with a capacity of 1 m3. The specimens intended for the freezing experiment were exposed directly to ice cubes, then placed in a freezer at −20°C within 1 hr and frozen. Samples collected to determine the effects of fixative and preservation were placed into labeled jars filled with fixative or preservative directly in the field once measured and marked. Fixatives and preservatives were not changed through the 20 weeks of the experiment. Frozen samples were thawed at room temperature for 2–4 hr. After collection, fish specimens were brought back to the laboratory at the Department of Biology, College of Science, University of Baghdad, for processing.
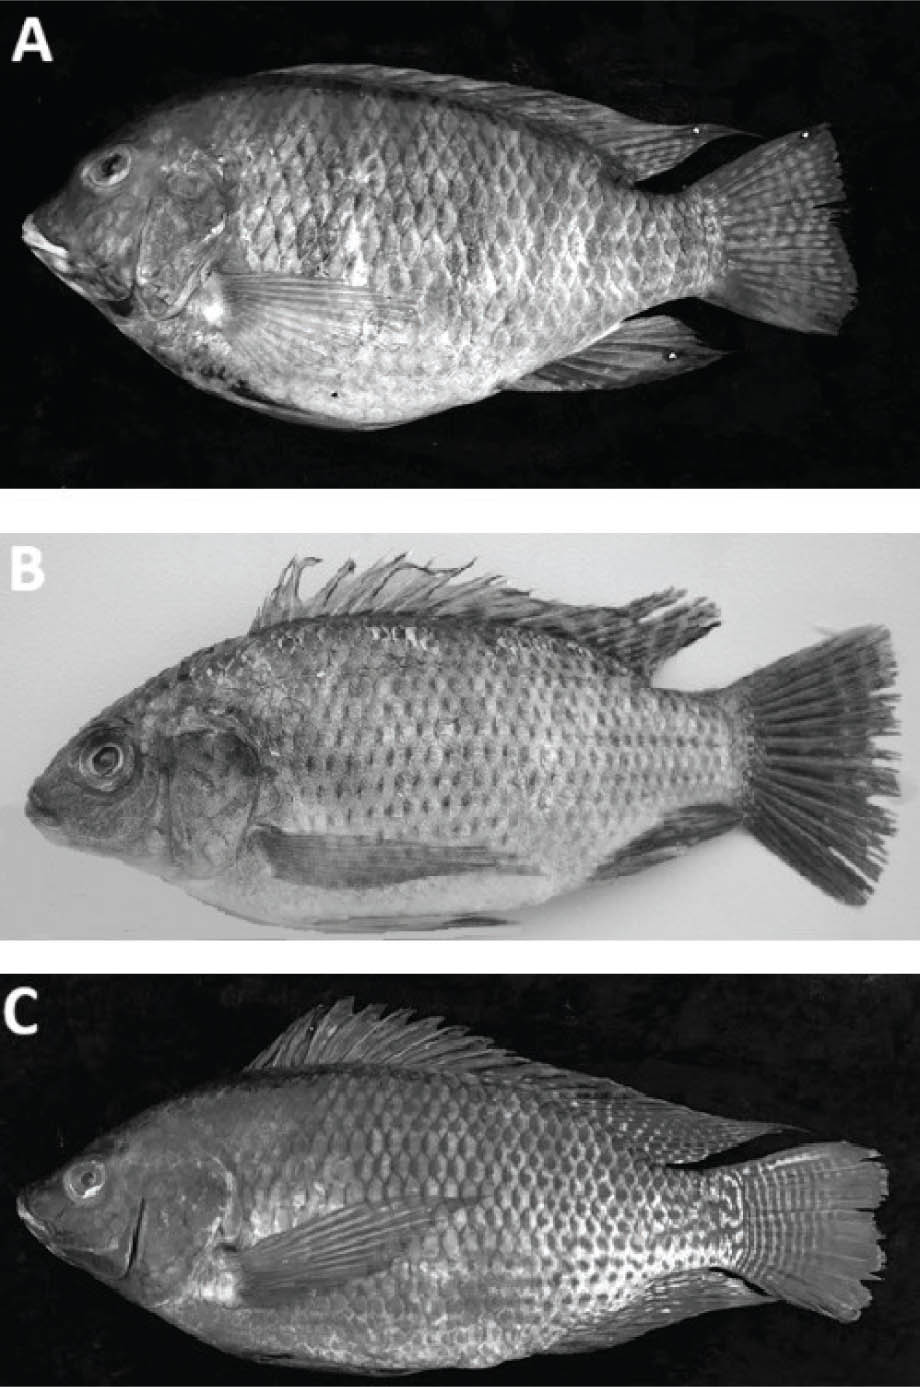
Figure 1
(A) C. zillii, (B) O. aureus, (C) O. niloticus; Al-Zubaidiyah, Iraq.
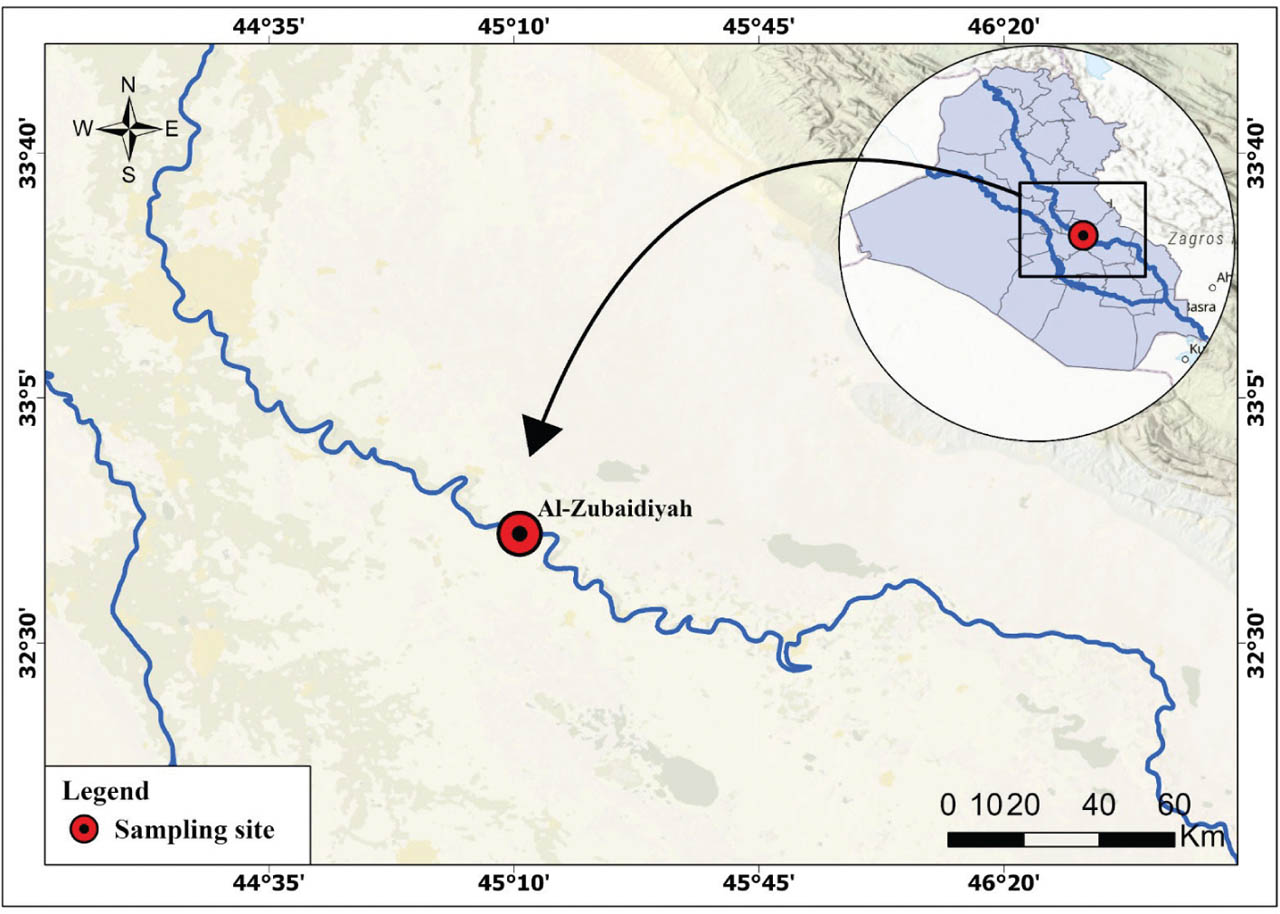
Figure 2
Sampling locations of three cichlid species.
3. Statistical analyses
In order to determine how various preservatives and freezing affected body proportions, Duncan’s multiple range test was used (Harraway, 1997). Changes in length measurements associated with preservation procedures were statistically assessed using paired-sample t-tests. Least-squares linear regression analysis was conducted to test the hypothesis that different preservation times have a detectable effect on the shrinkage values for the specimens of that species. Separate linear regressions (least-squares) were performed to relate fresh measurements to preserved ones. The formula for calculating the length percentage change (Greszkiewicz & Fey, 2024) is:
Where:
Lfresh = fresh (pre-preservation) length
Lpreserved = preserved (post-preservation) length
Linear regression was used to predict fresh size. To express these size differences in a more understandable manner, percentage shrinkage was calculated. The three categories of preservation approaches incorporating predetermined length as a covariate (frozen, 70% ethanol, 10% formalin) were statistically compared using an Analysis of variance (ANOVA).
To visually represent the effects of fixatives, freezing, and preservation, we graphed the mean of the three morphological traits for each cichlid species against the experimental time frame (weeks).
4. Results
In general terms, the overall tendency in C. zillii, O. aureus and O. niloticus shows that fixatives, freezing and preservatives cause shrinkage in TL, SL and HL to different extents, according to the species, body measurements, and treatment applied (Figs. 3–8) (Table 1).
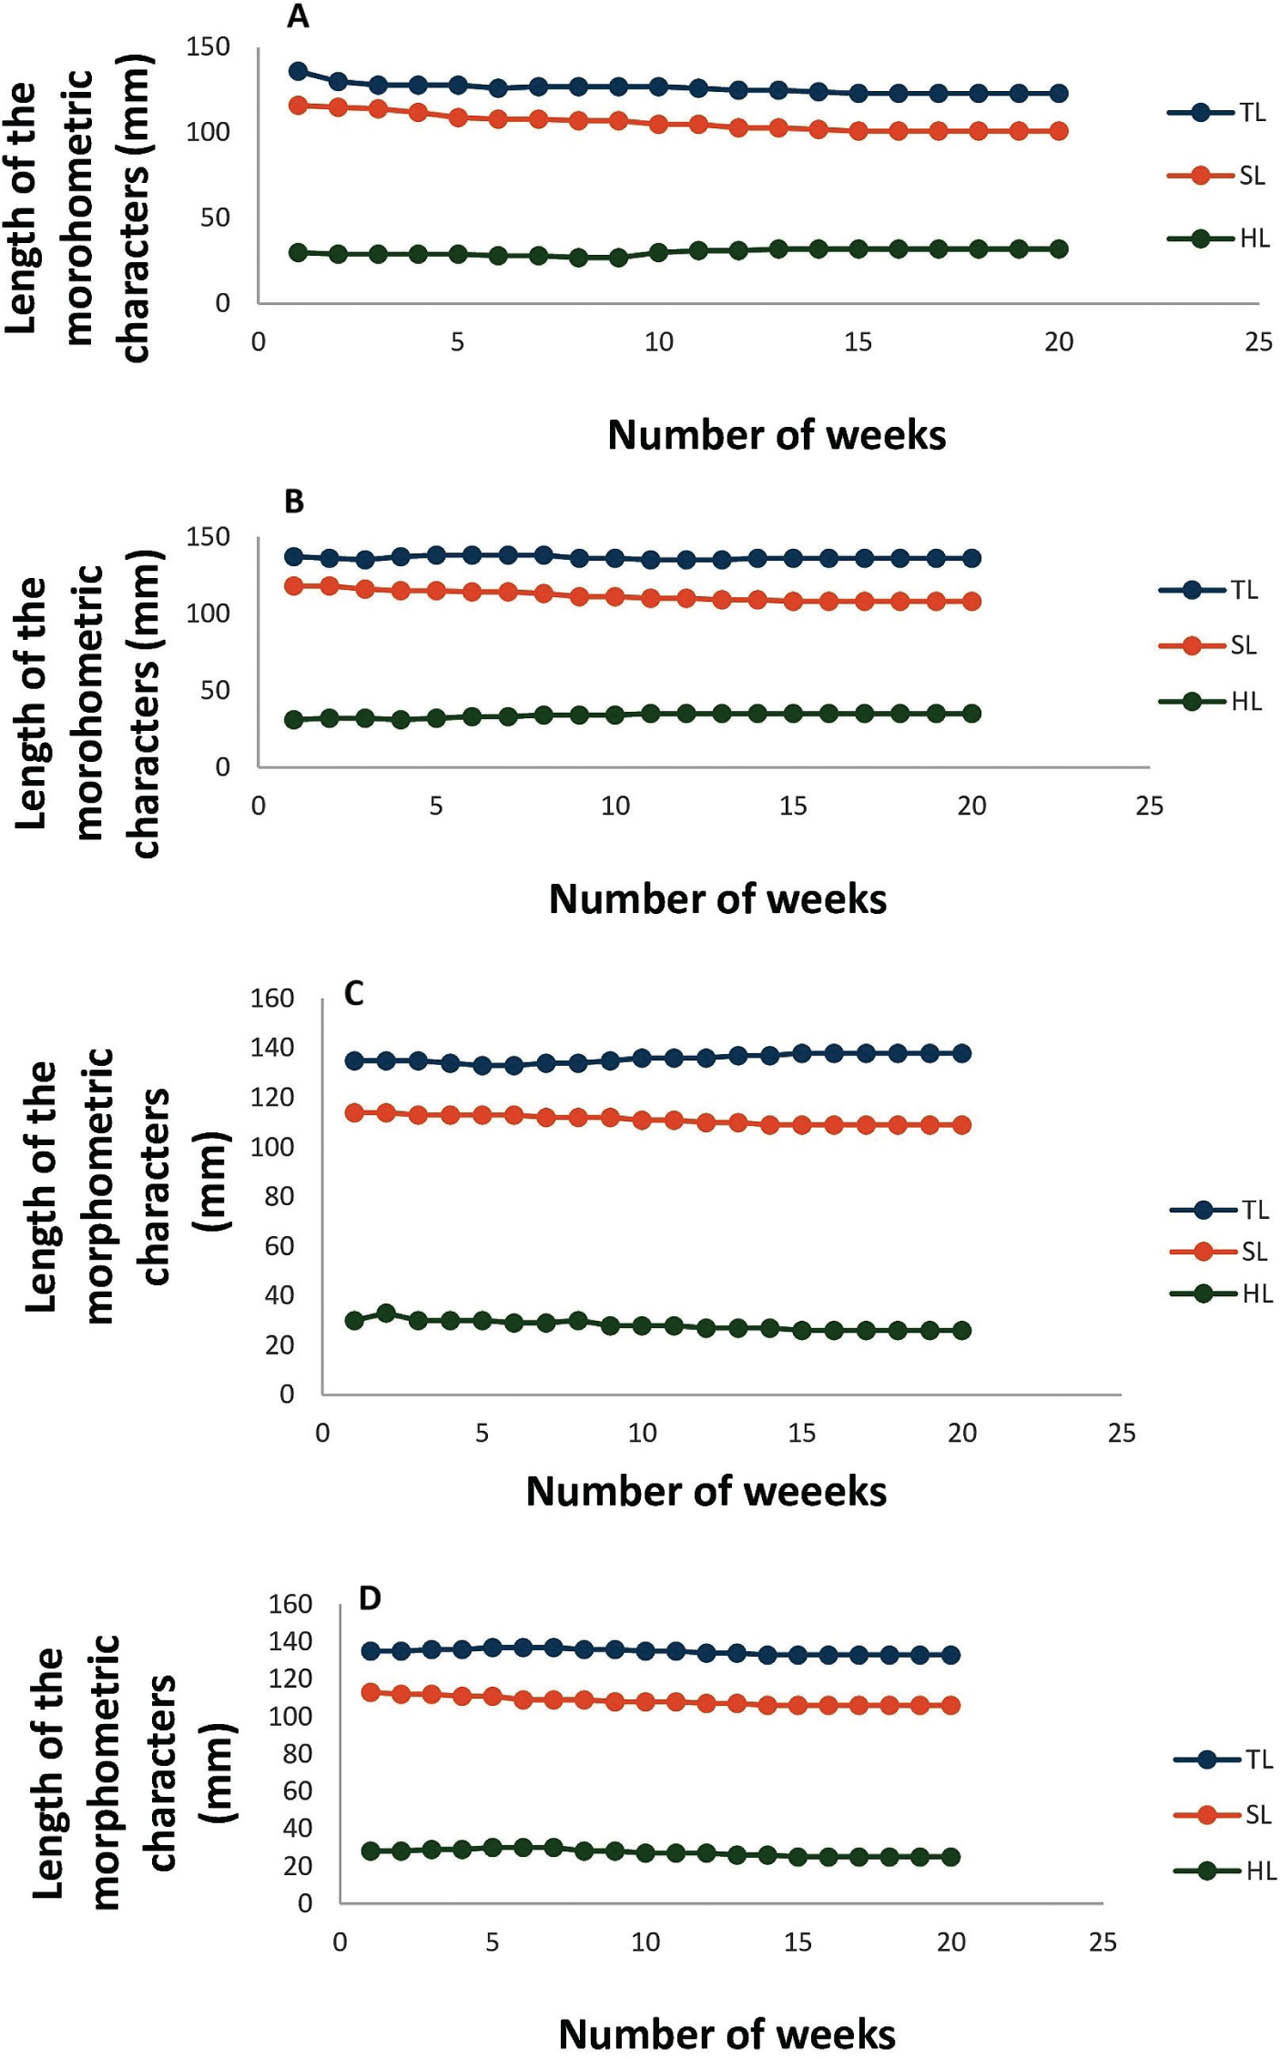
Figure 3
Influence of fixative, freezing, and preservative on the physical dimensions of C. zillii. (A) mixing 10% formalin with tap water; (B) mixing 10% formalin and distilled water mixture; (C) mixing 5% formalin with tap water; (D) mixing 5% formalin with distilled water. HL, head length; SL, standard length, TL, total length.
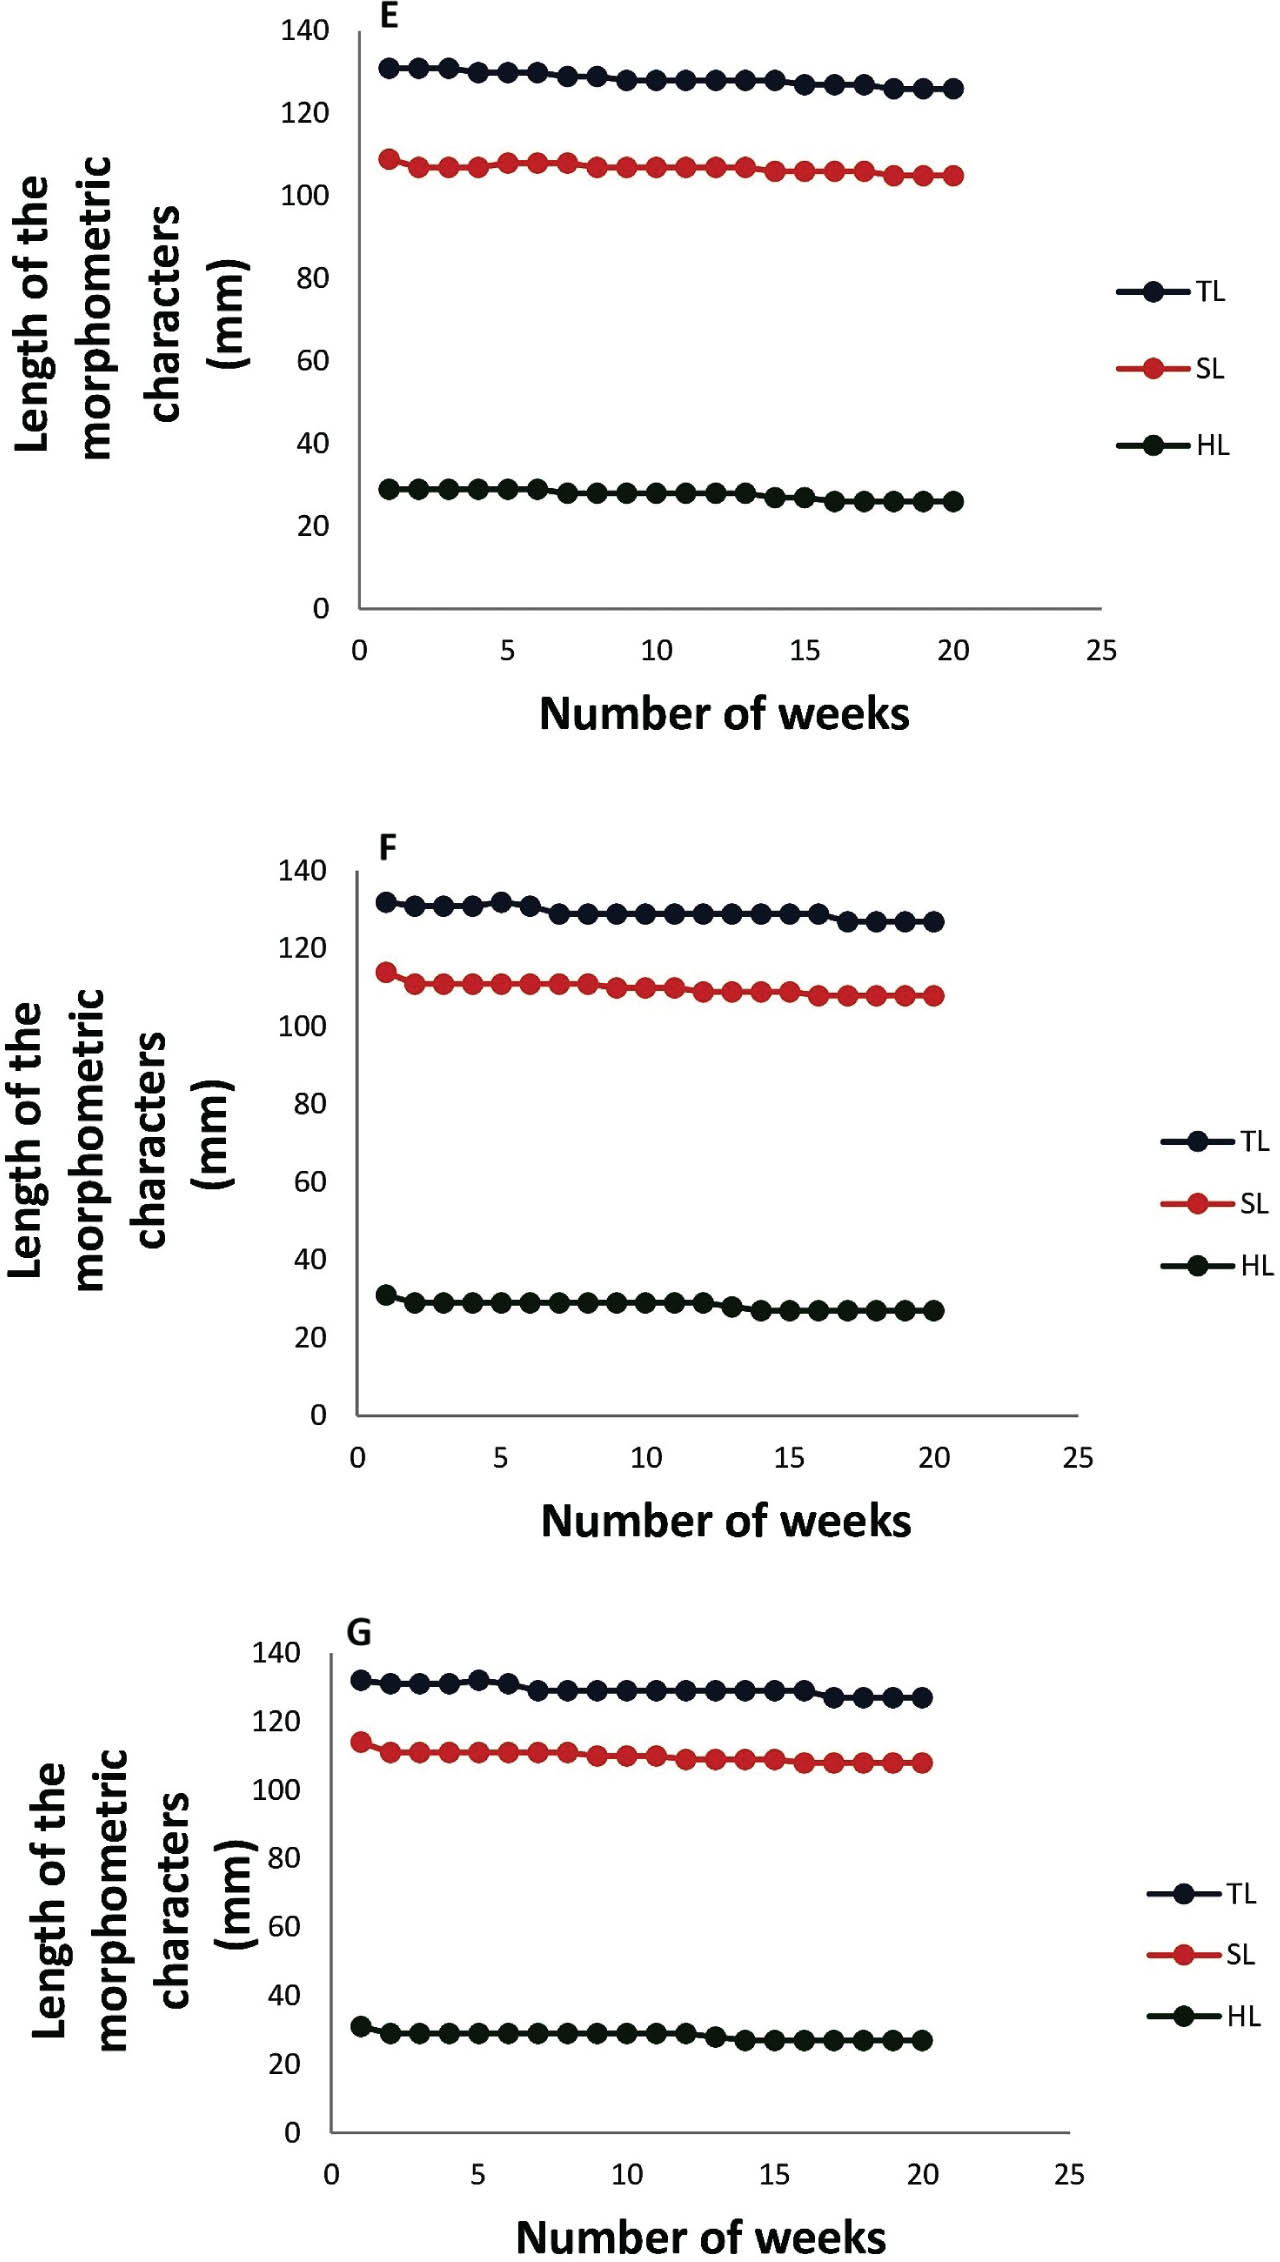
Figure 4
Influence of fixative, freezing, and preservative on the physical dimensions of C. zillii. (E) mixing 70% ethanol with tap water; (F) mixing 70% ethanol with distilled water; (G) freezing. HL, head length; SL, standard length, TL, total length.
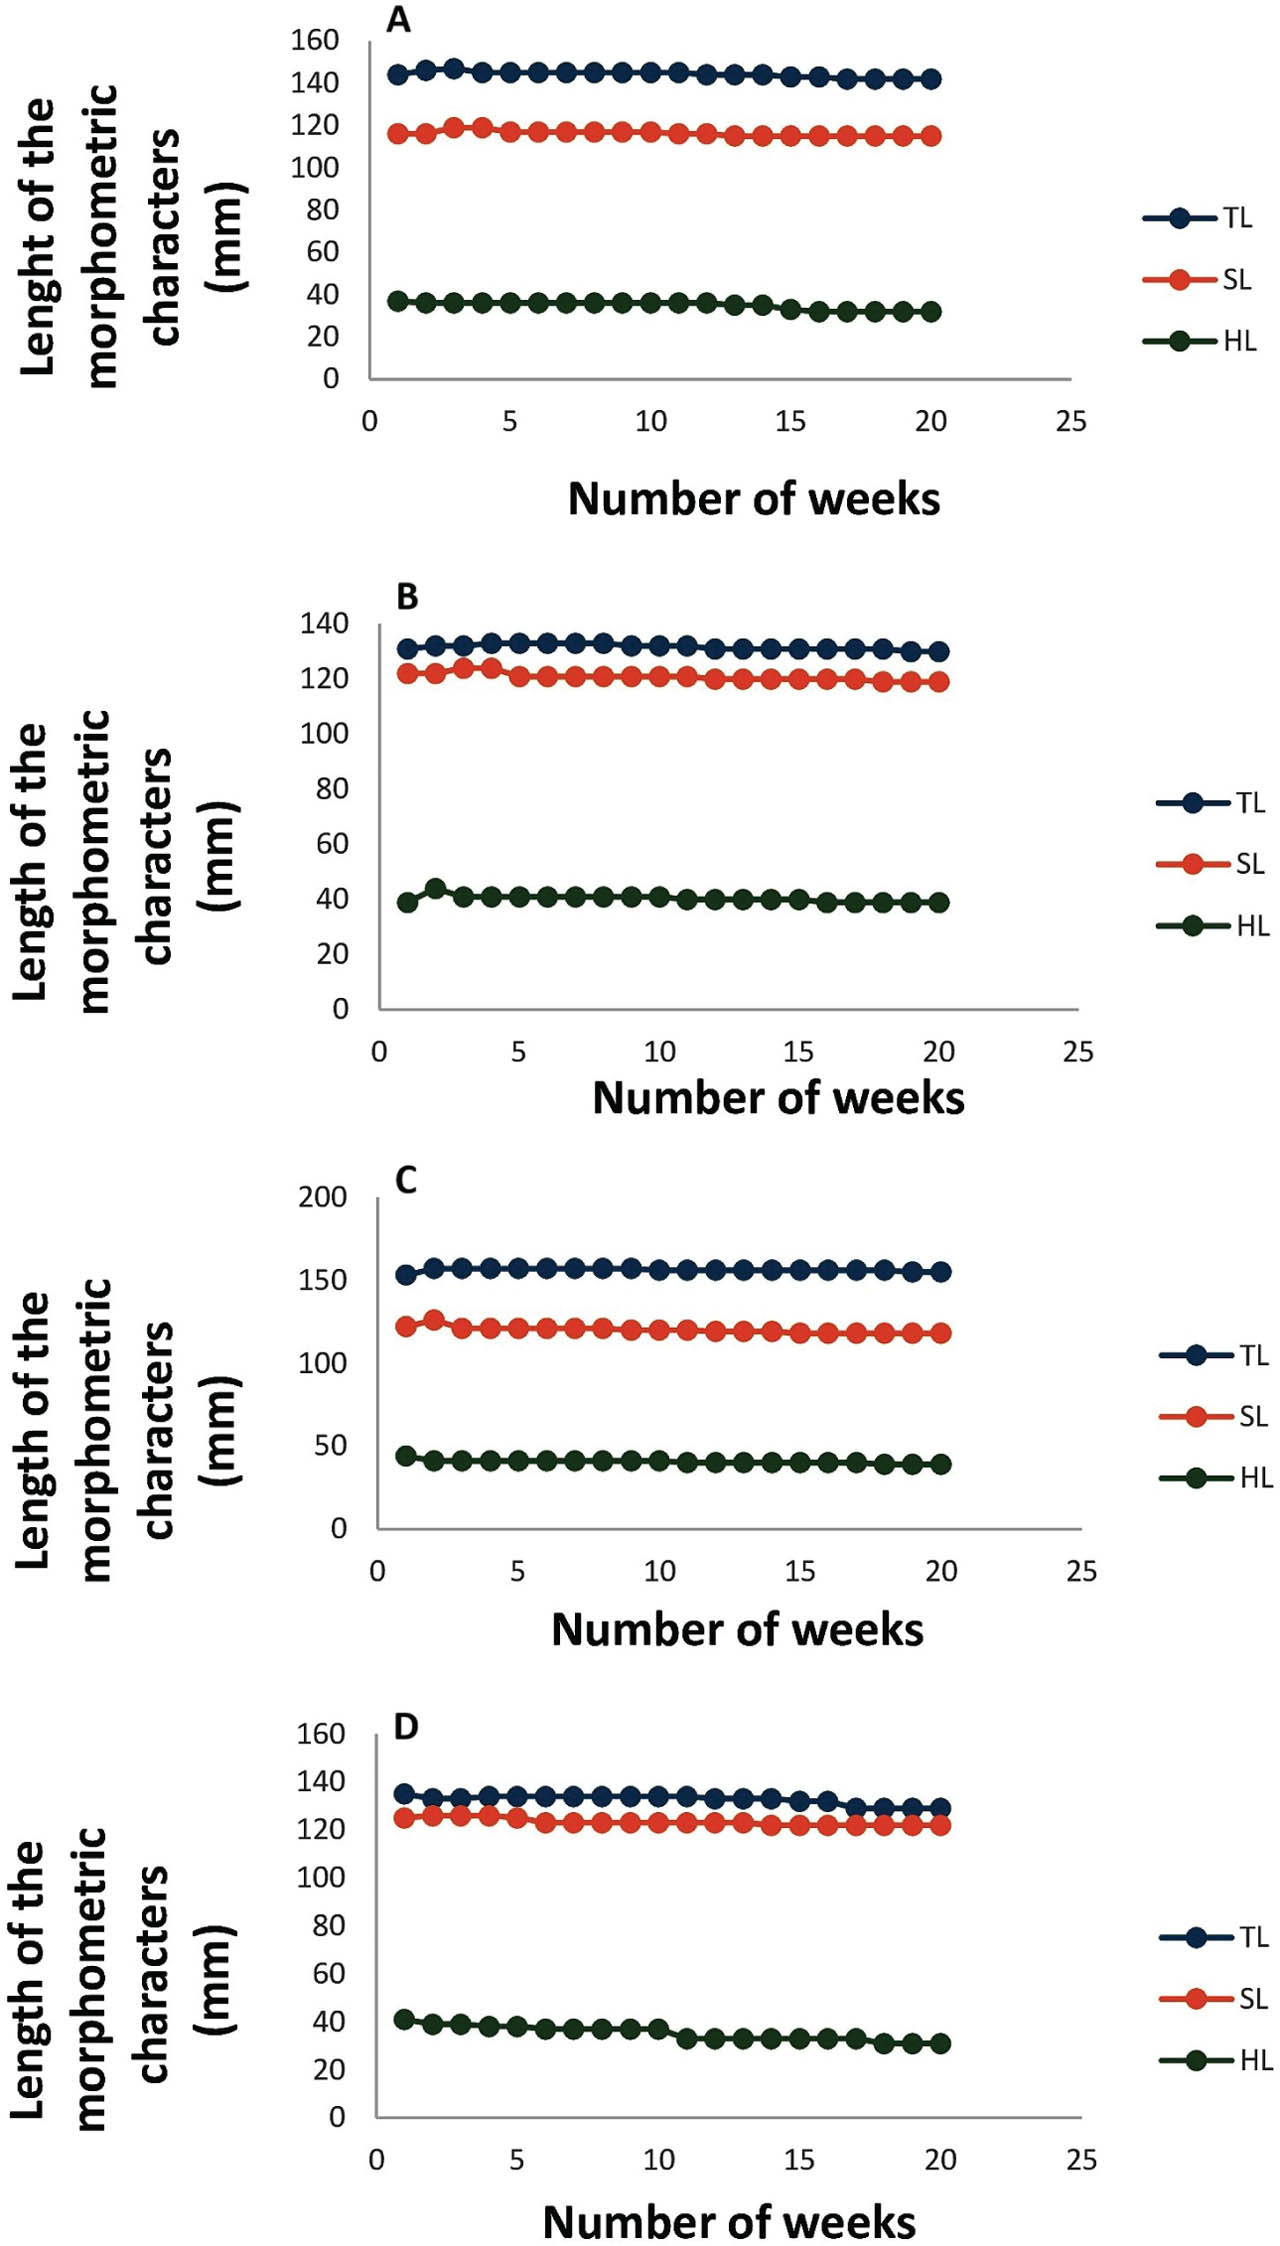
Figure 5
Influence of fixative, freezing, and preservative on the physical dimensions of O. aureus. (A) mixing 10% formalin with tap water; (B) mixing of 10% formalin and distilled water mixture; (C) mixing 5% formalin with tap water; (D) mixing 5% formalin with distilled water. HL, head length; SL, standard length, TL, total length.
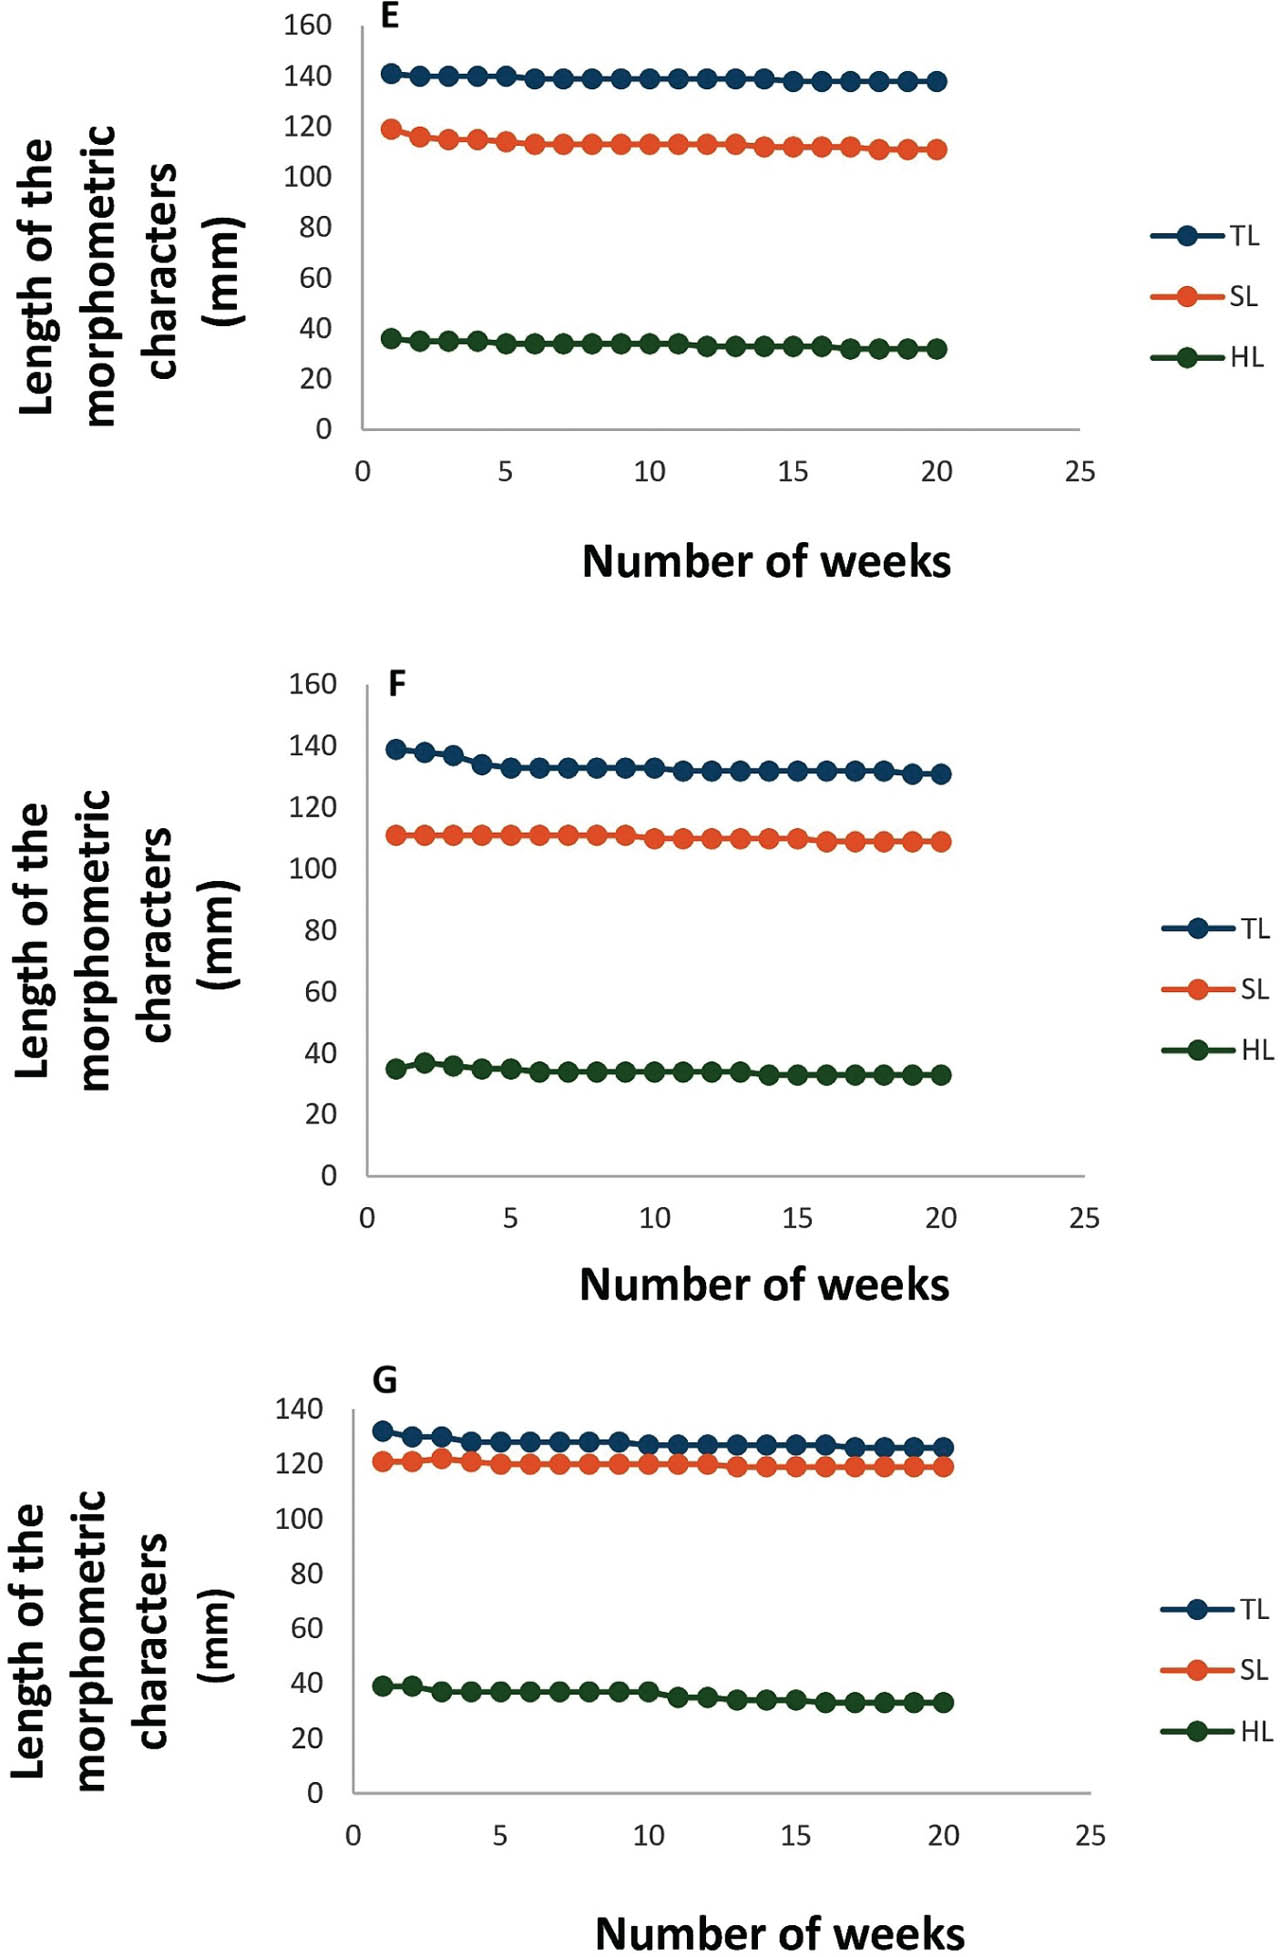
Figure 6
Influence of fixative, freezing, and preservative on the physical dimensions of O. aureus. (E) mixing 70% ethanol with tap water; (F) mixing 70% ethanol with distilled water; (G) freezing. HL, head length; SL, standard length, TL, total length.
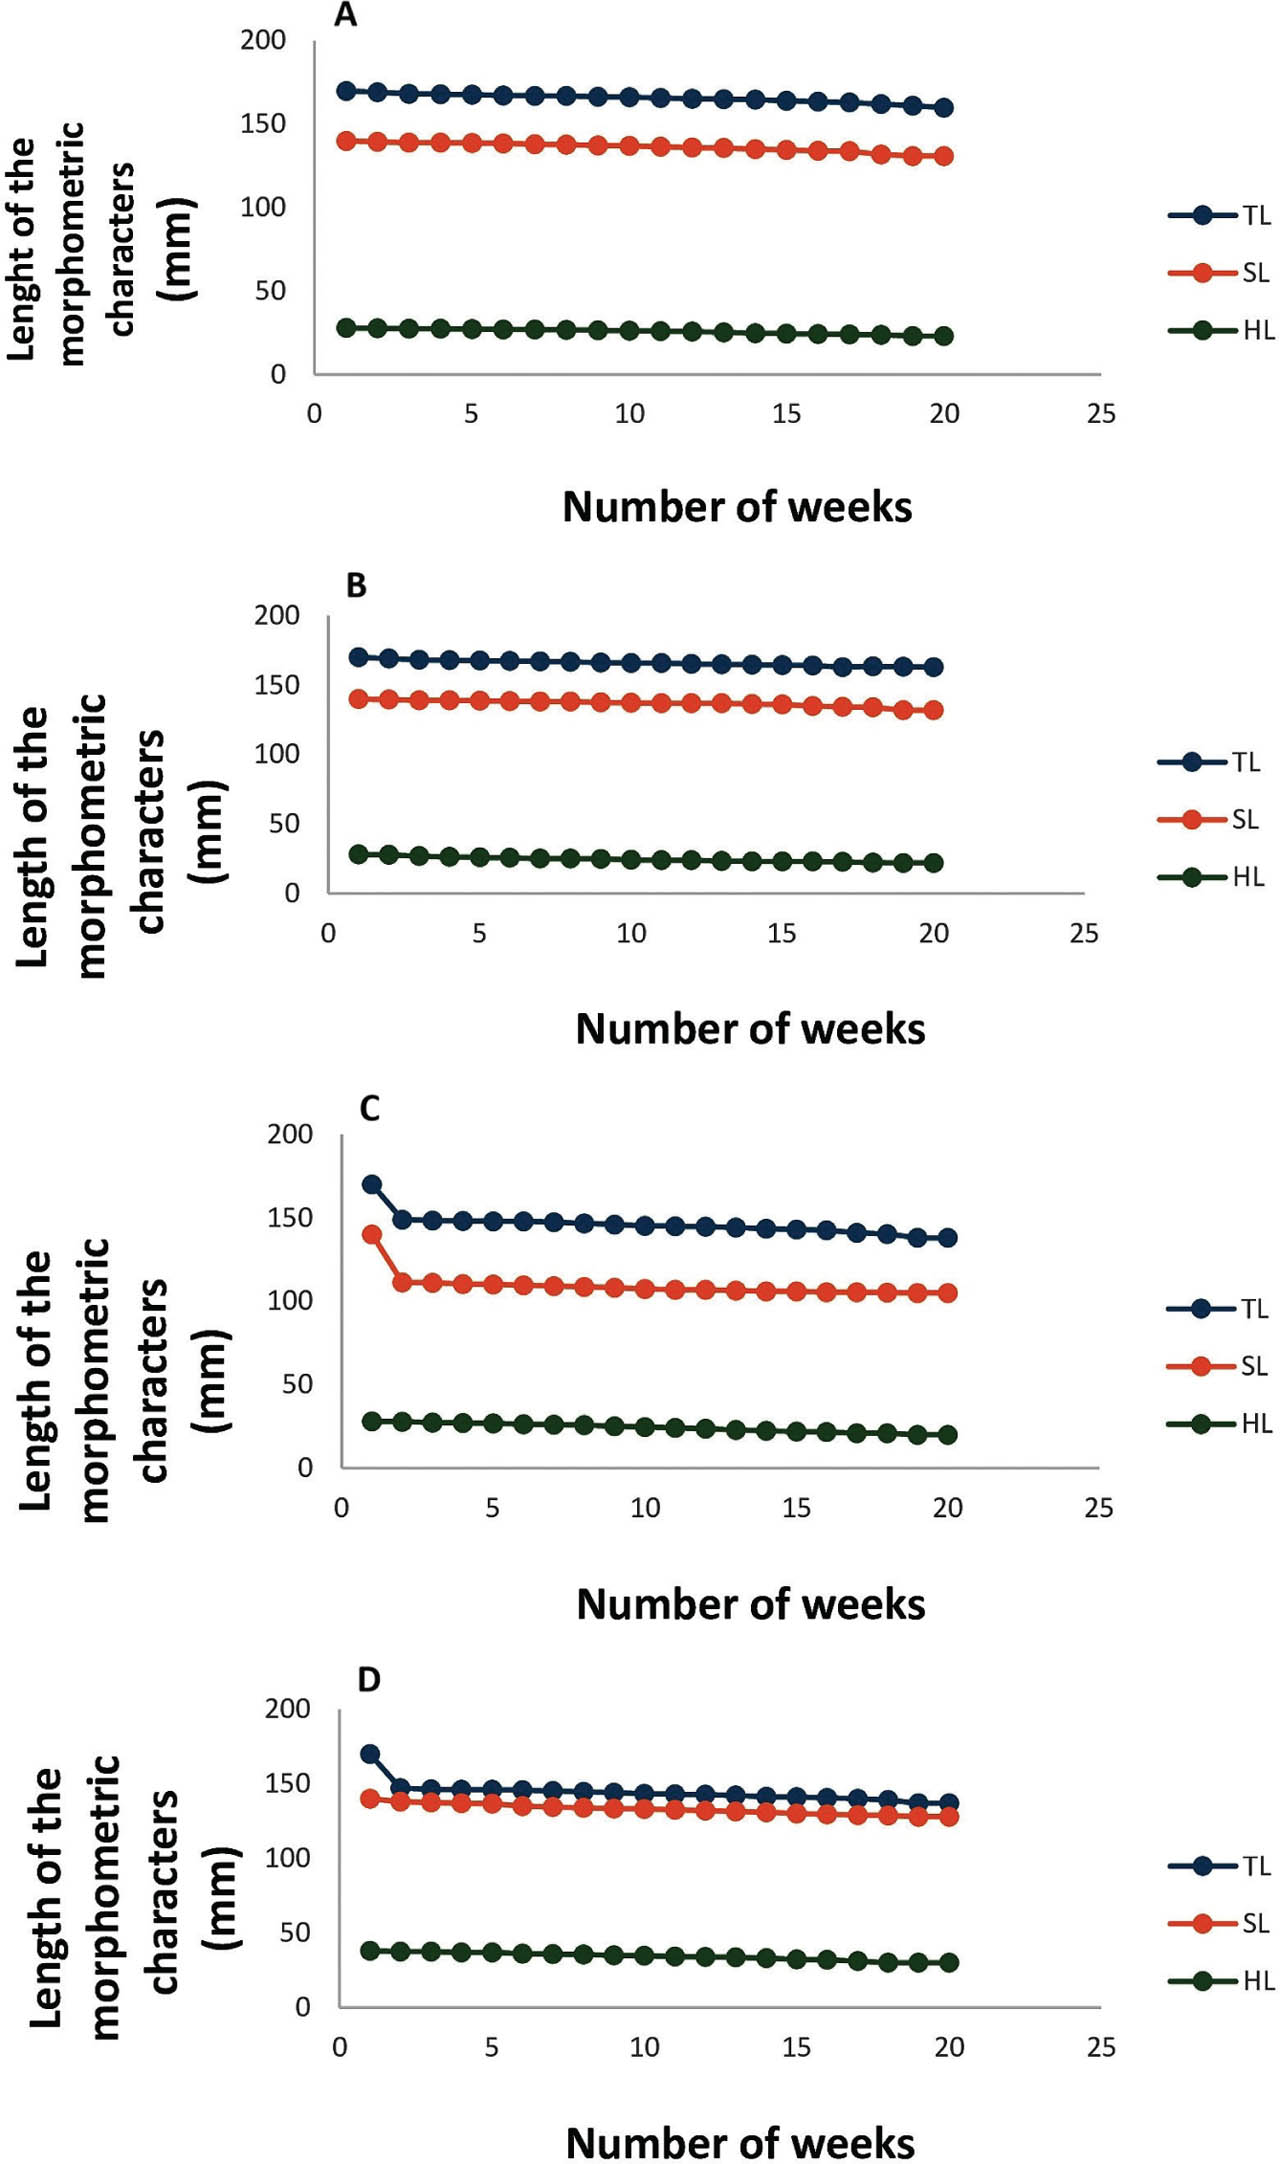
Figure 7
Influence of fixative, freezing, and preservative on the physical dimensions of O. niloticus. (A) mixing 10% formalin with tap water; (B) mixing of 10% formalin and distilled water mixture; (C) mixing 5% formalin with tap water; (D) mixing 5% formalin with distilled water. HL, head length; SL, standard length, TL, total length.
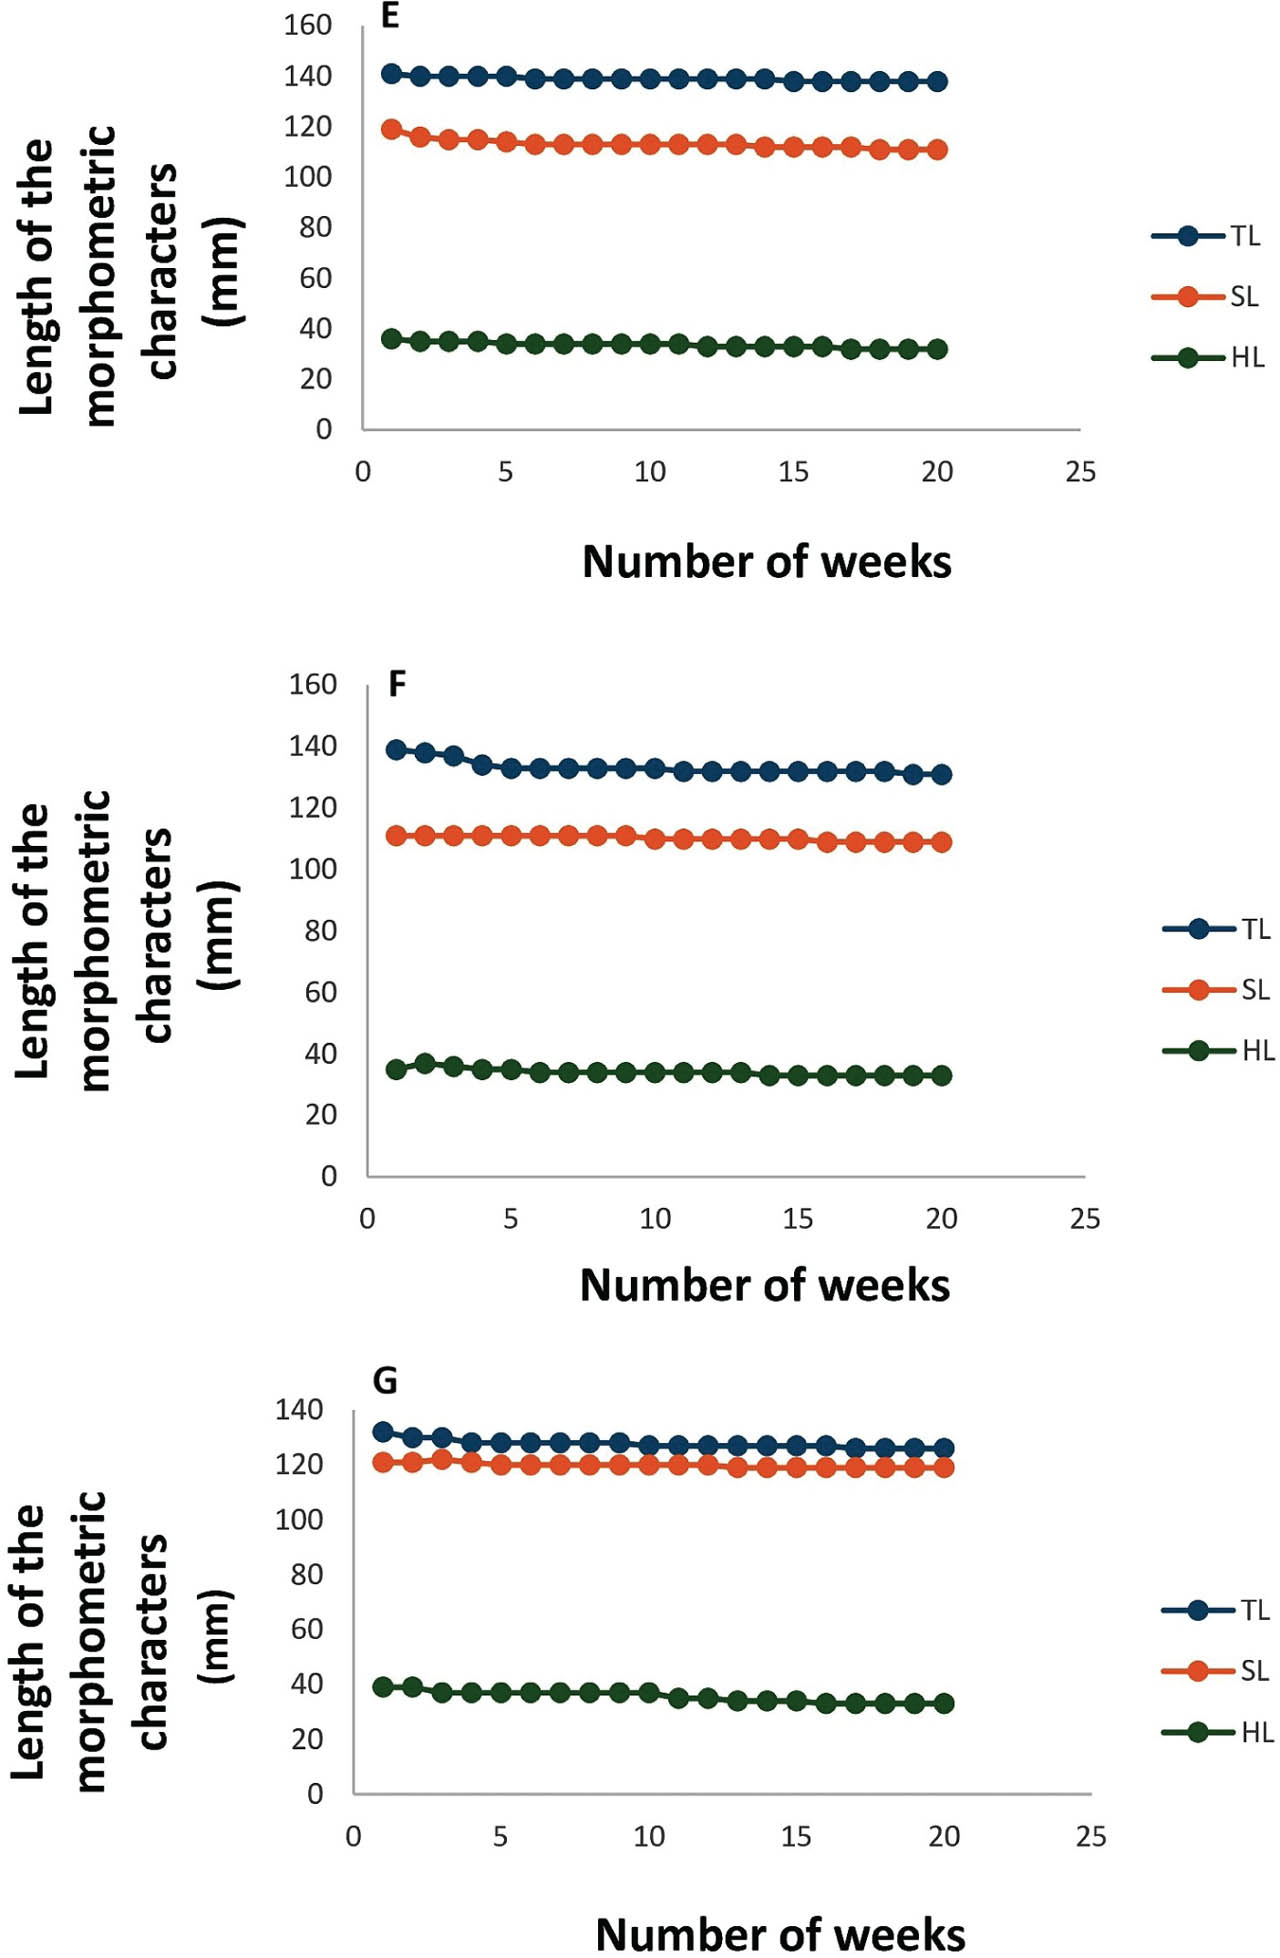
Figure 8
Influence of fixative, freezing, and preservative on the physical dimensions of O. niloticus. (E) mixing 70% ethanol with tap water; (F) mixing 70% ethanol with distilled water; (G) freezing. HL, head length; SL, standard length, TL, total length.
Table 1
Least-squares regression equations for the TL, SL, and HL of C. zillii, O. aureus, and O. niloticus obtained from the Tigris river in Al-Zubaidiyah City, Iraq, using various fixatives, preservatives, and freezing methods
| Morphometric features of species | fixative, preservative, Freezing | Equation of conversion |
|---|---|---|
| C. zillii | ||
| TL | A mixture of 10% formalin and tap water | LFT = 1.001 LTPTW + 0.432 |
| Mixture of 10% formalin and distilled water | LFT = 1.005 LTPDW + 0.229 | |
| Mixture of 70% ethanol and tap water | LFT = 1.015 LTPETW + 0.296 | |
| Mixture of 70% ethanol and distilled water | LFT = 1.012 LTPEDW + 0.332 | |
| Freezing | LFT = 1.075 LTPF + 0.663 | |
| SL | A mixture of 10% formalin and tap water | LFS = 1.009 LSPTW + 0.291 |
| Mixture of 10% formalin and distilled water | LFS = 1.007 LSPDW + 0.670 | |
| Mixture of 70% ethanol and tap water | LFS = 1.024 LSPETW + 0.852 | |
| Mixture of 70% ethanol and distilled water | LFS = 1.026 LSPEDW + 0.531 | |
| Freezing | LFS = 1.032 LSPF + 0.763 | |
| HL | A mixture of 10% formalin and tap water | LFH = 1.033 LHPTW + 0.611 |
| Mixture of 10% formalin and distilled water | LFH = 1.096 LHPDW + 0.787 | |
| Mixture of 70% ethanol and tap water | LFH = 1.094 LHPETW + 0.262 | |
| Mixture of 70% ethanol and distilled water | LFH = 1.091 LHPEDW + 0.963 | |
| Freezing | LFH = 1.097 LHPF + 0.178 | |
| O. aureus | ||
| TL | A mixture of 10% formalin and tap water | LFT = 1.018 LTPTW + 0.135 |
| Mixture of 10% formalin and distilled water | LFT = 1.017 LTPDW + 0.118 | |
| Mixture of 70% ethanol and tap water | LFT = 1.012 LTPETW + 0.210 | |
| Mixture of 70% ethanol and distilled water | LFT = 1.012 LTPEDW + 0.349 | |
| Freezing | LFT = 1.033 LTPF + 0.620 | |
| SL | A mixture of 10% formalin and tap water | LFS = 1.013 LSPTW + 0.288 |
| Mixture of 10% formalin and distilled water | LFS = 1.010 LSPDW + 0.562 | |
| Mixture of 70% ethanol and tap water | LFS = 1.020 LSPETW + 0.238 | |
| Mixture of 70% ethanol and distilled water | LFS = 1.020 LSPEDW + 0.361 | |
| Freezing | LFS = 1.040 LSPF + 0.872 | |
| HL | A mixture of 10% formalin and tap water | LFH = 1.042 LHPTW + 0.875 |
| Mixture of 10% formalin and distilled water | LFH = 1.040 LHPDW + 0.983 | |
| Mixture of 70% ethanol and tap water | LFH = 1.083 LHPETW + 0.297 | |
| Mixture of 70% ethanol and distilled water | LFH = 1.082 LHPEDW + 0.360 | |
| Freezing | FH = 1.037 LHPF + 0.194 | |
| O. niloticus | ||
| TL | A mixture of 10% formalin and tap water | LFT = 1.016 LTPTW + 0.133 |
| Mixture of 10% formalin and distilled water | LFT = 1.015 LTPDW + 0.116 | |
| Mixture of 70% ethanol and tap water | LFT = 1.014 LTPETW + 0.212 | |
| Mixture of 70% ethanol and distilled water | LFT = 1.010 LTPEDW + 0.347 | |
| Freezing | LFT = 1.035 LTPF + 0.622 | |
| SL | A mixture of 10% formalin and tap water | LFS = 1.011 LSPTW + 0.285 |
| Mixture of 10% formalin and distilled water | LFS = 1.011 LSPDW + 0.563 | |
| Mixture of 70% ethanol and tap water | LFS = 1.019 LSPETW + 0.237 | |
| Mixture of 70% ethanol and distilled water | LFS = 1.022 LSPEDW + 0.363 | |
| Freezing | LFS = 1.039 LSPF + 0.871 | |
| HL | A mixture of 10% formalin and tap water | LFH = 1.044 LHPTW + 0.877 |
| Mixture of 10% formalin and distilled water | LFH = 1.041 LHPDW + 0.984 | |
| Mixture of 70% ethanol and tap water | LFH = 1.081 LHPETW + 0.299 | |
| Mixture of 70% ethanol and distilled water | LFH = 1.084 LHPEDW + 0.361 | |
| Freezing | FH = 1.038 LHPF + 0.196 | |
[i] LFH represents HL when fresh; LFPS indicates SL preserved by freezing; LFT is TL when fresh; LFS denotes SL when fresh; LHPF is HL preserved by freezing; LHPDW refers to HL preserved in formalin-distilled water; LHPEDW is HL preserved in ethanol-distilled water; LHPETW stands for HL preserved in ethanol-tap water; LHPTW is HL preserved in formalin-tap water; LSPDW indicates SL preserved in formalin-distilled water; LSPEDW is SL preserved in ethanol-distilled water; LSPETW refers to SL preserved in ethanol-tap water; LSPTW is SL preserved in formalin-tap water; LTPF denotes TL preserved by freezing; LTPDW is TL preserved in formalin-distilled water; LTPEDW stands for TL preserved in ethanol-distilled water; LTPETW is TL preserved in ethanol-tap water; LTPTW refers to TL preserved in formalin-tap water.
At the end of the experiments, the mean TL, SL, and HL of the three cichlid species studied are: C. zillii (TL = 123.3 ± 2.71, SL = 101.1 ± 4.42, HL = 32.4 ± 1.52), O. aureus (TL = 142.1 ± 1.33, SL = 115.2 ± 1.22, HL = 32.4 ± 1.71), and O. niloticus (TL = 160.2 ± 2.43, SL = 131.1 ± 2.81, HL = 23.4 ± 1.42).
Seven types of preservative treatments had different effects on percent shrinkage in TL after 20 weeks among the three cichlid species. O. niloticus experienced the greatest shrinkage, ranging from 3.25% (freezing) to 19.41% (5% formalin in distilled water). A one-way ANOVA test showed significant differences among the seven treatments with O. niloticus (F (6, 6) = 36.14, p < 0.001). Post-hoc comparisons indicated that 5% formalin in both tap and distilled water treatments were significantly greater in shrinkage (~19%) than all other treatments, whereas in freezing, 10% formalin, and 70% ethanol (dist.) were the least (3%–6%). Conversely, C. zillii had reduced shrinkage ranging from −2.22% to 9.56% with a marginally significant ANOVA result (F (6, 6) = 3.16, p = 0.045), but no significant pairwise differences were detected in the post-hoc tests. O. aureus shrinkage values ranged from −1.31% to 5.76%, and no differences were detected among preservatives in terms of TL (F (6, 6) = 1.93, p = 0.221), SL (F (6, 6) = 1.21, p = 0.409), or HL (F (6, 6) = 2.58, p = 0.135). Collectively, these results indicate a species-specific response to preservation, with O. niloticus being the most sensitive and O. aureus being the least sensitive to the types of preservative. But, since only one replicate per treatment was utilized for each species, these results should be viewed cautiously and additional replication with larger sample sizes is recommended to further assess these trends.
These length shrinkages were confirmed with least squares regression analysis for the fixation length loss, preservation length loss, and freezing length loss obtained for the range of fish sizes analyzed (Table 1). In all species, the slopes were significantly higher than 1, indicatingthat, in all cases, the shrinkage loss grew proportionally to larger fish sizes.
5. Discussion
Results of this study showed that fixation, preservation, and freezing affect fish body proportions in C. zillii, O. aureus, and O. niloticus. The finding that fish preservation exhibited shrinkage supports the results of several studies from past years (Al-Hassan et al., 2000; Al-Mamry et al., 2011; Gaston et al., 2013; Jawad et al., 2020; Lee et al., 2012). The causes of the contractions induced by the fixation process are possibly because: (1) dehydration of tissues during freezing, thawing, and ethanol exposure (Ogle, 2009), or (2) the breakdown of skeletal systems by formaldehyde (Gagliano et al., 2006; Paradis et al., 2007). In addition, the preservation method itself could be a contributing factor. The results reported here should be borne in mind and will affect any future inferences from morphometric studies in biology.
Figs 2–4 demonstrated that the intensity of dissimilarity levels varied among the three species studied, as well as across different parts of the fish body, similar to findings in other studies (Al-Hassan et al., 2000; Jawad, 2003; Leslie & Moore, 1986). In this study, HL decreased by 4.5%–30.8% in C. zillii and by 15.6%–17.9% in O. aureus. This differs from Leslie and Moore (1986), who proposed that reduced shrinkage in HL is a consequence of the presence of perhaps very thin layers of soft tissue, such as muscles.
The current study primarily observed a trend of reduction, as supported by Sayers (1987). Conversely, Billy (1982); Al-Hassan and Abdullah (1992), and Al-Hassan et al. (1999, 2000) indicated a minimal positive standard-length change, or that samples did not shrink, when other fish were fixed with formalin and ethyl alcohol. Our dissimilar results regarding the timing and magnitude of shrinkage across different species reveal the species-specificity of the reaction to preservation.
The same attention should be given to the analyses of populations or stocks at an intraspecific scale, since the minimal differences that the preservation process can cause might be misinterpreted as the natural and minimal variation that would be expected a priori. These potential issues could skew the results. Regarding these concerns, Berbel-Filho et al. (2013) had already reported this same issue when they observed that individuals of the peacock bass, Cichla kelberi Kullander & Ferreira, 2006, presented statistically significant differences in geometric properties before and after preservation by freezing and alcohol.
The findings reported in the present study represent the first set of shrinkage correction formulae for adult C. zillii, O. aureus, and O. niloticus inhabiting riverine systems in Iraq. Furthermore, Buchheister and Wilson (2005) demonstrated that specimens of Mallotus villosus, Theragra chalcogramma, and Thaleichthys pacificus shrank more in formalin than when exposed to ethanol, and that freezing resulted in the least shrinkage. The current experimental findings support those of Buchheister and Wilson (2005) and point to freezing as another similarly reliable method for preserving specimens of the species of concern for use in future morphometric analyses. Freezing is suitable for analyses of gastric contents, condition factor, otoliths, and stable isotopes. Accordingly, freezing should be viewed as a routine practice for preserving fish for use in morphometric studies. It is also easy and inexpensive to manage and has no adverse health effects.
Fresh fish are not always available, and sometimes fish from museum collections are required for morphological studies. A comprehensive study of the effects of fixation, preservation, and freezing on the morphology of such samples involves a comparison of fresh fish with three subsamples: one fixed in formalin, one stored in ethanol, and one frozen at different temperatures (Al Fatle et al., 2025b, 2026b). Morphological characteristics such as body length, weight, fin morphology, and color are compared before and after treatment, with high-resolution imaging and 3D scanning used to detect minor alterations in morphology, along with histological analysis to assess tissue damage (Al Fatle & Jawad, 2025a). Researchers have noted the usefulness of developing equations to calculate the effects of preservation (Simon, 2013), and this is more readily achievable with linear measures such as mass and length (Martinez et al., 2013). The correction formulae derived here should prove useful to workers where fresh samples are not available and only preserved specimens are at hand. At such times, these formulae may be used to convert morphometric data of preserved specimens to the expected values of fresh specimens and thus enable comparative studies using historic and museum collections.
6. Conclusion
This study demonstrates that fixation, preservation, and freezing induce significant and species-specific shrinkage in the body measurements of C. zillii, O. aureus, and O. niloticus, with the extent of shrinkage varying according to the treatment, the body part measured, and the size of the fish. Shrinkage being proportional to fish size, and the marked difference among preservatives highlight the need to consider these artifacts in morphometric studies. Notably, the finding that freezing causes minimal and, in some cases, non-significant shrinkage positions it as a particularly viable and practical preservation method for these species, especially for subsequent analyses of gastric contents, otoliths, and stable isotopes. This is the first research to provide shrinkage correction formulae for these river fish from Iraq, and so the present results offer a valuable tool for future studies on these fish that may wish to account for the potential effect of preservation and thus distinguish between genuine biological variation and errors introduced by specimen preservation. This is particularly relevant for intraspecific comparisons, as misinterpretation could lead to biological misunderstandings of the populations/stocks. The species-specific responses observed further highlight the importance of validating preservation effects for each species under investigation rather than relying on generalized assumptions.
Notes
[3] Contributed by Author contributions
Fatema Ali Al Fatle: Conceptualization; data curation; investigation; methodology; project administration; resources; writing original draft; writing review; and editing.
Hind Dyia Hadi: statistical analyses; investigation; and methodology.
Ali Hayder Badri: statistical analyses; investigation; and methodology.
Laith A. Jawad: Conceptualization; formal analysis; investigation; methodology; project administration; supervision; validation; visualization; writing original draft; writing review; and editing.