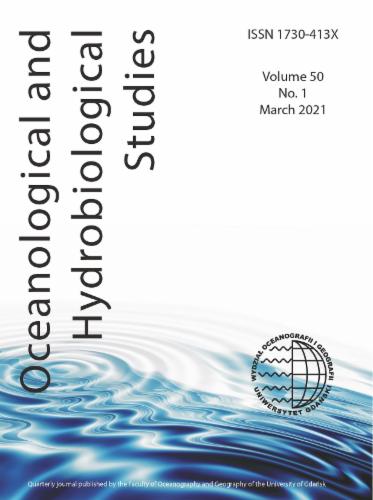
Figure 1

Figure 2

Figure 3
![Histograms of temperature [°C] at coastal (A) and open sea stations (B) in the southern Baltic Sea.](https://sciendo-parsed.s3.eu-central-1.amazonaws.com/67ff4c35df7b4851cb85beb4/j_oahs-2025.1.06_fig_003.jpg?X-Amz-Algorithm=AWS4-HMAC-SHA256&X-Amz-Content-Sha256=UNSIGNED-PAYLOAD&X-Amz-Credential=ASIA6AP2G7AKPWNNMSJZ%2F20251212%2Feu-central-1%2Fs3%2Faws4_request&X-Amz-Date=20251212T002827Z&X-Amz-Expires=3600&X-Amz-Security-Token=IQoJb3JpZ2luX2VjEC8aDGV1LWNlbnRyYWwtMSJHMEUCIQDaFkKSNCVBhDsTZHGwld9g9k2A1Srk8bROfDlxbVxDfAIgSVRBhgb7qQoU4a7%2BzzyRAU4Xx0wy9AuOc8ln0MhNj0QqxgUI%2BP%2F%2F%2F%2F%2F%2F%2F%2F%2F%2FARACGgw5NjMxMzQyODk5NDAiDJXfe4g81h%2Fp%2BWBcMSqaBR%2FGP0VLdbz1hajdxD4mM0IXIAz34k%2F5CTORbVDcX0kHioqJrFrOL4X2K%2FBTl07Z9LZLM8vssSeBERmhE4i2ZUFz7mRkC80hQEQL1WJolNI9HLxsED1AFI4fKpmkxDnJebq9P1G%2FXXJE3vnz74iIhCo1xvh%2FSh%2F4btL2HOh6oQ8h9McJqZQNaqp2%2BN5Y2dFKxQPYjIKgo%2FqE%2B3LBo7y%2F3nCzYypWo2E2f1qcP6XFpPhX9b%2F2l6rLC6jO9Gb1zcjMaNMHeqXiu%2FVi%2BLzWpSxR%2Fnh8xT09%2BgVYMk5%2Fij1%2BCYuc%2FlAPjEyvvQ1kG53znLnF4P8JVYehQevZ7BrrUnrB4vXhdu3RKXINbHF429O%2BZST%2B6BX9Sr7ogw9FNIVVyFHMstPSJ0FkAh6B3QphfBiTX2vIQcOsumu7%2FRVN%2B2RndFT9tpNwXsmNOGIw%2BbdcE%2FbHMjb89fZZ%2Fr4htttiveEHw9fuUtpBwWhdcs8J5VB5y0VAYqXx7RWvRws%2FEIAIc0Y03b1uNFgGuOqGSdSF0lXexbuKMjm9wV76wmNDWiJnpIJpGkBI7ekG%2BXrFHf7Lp45YuOwdUvsVAm%2BiNY3h7P3LB3Bgj5j%2F9FjaUm3546H9xUBEiilRNkKHe2hVbRpIfY8YLnWLy30VjbXj7Sgzg9DjLEEivmOhvGaWejek%2FANqOSLiVAp63rKUdnsNJC6etl1Dbon5ie26JU%2F2NP1lfghR7hUDZ3SMrUZJ0GNQvokSExhjzivjaQ2LVBLr7hj6gptVZ5B0r0pOdUl7gAzIEhkBpykVhpHV3Tgg6UajWqh80sv52EWMUm%2BBIZ1wjekXA9x4ZfIUH%2FCQ4qbmRwGHCeGqTl4rdIJW9gViJ0HSo8Fh0Ye35ZJ1l67lYrwWszDkk%2B3JBjqxAWz0V0VeuxhkpR8tiDI5AEWsTZUsTZeF28EDKM2ciTR%2BNYJy6xST%2BgKMU77QyO4F8JH6oCfm9mzsdznUKY6HKx2zL2%2BGaZdjKA9tbuD%2F1yduKZB%2BPybQ37NsP88%2BCuouL83pZR6btNw1z52Noh9AHDT2xAPlUA1fGnNmqypbZv3Ww7lwq7ZAekO1QqJtJCN61EwFwRv%2BhY3U04CY2nSnsTsFdeXRiUqu6jl28rRYYneMTw%3D%3D&X-Amz-Signature=625faff375ae0fdcffa143460c6ed41c559c044887994de79631fef690611b6d&X-Amz-SignedHeaders=host&x-amz-checksum-mode=ENABLED&x-id=GetObject)
Figure 4
![Significant wave height [m] distribution for both stations.](https://sciendo-parsed.s3.eu-central-1.amazonaws.com/67ff4c35df7b4851cb85beb4/j_oahs-2025.1.06_fig_004.jpg?X-Amz-Algorithm=AWS4-HMAC-SHA256&X-Amz-Content-Sha256=UNSIGNED-PAYLOAD&X-Amz-Credential=ASIA6AP2G7AKPWNNMSJZ%2F20251212%2Feu-central-1%2Fs3%2Faws4_request&X-Amz-Date=20251212T002827Z&X-Amz-Expires=3600&X-Amz-Security-Token=IQoJb3JpZ2luX2VjEC8aDGV1LWNlbnRyYWwtMSJHMEUCIQDaFkKSNCVBhDsTZHGwld9g9k2A1Srk8bROfDlxbVxDfAIgSVRBhgb7qQoU4a7%2BzzyRAU4Xx0wy9AuOc8ln0MhNj0QqxgUI%2BP%2F%2F%2F%2F%2F%2F%2F%2F%2F%2FARACGgw5NjMxMzQyODk5NDAiDJXfe4g81h%2Fp%2BWBcMSqaBR%2FGP0VLdbz1hajdxD4mM0IXIAz34k%2F5CTORbVDcX0kHioqJrFrOL4X2K%2FBTl07Z9LZLM8vssSeBERmhE4i2ZUFz7mRkC80hQEQL1WJolNI9HLxsED1AFI4fKpmkxDnJebq9P1G%2FXXJE3vnz74iIhCo1xvh%2FSh%2F4btL2HOh6oQ8h9McJqZQNaqp2%2BN5Y2dFKxQPYjIKgo%2FqE%2B3LBo7y%2F3nCzYypWo2E2f1qcP6XFpPhX9b%2F2l6rLC6jO9Gb1zcjMaNMHeqXiu%2FVi%2BLzWpSxR%2Fnh8xT09%2BgVYMk5%2Fij1%2BCYuc%2FlAPjEyvvQ1kG53znLnF4P8JVYehQevZ7BrrUnrB4vXhdu3RKXINbHF429O%2BZST%2B6BX9Sr7ogw9FNIVVyFHMstPSJ0FkAh6B3QphfBiTX2vIQcOsumu7%2FRVN%2B2RndFT9tpNwXsmNOGIw%2BbdcE%2FbHMjb89fZZ%2Fr4htttiveEHw9fuUtpBwWhdcs8J5VB5y0VAYqXx7RWvRws%2FEIAIc0Y03b1uNFgGuOqGSdSF0lXexbuKMjm9wV76wmNDWiJnpIJpGkBI7ekG%2BXrFHf7Lp45YuOwdUvsVAm%2BiNY3h7P3LB3Bgj5j%2F9FjaUm3546H9xUBEiilRNkKHe2hVbRpIfY8YLnWLy30VjbXj7Sgzg9DjLEEivmOhvGaWejek%2FANqOSLiVAp63rKUdnsNJC6etl1Dbon5ie26JU%2F2NP1lfghR7hUDZ3SMrUZJ0GNQvokSExhjzivjaQ2LVBLr7hj6gptVZ5B0r0pOdUl7gAzIEhkBpykVhpHV3Tgg6UajWqh80sv52EWMUm%2BBIZ1wjekXA9x4ZfIUH%2FCQ4qbmRwGHCeGqTl4rdIJW9gViJ0HSo8Fh0Ye35ZJ1l67lYrwWszDkk%2B3JBjqxAWz0V0VeuxhkpR8tiDI5AEWsTZUsTZeF28EDKM2ciTR%2BNYJy6xST%2BgKMU77QyO4F8JH6oCfm9mzsdznUKY6HKx2zL2%2BGaZdjKA9tbuD%2F1yduKZB%2BPybQ37NsP88%2BCuouL83pZR6btNw1z52Noh9AHDT2xAPlUA1fGnNmqypbZv3Ww7lwq7ZAekO1QqJtJCN61EwFwRv%2BhY3U04CY2nSnsTsFdeXRiUqu6jl28rRYYneMTw%3D%3D&X-Amz-Signature=af27c532c060eff258817cf72bc762eb53a28f8cd52dbc36af43188d7adba782&X-Amz-SignedHeaders=host&x-amz-checksum-mode=ENABLED&x-id=GetObject)
Figure 5
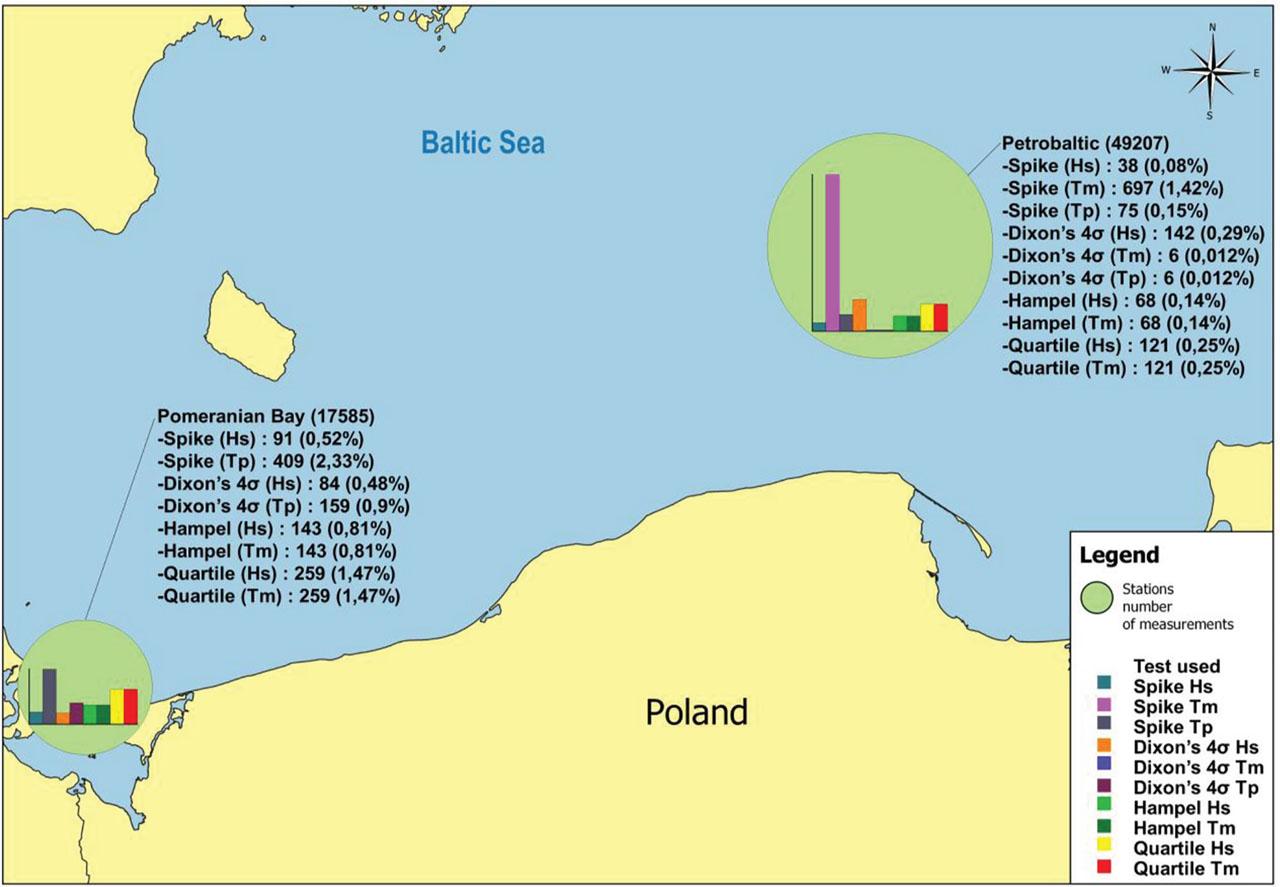
Figure 6
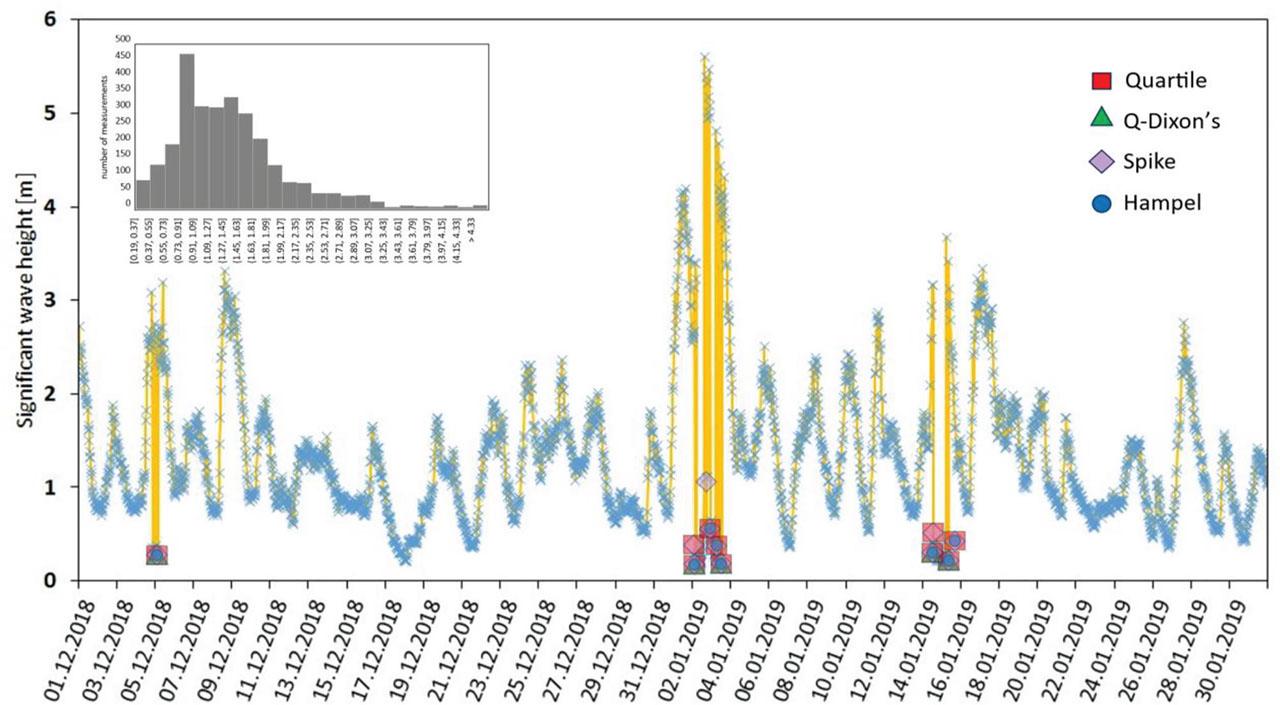
Figure 7

Figure 8
Figure 9

Figure 10

Figure 11
Proposed and determined new limit values for the non-storm season in the open waters of the Baltic Sea, based on measurement data from the Pomeranian Bay point
| Proposed value (Copernicus) | 99th percentile of result | Proposed value | Number of records | Percentage of measurements flagged (%) | |
|---|---|---|---|---|---|
| Hs | 3 | 0.52 | 0.55 m | 64 | 0.787 |
| Tp | 10 | 3.6 | 4.0 s | 235 | 2.889 |
Number of flagged measurements in the Dixon’s 4σ result at the Petrobaltic point
| Sezon sztormowy (n = 28667) | Sezon bezsztormowy (n = 20540) | ||||||||
|---|---|---|---|---|---|---|---|---|---|
| Sr−4Q | Sr + 4Q | Number of records flagged | Percentage of records flagged (%) | Sr−4Q | Sr + 4Q | Number of records flagged | Percentage of records flagged (%) | ||
| Hs | −1.88 | 4.67 | 41 | 0.14 | Hs | −1.48 | 3.04 | 101 | 0.49 |
| Tm | 0.52 | 7.32 | 2 | 0.01 | Tm | 0.49 | 6.1 | 4 | 0.02 |
| Tp | 0.24 | 11.24 | 5 | 0.02 | Tp | −0.2 | 9.76 | 1 | 0.00 |
Proposed and determined new limit values for the storm season in the open waters of the Baltic Sea, based on measurement data from the Petrobaltic point
| Proposed value (Copernicus) | 99th percentile of result | Proposed value | Number of records | Percentage of measurements flagged (%) | |
|---|---|---|---|---|---|
| Hs | 3 | 5.49 | 5.5 m | 37 | 0.129 |
| Tm | 4 | 9.97 | 10.0 s | 12 | 0.042 |
| Tp | 10 | 17.37 | 18.0 s | 4 | 0.014 |
The total number of outlier measurements for the tests performed for the significant wave height parameter
| Test | Spike | Dixon’s 4σ | Hampel | Quartile |
|---|---|---|---|---|
| Spike | 129 | 38 | 126 | 118 |
| Dixon’s 4σ | 38 | 226 | 29 | 117 |
| Hampel | 126 | 29 | 211 | 207 |
| Quartile | 118 | 117 | 207 | 380 |
Proposed and determined new limit values for the non-storm season in the open waters of the Baltic Sea, based on measurement data from the Petrobaltic point
| Proposed value (Copernicus) | 99th percentile of result | Proposed value | Number of records | Percentage of measurements flagged (%) | |
|---|---|---|---|---|---|
| Hs | 3 | 3.54 | 3.5 m | 1 | 0.005 |
| Tm | 4 | 4.69 | 5.0 s | 685 | 3.335 |
| Tp | 10 | 19.29 | 20.0 s | 71 | 0.346 |
The results of outlier identification at open sea stations—Dixon’s 4σ
| Name of the stations | Measurement date | Season | Depth | The temperature measurement result | Dixon’s 4σ | ||
|---|---|---|---|---|---|---|---|
| Control range | Assessment result | ||||||
| μ − 4σ | μ + 4σ | ||||||
| L7 | 28.05.2007 | Spring | 2.5 | 15.5 | −5.9 | 14.9 | Attention |
| L7 | 28.05.2007 | Spring | 5 | 15.6 | −5.9 | 14.9 | Attention |
| P1 | 07.08.1961 | Summer | 50 | 13.4 | −3.9 | 12.5 | Attention |
| P1 | 17.10.1990 | Autumn | 70 | 12.8 | −2.1 | 11.5 | Attention |
| P110 | 29.07.1984 | Summer | 68 | 12.5 | −2.3 | 11.0 | Attention |
| P110 | 10.09.1985 | Autumn | 68 | 15.4 | −3.9 | 15.2 | Attention |
| P110 | 24.07.1990 | Summer | 60 | 16.6 | −6.2 | 14.8 | Attention |
| P110 | 09.07.1993 | Summer | 68 | 14.3 | −2.3 | 11.0 | Attention |
| P110 | 12.08.2005 | Summer | 60 | 14.9 | −6.2 | 14.8 | Attention |
| P110 | 07.09.2006 | Autumn | 67 | 16.6 | −3.9 | 15.2 | Attention |
| P116 | 27.09.1978 | Autumn | 70 | 13.1 | −2.0 | 11.9 | Attention |
| P116 | 29.07.1984 | Summer | 50 | 13.4 | −4.2 | 12.9 | Attention |
| P116 | 09.07.1993 | Summer | 50 | 13.7 | −4.2 | 12.9 | Attention |
| P116 | 09.07.1993 | Summer | 60 | 13.4 | −3.1 | 10.5 | Attention |
| P116 | 09.07.1993 | Summer | 70 | 12.2 | −1.1 | 9.0 | Attention |
| P116 | 07.09.2006 | Autumn | 60 | 17.1 | −5.9 | 16.6 | Attention |
| P140 | 06.08.2007 | Summer | 40 | 9.9 | −0.5 | 9.5 | Attention |
| P140 | 31.05.2016 | Spring | 2.5 | 13.8 | −5.7 | 13.6 | Attention |
| P140 | 31.05.2016 | Spring | 5 | 13.8 | −5.7 | 13.6 | Attention |
| P140 | 31.05.2016 | Spring | 10 | 13.8 | −5.7 | 13.6 | Attention |
| R4 | 28.05.2007 | Spring | 1 | 17.0 | −7.0 | 16.5 | Attention |
| R4 | 28.05.2007 | Spring | 2.5 | 17.0 | −6.4 | 15.3 | Attention |
| R4 | 28.05.2007 | Spring | 5 | 16.9 | −6.4 | 15.3 | Attention |
Number of flagged measurements in the Dixon’s 4σ result at the Pomeranian Bay point
| Sezon sztormowy (n = 9452) | Sezon bezsztormowy (n = 8133) | ||||||||
|---|---|---|---|---|---|---|---|---|---|
| Sr−4Q | Sr + 4Q | Number of records flagged | Percentage of records flagged (%) | Sr−4Q | Sr + 4Q | Number of records flagged | Percentage of records flagged (%) | ||
| Hs | −2.19 | 4.13 | 67 | 0.71 | Hs | −1.72 | 3.6 | 17 | 0.21 |
| Tp | −2.07 | 9.89 | 76 | 0.80 | Tp | −1.37 | 9.21 | 83 | 1.02 |
The impact of identifying outlier measurements on the results of statistical analyses in relation to temperature measurements at the Kołobrzeg station in August 2006
| Parameter | Test | Number of observations | Statistical values | ||||
| All | Outliers | Used to calculate statistical values | Mean | Median | Standard deviation | ||
| Temperature of water in coastal station Kołobrzeg in August 2006 | Zero trial | 31 | 0 | 31 | 19.96 | 20 | 0.76 |
| Spike, Hampel, Q-Dixon and Quartile | 2 | 29 | 19.95 | 20 | 0.53 | ||
Proposed spike test limits for temperature results at southern Baltic coast stations
| Limit value for the test | 99th percentile score | Proposed limit value | Number of records flagged | Percent of records flagged (%) | |
|---|---|---|---|---|---|
| Temperature measurements at coastal stations | 6 | 1.5 | 2 | 703 | 0.37 |
The results of outlier identification at coastal stations—Dixon’s 4σ
| Name of the stations | Measurement date | Season | The temperature measurement result | Dixon’s 4σ | ||
|---|---|---|---|---|---|---|
| Control range | Assessment result | |||||
| μ − 4σ | μ + 4σ | |||||
| Gdynia | 01.06.1962 | Summer | 5.9 | 6.01 | 29.14 | Attention |
| Gdynia | 12.06.1978 | Summer | 5.5 | 6.01 | 29.14 | Attention |
| Hel | 01.06.1980 | Summer | 4.6 | 5.86 | 27.76 | Attention |
| Międzyzdroje | 10.06.1955 | Summer | 8.6 | 9.13 | 26.70 | Attention |
| Puck | 01.06.1976 | Summer | 9 | 9.09 | 29.42 | Attention |
| Puck | 17.06.1982 | Summer | 8.9 | 9.09 | 29.42 | Attention |
| Puck | 23.06.1982 | Summer | 8.6 | 9.09 | 29.42 | Attention |
| Świnoujście | 04.12.1960 | Winter | 8.4 | −4.54 | 8.02 | Attention |
The impact of identifying outlier measurements on the results of statistical analyses in relation to temperature measurements at coastal stations in the years 1946–2019
| Parameter | Test | Number of observations | Statistical values | ||||
|---|---|---|---|---|---|---|---|
| All | Outliers | Used to calculate statistical values | Mean | Median | Standard deviation | ||
| Temperature of water in coastal stations | Zero trial | 190,967 | 0 | 190967 | 9.47 | 8.80 | 6.64 |
| Spike | 703 | 190264 | 9.46 | 8.80 | 6.64 | ||
| Dixon’s 4σ | 8 | 190959 | 9.47 | 8.80 | 6.64 | ||
| Q-Dixon | 282 | 190685 | 9.48 | 8.80 | 6.64 | ||
| Hampel | 7649 | 183318 | 9.56 | 9.00 | 6.61 | ||
| Quartile | 931 | 190036 | 9.48 | 8.80 | 6.64 | ||
Area and range of analyses
| Area of tests | Research period | Parameter | Number of stations | Number of analysed results |
|---|---|---|---|---|
| Coastal stations | 1946–2019 | Water temperature | 8 | 190,967 |
| Open sea stations | 1959–2019 | Water temperature | 18 | 40,651 |
| 2018–2021 | Wave | 2 | 66,792 |
The impact of identifying outlier measurements on the results of statistical analyses in relation to temperature measurements at open sea stations from 1959 to 2019
| Parameter | Test | Number of observations | Statistical values | ||||
|---|---|---|---|---|---|---|---|
| All | Outliers | Used to calculate statistical values | Mean | Median | Standard deviation | ||
| Temperature of water in open sea stations | Zero trial | 40.651 | 0 | 40.651 | 7.57 | 5.65 | 5.20 |
| Gradient | 304 | 40.347 | 7.55 | 5.64 | 5.18 | ||
Summary of the results of the spike test formula according to Copernicus for the entire Baltic Sea area
| test value = | V2 − (V3 + V1)/2 | − | (V3 − V1)/2 | Wave parameter: | Spike test result according to Copernicus for the entire Baltic Sea area: |
|---|---|
| Hs | 3 |
| Tm | 4 |
| Tp | 10 |
Proposed and determined new limit values for the storm season in the open waters of the Baltic Sea, based on measurement data from the Pomeranian Bay point
| Proposed value (Copernicus) | 99th percentile of result | Proposed value | Number of records | Percentage of measurements flagged (%) | |
|---|---|---|---|---|---|
| Hs | 3 | 0.74 | 0.8 m | 27 | 0.286 |
| Tp | 10 | 4.35 | 4.5 s | 174 | 1.841 |
The number of outlier measurements common to the tests
| Type of test | Spike | Dixon’s 4σ | Q-Dixon | Hampel | Quartile |
|---|---|---|---|---|---|
| Spike | 703 | 2 | 51 | 137 | 32 |
| Dixon’s 4σ | 2 | 8 | 0 | 3 | 0 |
| Q-Dixon | 51 | 0 | 282 | 246 | 118 |
| Hampel | 137 | 3 | 246 | 7649 | 922 |
| Quartile | 32 | 0 | 118 | 922 | 931 |
Proposed gradient test limits for temperature results at southern Baltic open sea stations
| Limit value for the test | 99th percentile score | Proposed limit value | Number of records flagged | Percent of records flagged (%) | |
|---|---|---|---|---|---|
| Temperature measurements at open sea stations | 9 | 4.7 | 5 | 304 | 0.75 |
The total number of outlier measurements for the tests performed for the mean wave period parameter
| Test | Spike | Dixon’s 4σ | Hampel | Quartile |
|---|---|---|---|---|
| Spike | 484 | 47 | 198 | 377 |
| Dixon’s 4σ | 47 | 165 | 151 | 162 |
| Hampel | 198 | 151 | 211 | 209 |
| Quartile | 377 | 162 | 209 | 380 |