Figure 1
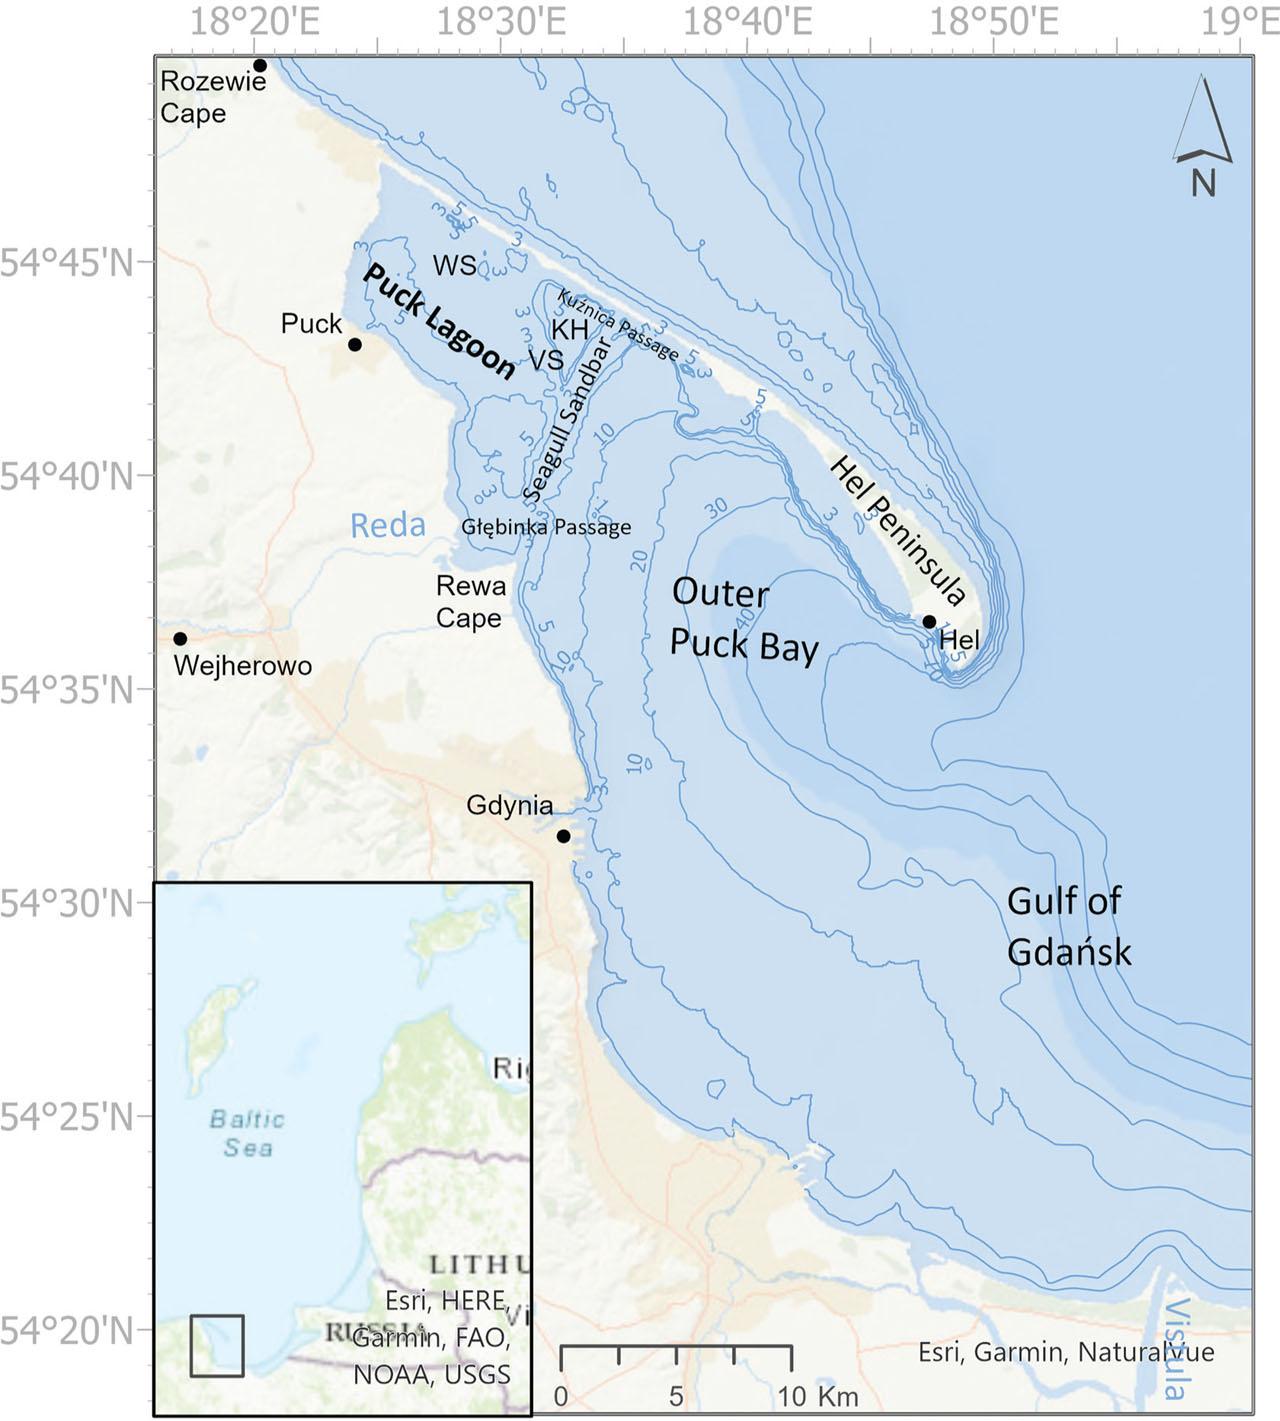
Figure 2
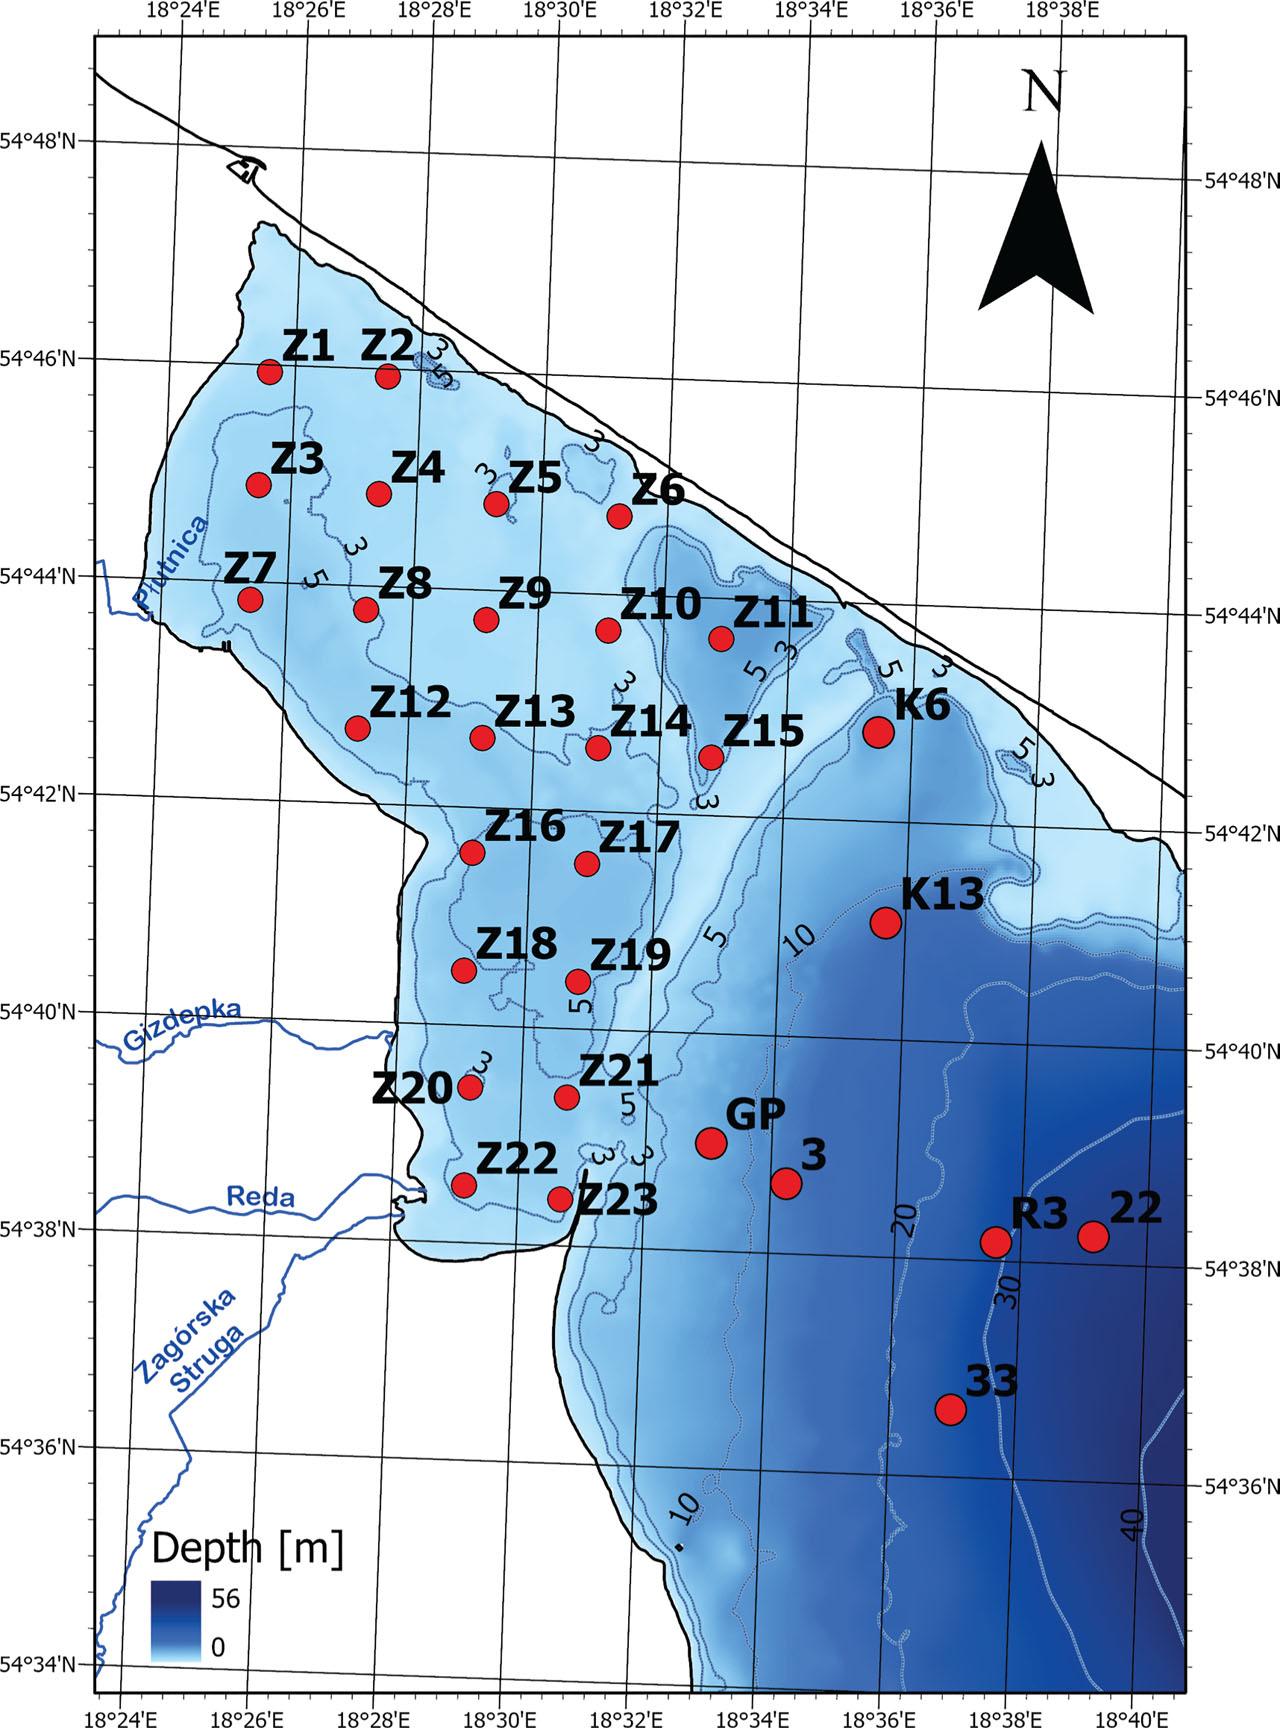
Figure 3
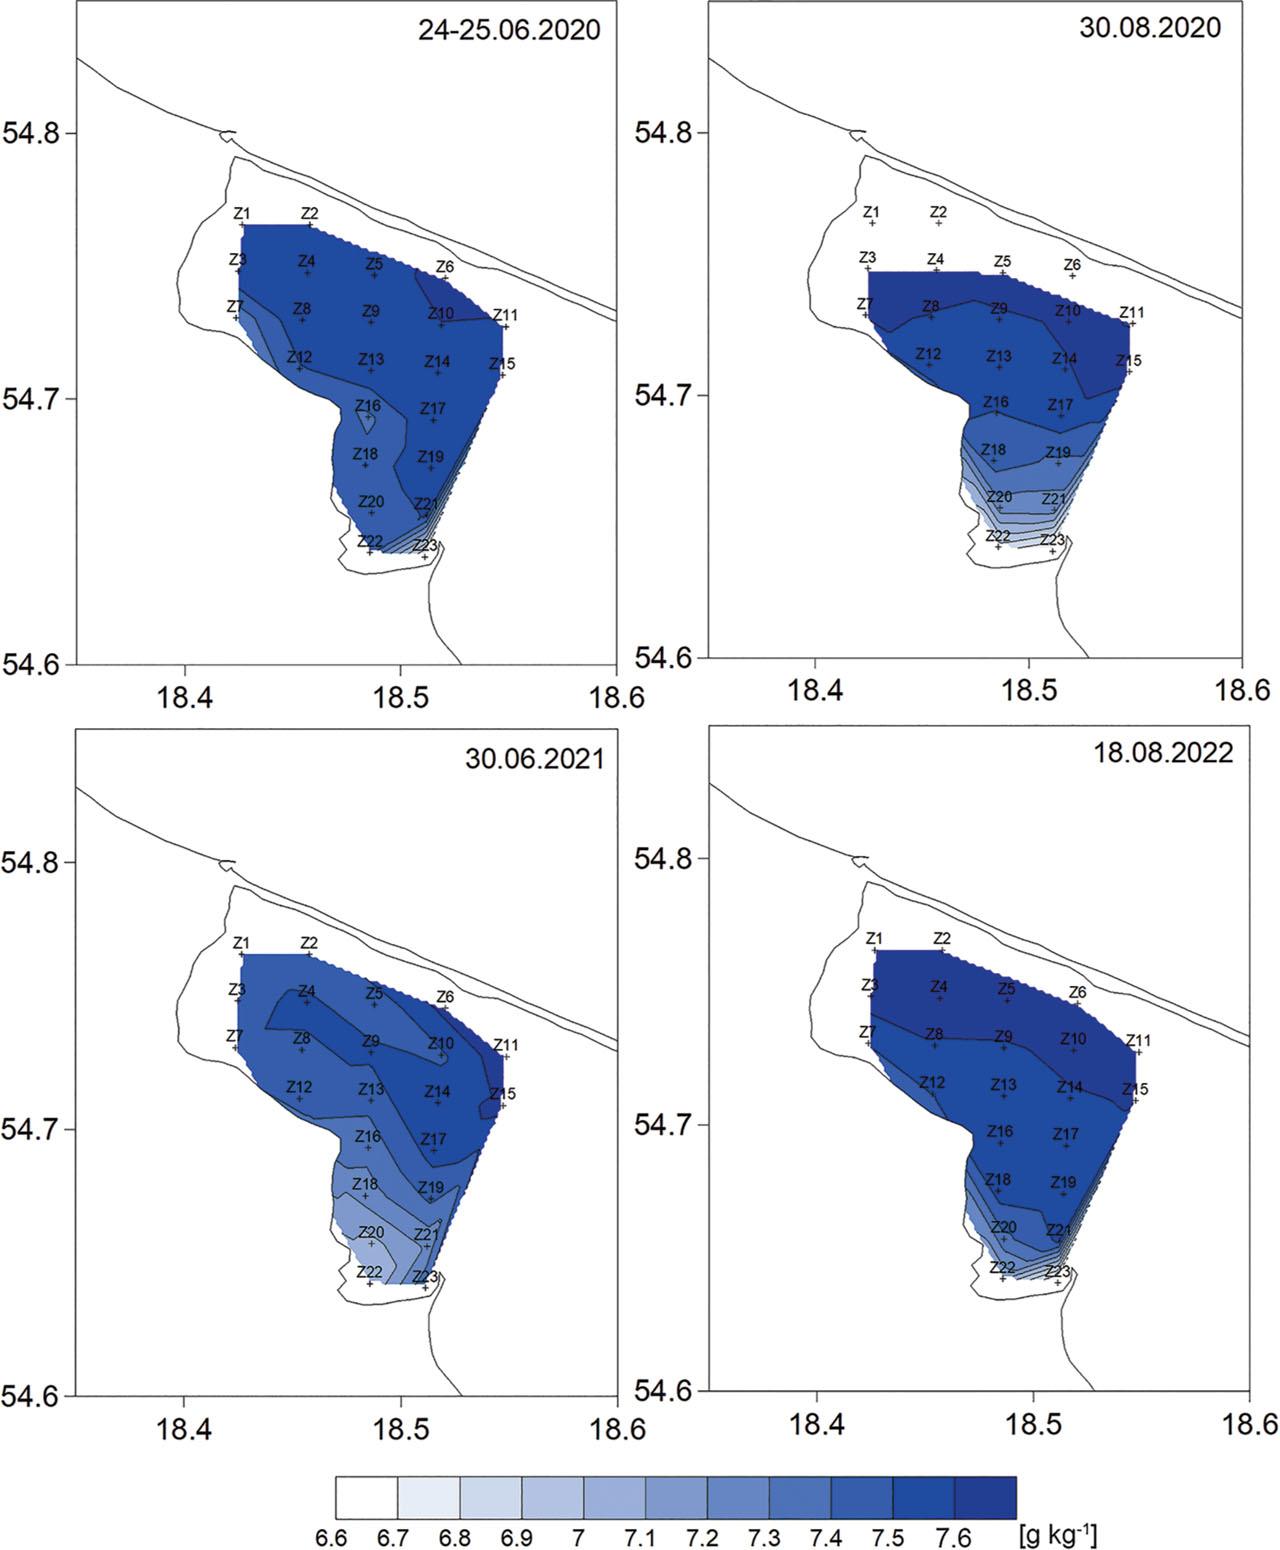
Figure 4
![Vertical salinity variability at reference sampling sites in the Outer Puck Bay in the summer of 2020–22 (A). Surface seawater salinity [g∙kg−1] distribution in the Puck Bay on 17–19 August 2022 (B). Surface seawater temperature [°C] distribution in the Puck Bay on 17–19 August 2022 (C).](https://sciendo-parsed.s3.eu-central-1.amazonaws.com/67ff4c35df7b4851cb85beb4/j_oahs-2025.1.05_fig_004.jpg?X-Amz-Algorithm=AWS4-HMAC-SHA256&X-Amz-Content-Sha256=UNSIGNED-PAYLOAD&X-Amz-Credential=ASIA6AP2G7AKPWNNMSJZ%2F20251212%2Feu-central-1%2Fs3%2Faws4_request&X-Amz-Date=20251212T001102Z&X-Amz-Expires=3600&X-Amz-Security-Token=IQoJb3JpZ2luX2VjEC8aDGV1LWNlbnRyYWwtMSJHMEUCIQDaFkKSNCVBhDsTZHGwld9g9k2A1Srk8bROfDlxbVxDfAIgSVRBhgb7qQoU4a7%2BzzyRAU4Xx0wy9AuOc8ln0MhNj0QqxgUI%2BP%2F%2F%2F%2F%2F%2F%2F%2F%2F%2FARACGgw5NjMxMzQyODk5NDAiDJXfe4g81h%2Fp%2BWBcMSqaBR%2FGP0VLdbz1hajdxD4mM0IXIAz34k%2F5CTORbVDcX0kHioqJrFrOL4X2K%2FBTl07Z9LZLM8vssSeBERmhE4i2ZUFz7mRkC80hQEQL1WJolNI9HLxsED1AFI4fKpmkxDnJebq9P1G%2FXXJE3vnz74iIhCo1xvh%2FSh%2F4btL2HOh6oQ8h9McJqZQNaqp2%2BN5Y2dFKxQPYjIKgo%2FqE%2B3LBo7y%2F3nCzYypWo2E2f1qcP6XFpPhX9b%2F2l6rLC6jO9Gb1zcjMaNMHeqXiu%2FVi%2BLzWpSxR%2Fnh8xT09%2BgVYMk5%2Fij1%2BCYuc%2FlAPjEyvvQ1kG53znLnF4P8JVYehQevZ7BrrUnrB4vXhdu3RKXINbHF429O%2BZST%2B6BX9Sr7ogw9FNIVVyFHMstPSJ0FkAh6B3QphfBiTX2vIQcOsumu7%2FRVN%2B2RndFT9tpNwXsmNOGIw%2BbdcE%2FbHMjb89fZZ%2Fr4htttiveEHw9fuUtpBwWhdcs8J5VB5y0VAYqXx7RWvRws%2FEIAIc0Y03b1uNFgGuOqGSdSF0lXexbuKMjm9wV76wmNDWiJnpIJpGkBI7ekG%2BXrFHf7Lp45YuOwdUvsVAm%2BiNY3h7P3LB3Bgj5j%2F9FjaUm3546H9xUBEiilRNkKHe2hVbRpIfY8YLnWLy30VjbXj7Sgzg9DjLEEivmOhvGaWejek%2FANqOSLiVAp63rKUdnsNJC6etl1Dbon5ie26JU%2F2NP1lfghR7hUDZ3SMrUZJ0GNQvokSExhjzivjaQ2LVBLr7hj6gptVZ5B0r0pOdUl7gAzIEhkBpykVhpHV3Tgg6UajWqh80sv52EWMUm%2BBIZ1wjekXA9x4ZfIUH%2FCQ4qbmRwGHCeGqTl4rdIJW9gViJ0HSo8Fh0Ye35ZJ1l67lYrwWszDkk%2B3JBjqxAWz0V0VeuxhkpR8tiDI5AEWsTZUsTZeF28EDKM2ciTR%2BNYJy6xST%2BgKMU77QyO4F8JH6oCfm9mzsdznUKY6HKx2zL2%2BGaZdjKA9tbuD%2F1yduKZB%2BPybQ37NsP88%2BCuouL83pZR6btNw1z52Noh9AHDT2xAPlUA1fGnNmqypbZv3Ww7lwq7ZAekO1QqJtJCN61EwFwRv%2BhY3U04CY2nSnsTsFdeXRiUqu6jl28rRYYneMTw%3D%3D&X-Amz-Signature=897428dbb778aa1818bb5ee014cb47febd248908bb2090f23163c29314297669&X-Amz-SignedHeaders=host&x-amz-checksum-mode=ENABLED&x-id=GetObject)
Monthly precipitation sums [mm∙m−2] in the region of Puck Bay in the summer of 2020–2022 and the multiyear (2008–2024) average values (https://danepubliczne_imgw_pl/pl/datastore)_ Precipitation values in the months when seawater salinity measurements took place are in bold_
| June | July | August | |||||||
|---|---|---|---|---|---|---|---|---|---|
| Hel | Gdynia | Rozewie Cape | Hel | Gdynia | Rozewie Cape | Hel | Gdynia | Rozewie Cape | |
| 2020 | 45.7 | 75.8 | 40.5 | 35.6 | 27.9 | 65.8 | 34.5 | 33.7 | 39.2 |
| 2021 | 17 | 7.6 | 5.5 | 44.4 | 48.1 | 42.8 | 74.3 | 79.2 | 107.6 |
| 2022 | 35 | 24 | 10.5 | 84.2 | 36.5 | 66.8 | 26.8 | 56.6 | 56.5 |
| Average (2008–2024) | 49.9 | 40.5 | 43.1 | 90.0 | 67.3 | 80.8 | 62.1 | 46.0 | 72.3 |
Basic statistics of the surface seawater salinity [g∙kg−1] in the Puck Lagoon_
| Date | Number of data | Mean (stand. dev.) | Minimum | Maximum |
|---|---|---|---|---|
| 24–25.06.2020a | 17 | 7.584 (0.035) | 7.510 (Z21) | 7.638 (Z6) |
| 24–25.06.2020b | 6 | 7.309 (0.246) | 6.761 (Z23) | 7.447 (Z12) |
| 30.08.2020a | 15 | 7.602 (0.056) | 7.505 (Z13) | 7.714 (Z3) |
| 30.08.2020b | 5 | 7.069 (0.281) | 6.664 (Z23) | 7.380 (Z16) |
| 30.06.2021a | 8 | 7.577 (0.061) | 7.503 (Z4) | 7.681 (Z11) |
| 30.06.2021b | 12 | 7.338 (0.157) | 6.998 (Z22) | 7.493 (Z10) |
| 17.08.2022a | 20 | 7.594 (0.057) | 7.505 (Z12) | 7.707 (Z2) |
| 17.08.2022b | 3 | 7.052 (0.302) | 6.652 (Z23) | 7.381 (Z20) |