
Figure 1
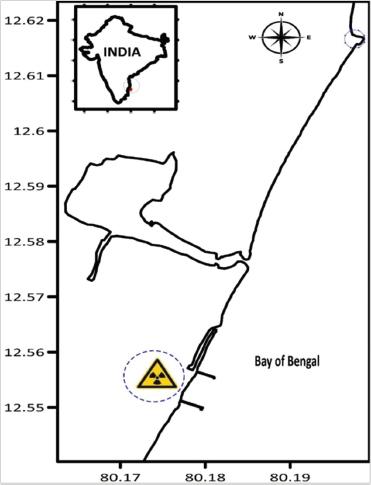
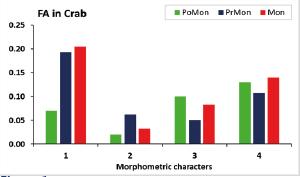
Figure 2
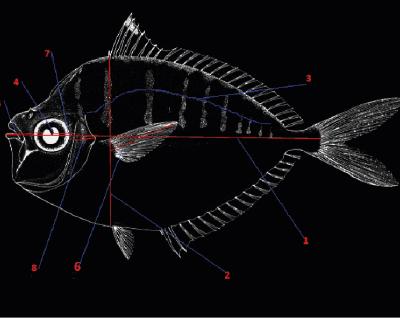
Figure 3
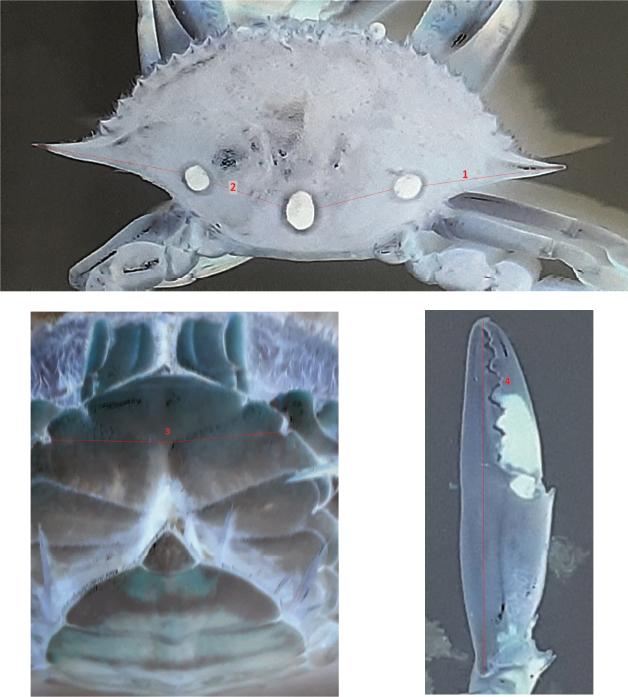
Figure 4
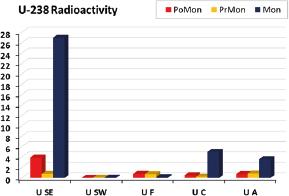
Figure 5
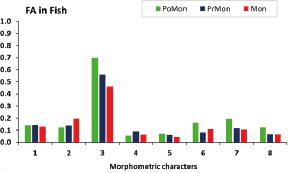
Figure 6
Correlation relationships between U-238 radioactivity and the fluctuating asymmetry in morphometric characteristics of Leiognathus sp_ at the studied area
| Parameters | U SE | U SW | U F | trait1 F | trait2 F | trait3 F | trait4 F | trait5 F | trait6 F | trait7 F | trait8 F |
|---|---|---|---|---|---|---|---|---|---|---|---|
| U SE | 1 | ||||||||||
| U SW | 0.40 NS | 1 | |||||||||
| U F | -0.98** | -0.58* | 1 | ||||||||
| trait1 F | -0.92** | 0.00 NS | 0.81** | 1 | |||||||
| trait2 F | 0.92** | 0.72** | -0.98** | -0.69* | 1 | ||||||
| trait3 F | -0.75** | -0.91** | 0.87** | 0.42 NS | -0.94** | 1 | |||||
| trait4 F | -0.38 NS | 0.69* | 0.18 NS | 0.72** | 0.00 NS | -0.33 NS | 1 | ||||
| trait5 F | -0.81** | -0.87** | 0.91** | 0.50* | -0.97** | 1.00** | -0.24 NS | 1 | |||
| trait6 F | -0.03 NS | -0.93** | 0.24 NS | -0.37 NS | -0.41 NS | 0.69* | -0.91** | 0.62* | 1 | ||
| trait7 F | -0.59* | -0.98** | 0.74** | 0.21 NS | -0.85** | 0.98** | -0.53* | 0.95** | 0.83** | 1 | |
| trait8 F | -0.40 NS | -1.00** | 0.58* | 0.00 NS | -0.72** | 0.91** | -0.69* | 0.87** | 0.93** | 0.98** | 1 |
Correlation relationships between U-238 radioactivity and the fluctuating asymmetry in morphometric characters of Portunus sanguinolentus at the studied area
| Parameters | U SE | U SW | U C | trait1 C | trait2 C | trait3 C | trait4 C |
|---|---|---|---|---|---|---|---|
| U SE | 1 | ||||||
| U SW | 0.40 NS | 1 | |||||
| U C | 1.00** | 0.45 NS | 1 | ||||
| trait1 C | 0.46 NS | 1.00** | 0.51* | 1 | |||
| trait2 C | -0.38 NS | 0.69* | -0.33 NS | 0.64* | 1 | ||
| trait3 C | 0.22 NS | -0.80** | 0.17 NS | -0.76** | -0.99** | 1 | |
| trait4 C | 0.82** | -0.19 NS | 0.79** | -0.12 NS | -0.84** | 0.74** | 1 |