
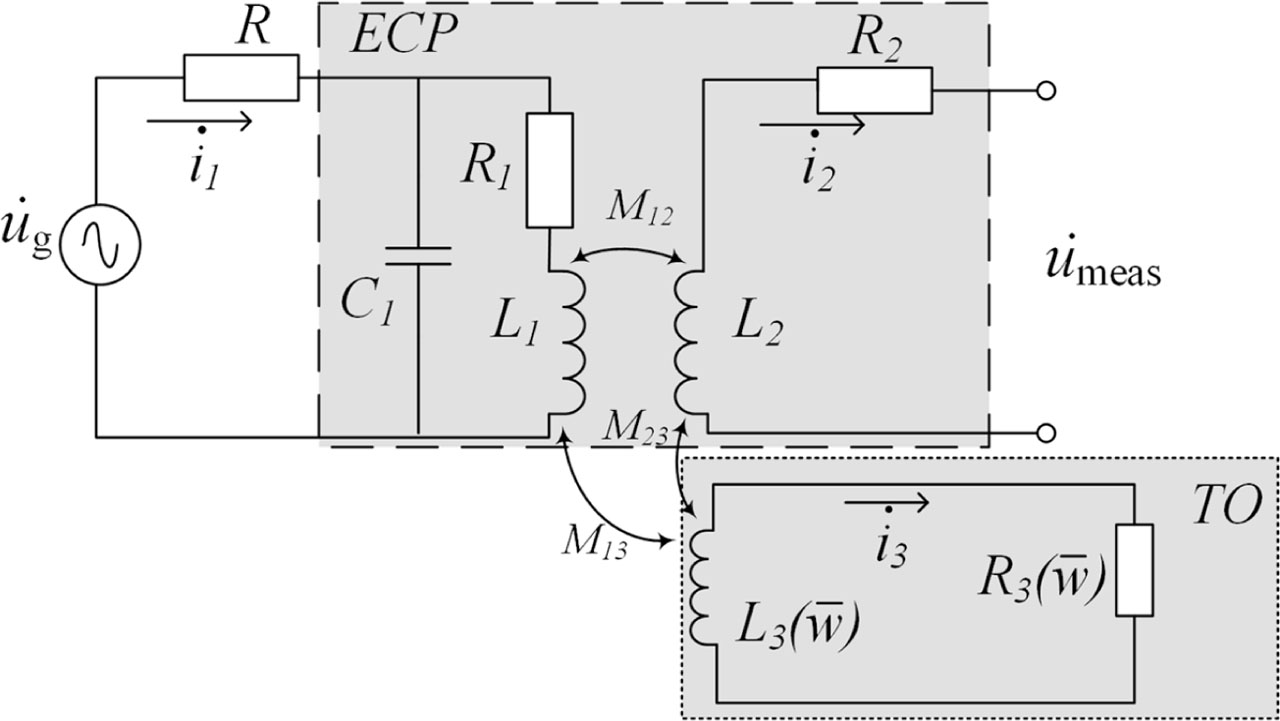
Fig. 1.
Equivalent circuit diagram.
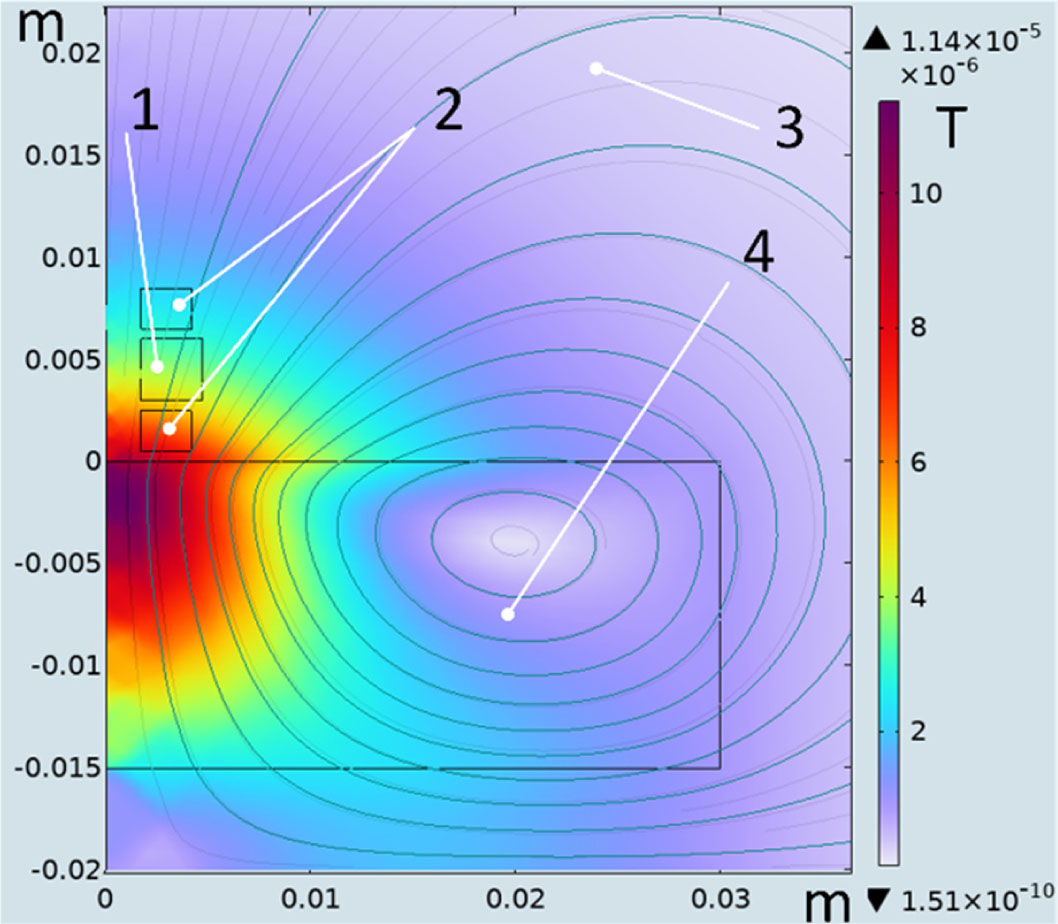
Fig. 2.
Magnetic flux density.
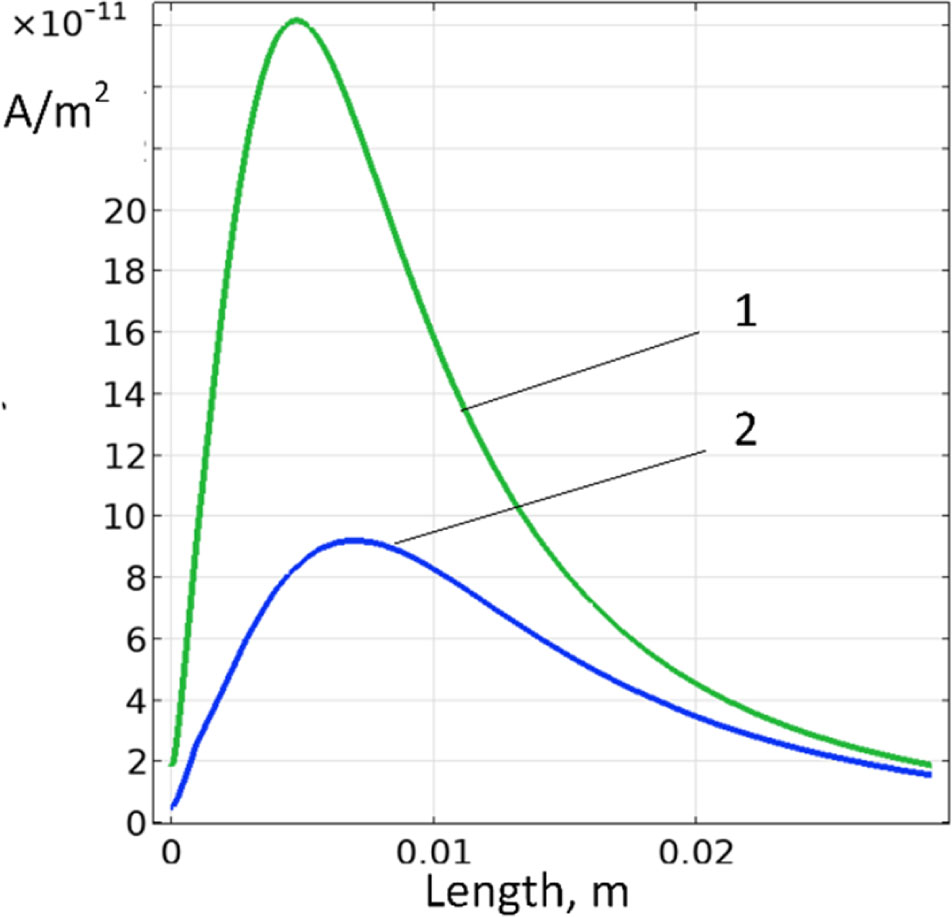
Fig. 3.
Eddy current density in the TO.
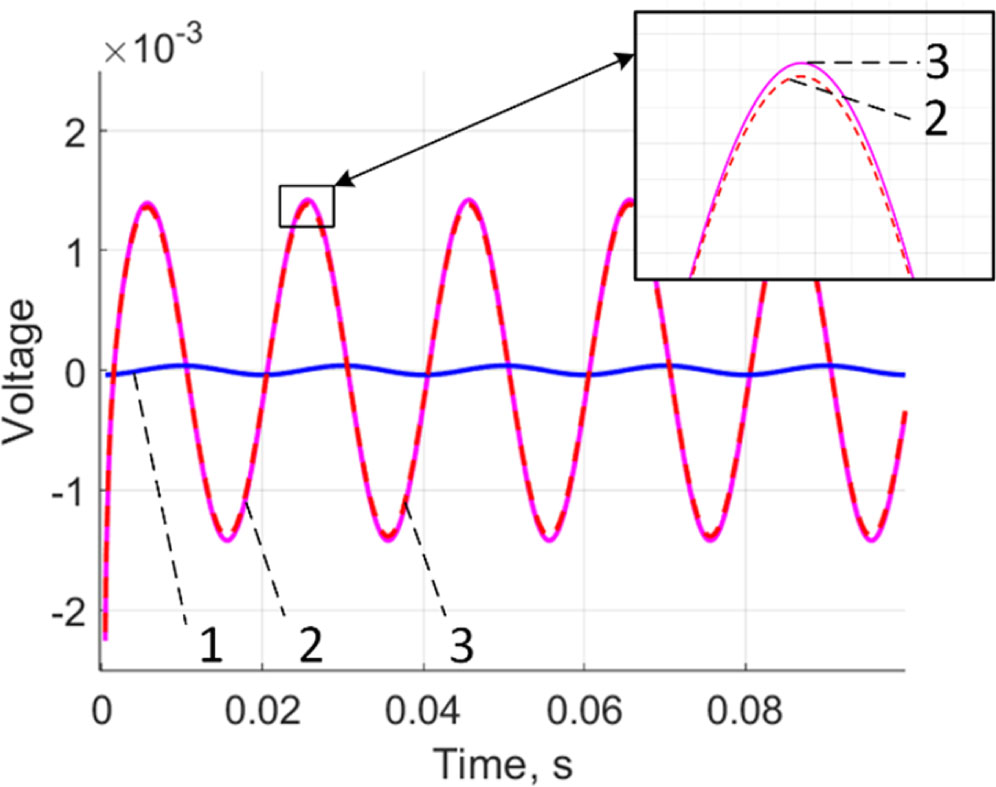
Fig. 4.
Simulated ECT signal under varying test object conductivity.
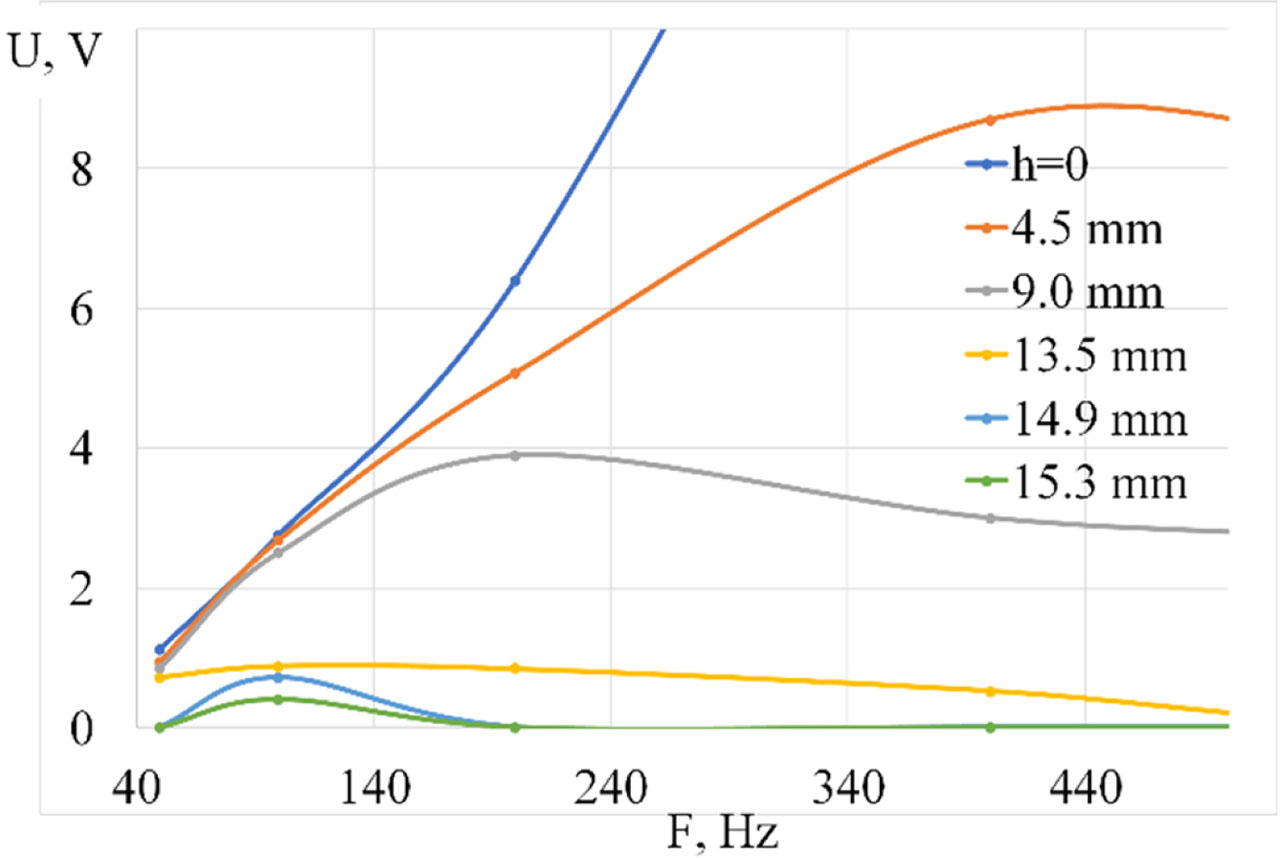
Fig. 5.
Dependence of the signal amplitude on scanning a test object with varying defect depths.