Fig. 1.
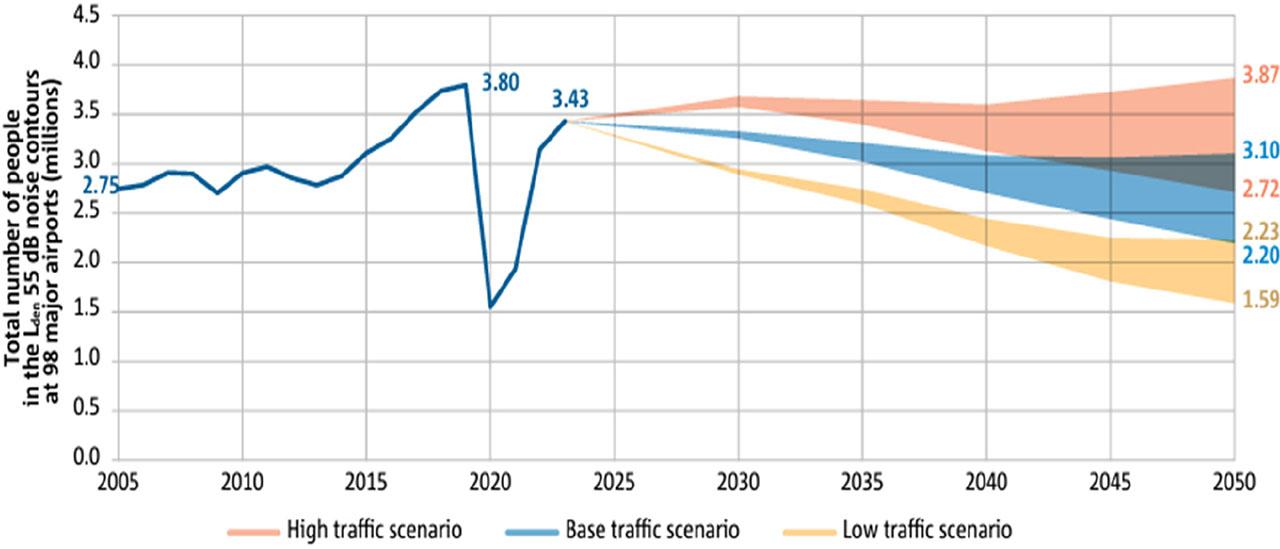
Fig. 2.
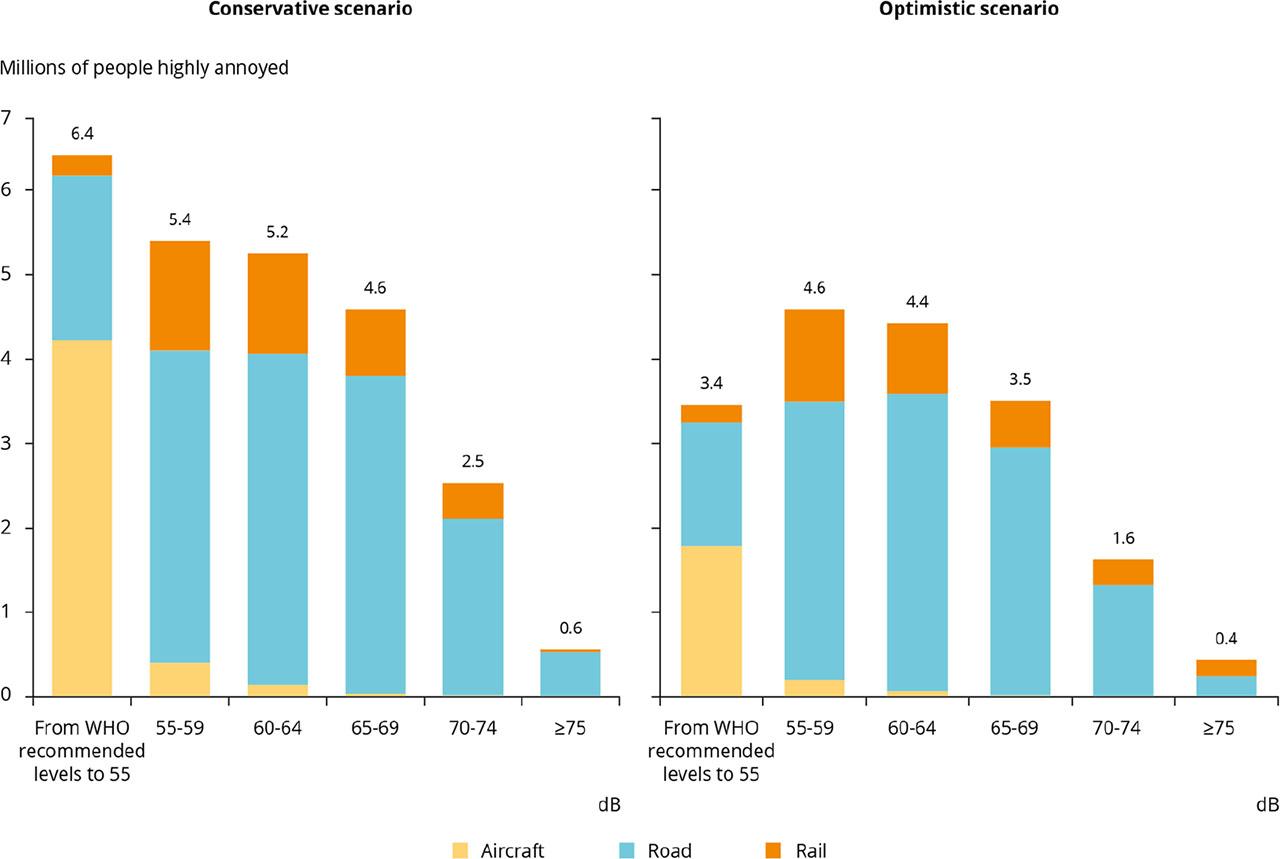
Fig. 3.
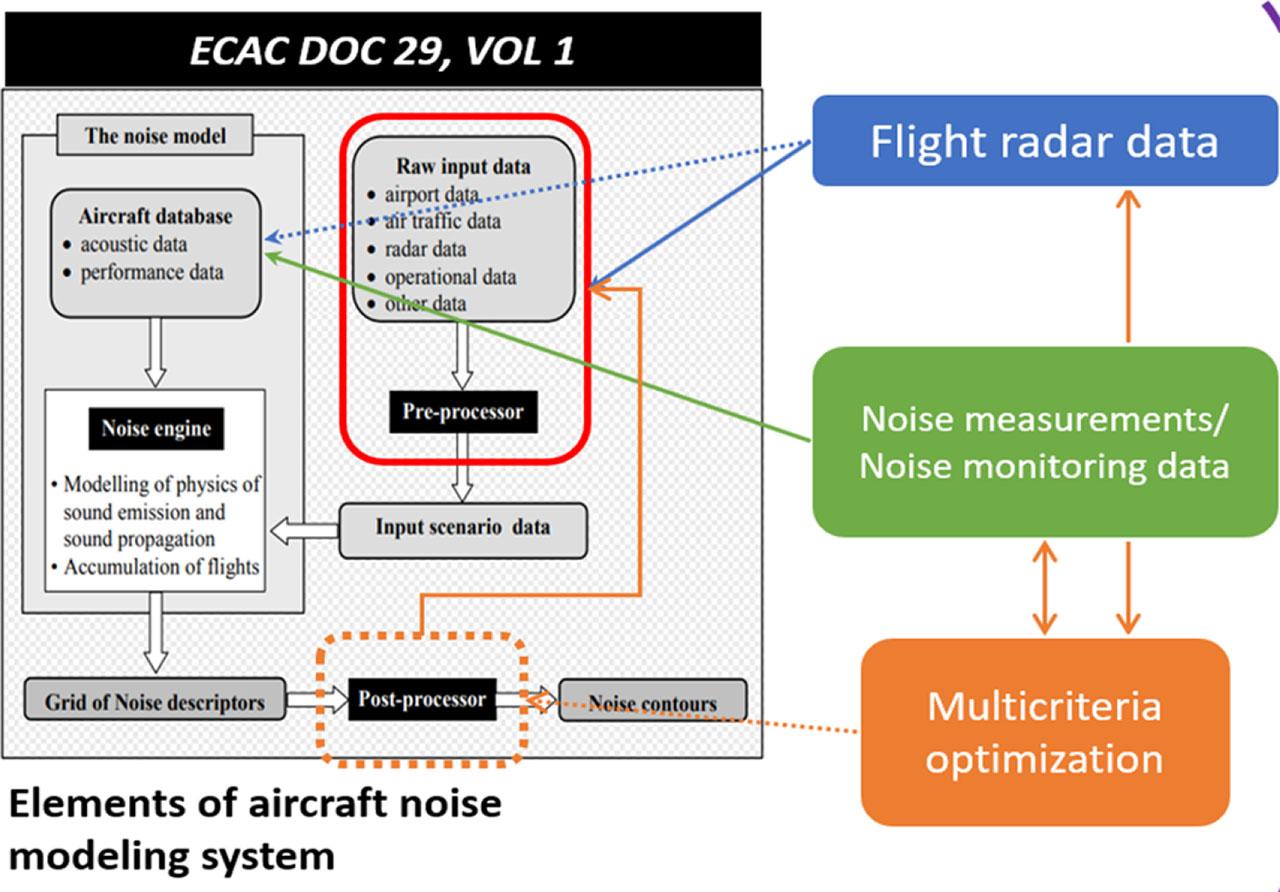
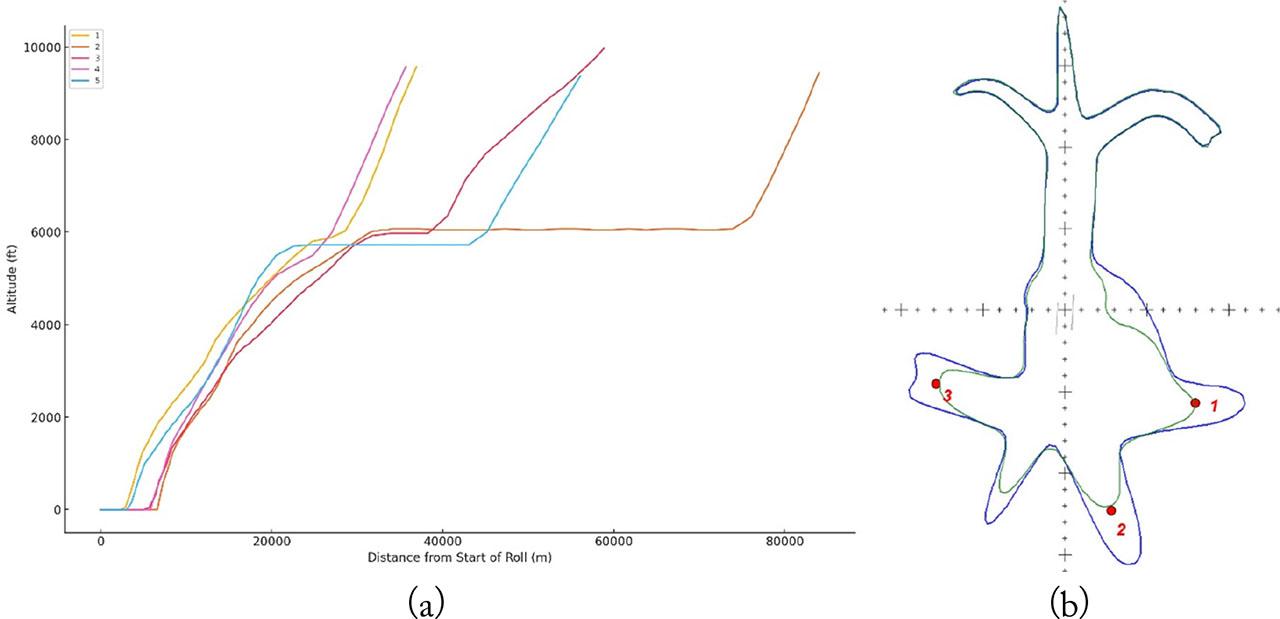
Fig. 4.
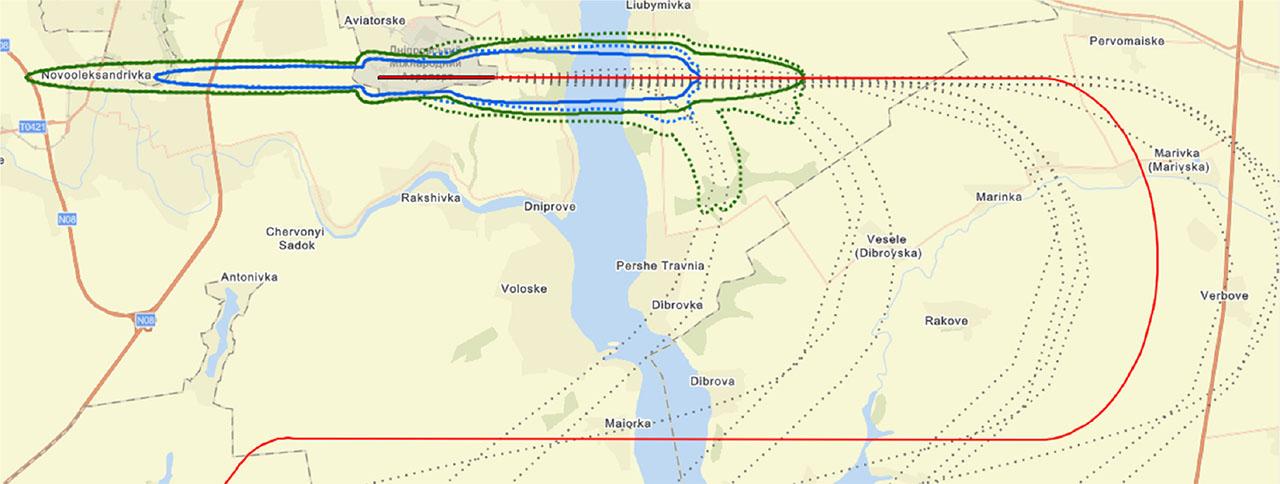
Fig. 5.
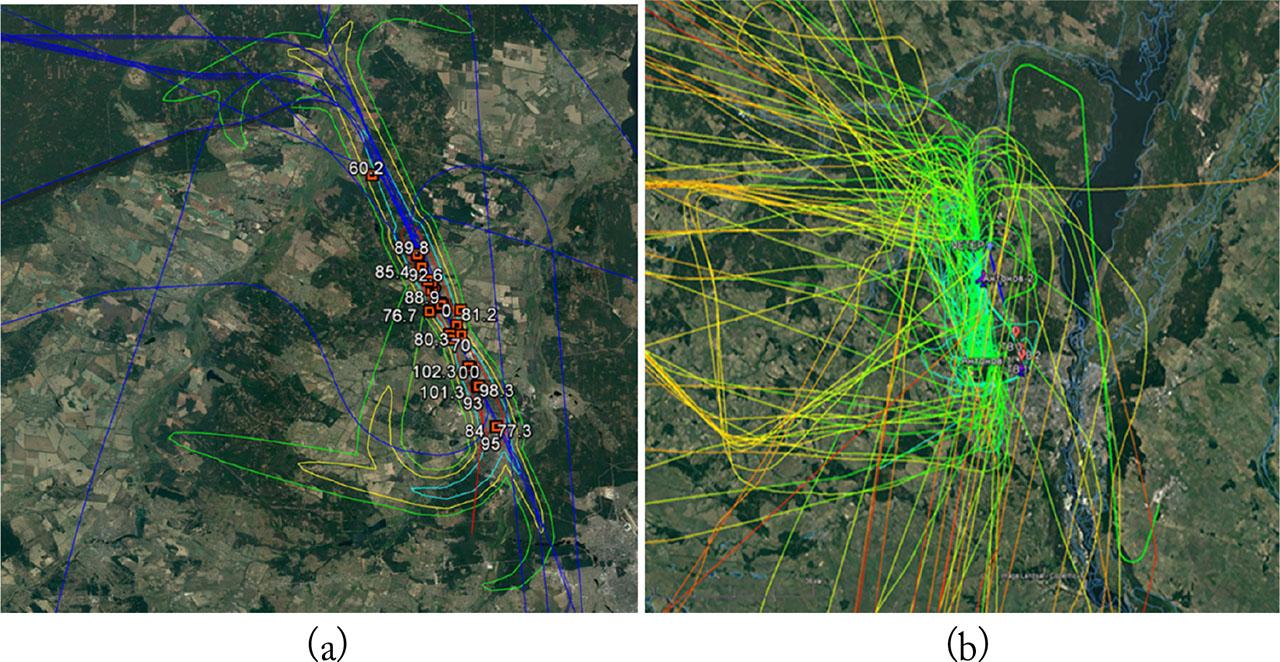
Fig. 6.
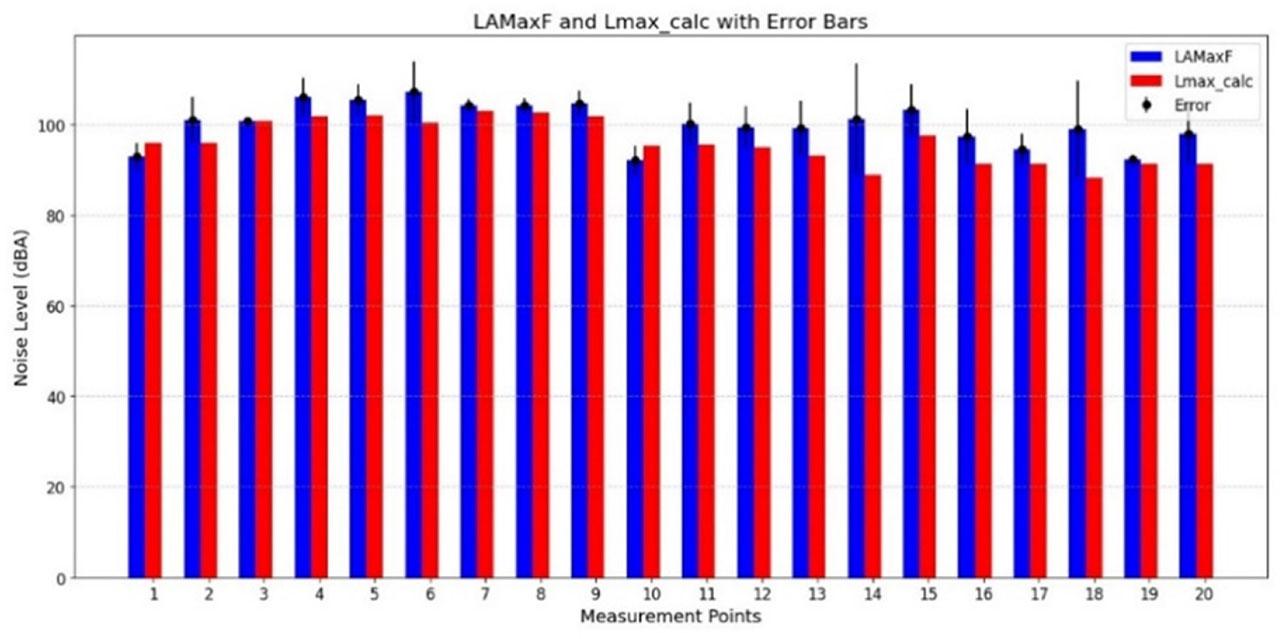
Fig. 7.
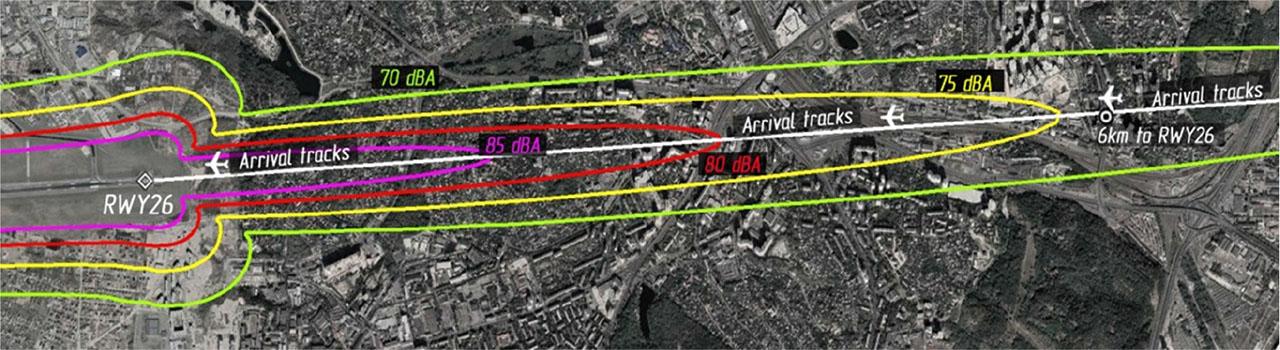
Fig. 8.
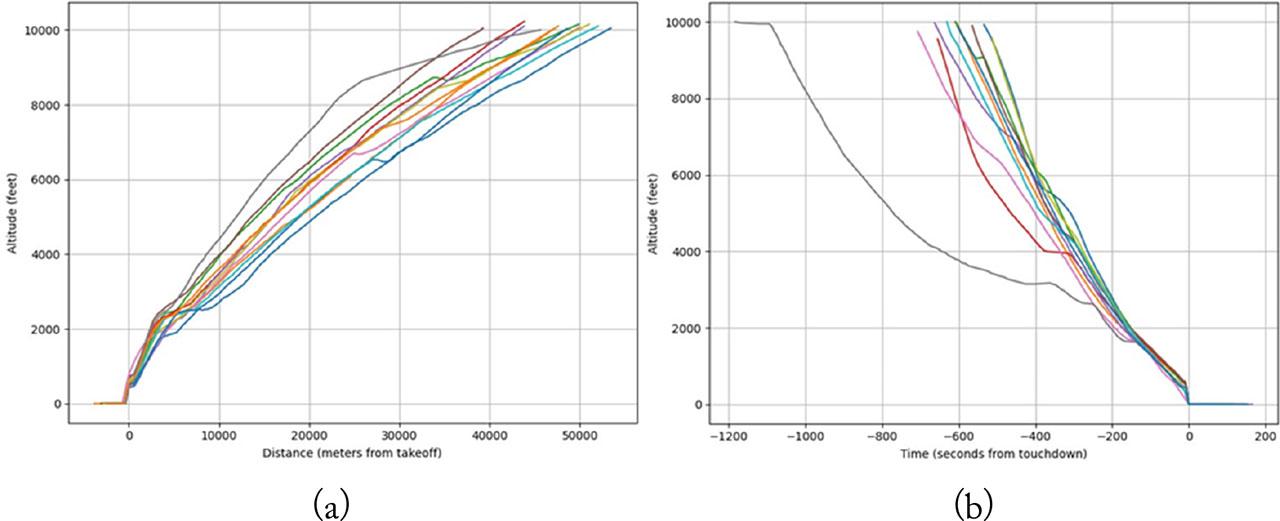
Fig. 9.
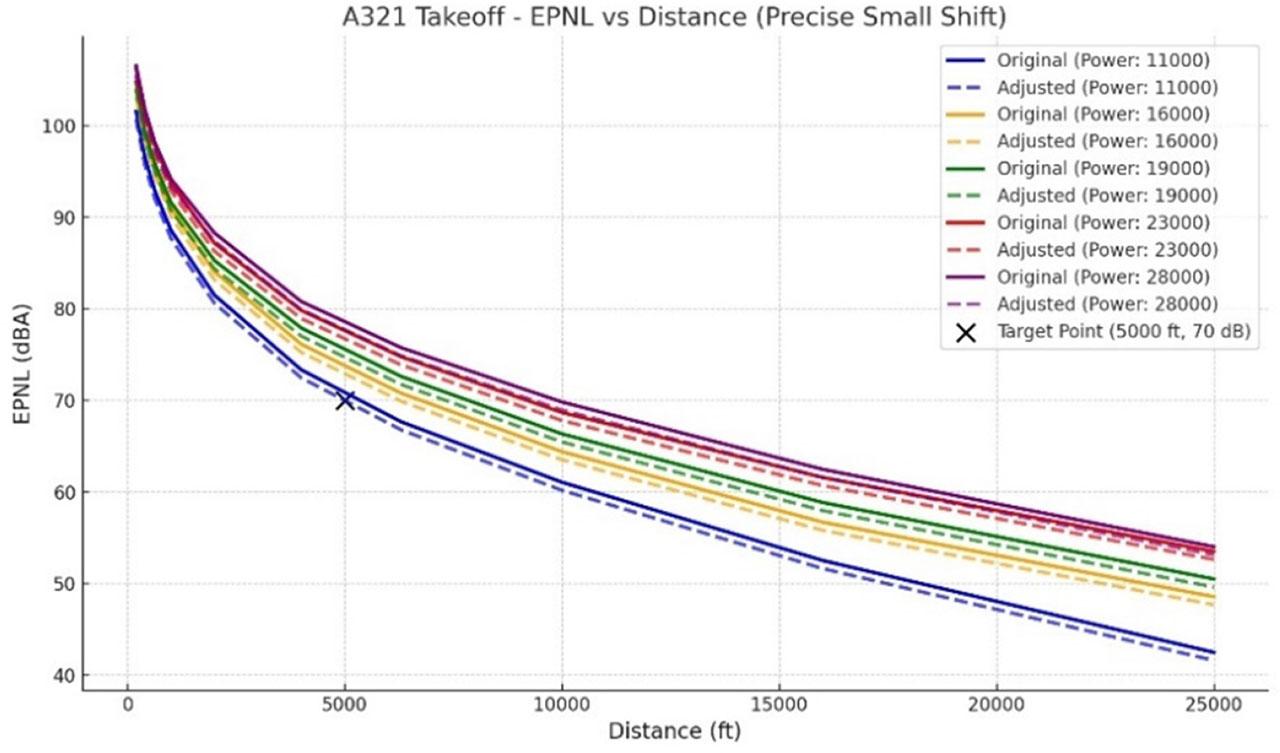
Fig. 10.
Changes in the Areas of Equal Noise Contours in the Vicinity of the Airport for Different Operational Scenarios_
| Contour Level (LAeq, dBA) | Scenario 0 [sq km] | Scenario 1 [sq km] | Change 0→1 [%] |
|---|---|---|---|
| 55 | 351.58 | 318.45 | −9.43 |
| 65 | 91.78 | 83.92 | −8.56 |
| 75 | 13.70 | 13.62 | −0.58 |
| 85 | 2.30 | 2.37 | +3.04 |
Modeling results: optimal distribution T (scenario 1) aircraft types, vertical profiles and tracks during the landing phase compared to scenario 0_
| Aircraft Type (i) | Route (j) | 1 | 2 | 3 | 4 | 5 | 6 | 7 | 8 |
|---|---|---|---|---|---|---|---|---|---|
| 1, B 738 | k=1/2/3/4/5 | 10/0/0/0/0 | 7/1/1/1/1 | 8/1/1/1/1 | 5/1/1/0/1 | 5/1/1/0/1 | 7/1/1/1/1 | 8/1/1/1/1 | 6/1/1/0/1 |
| 2, B 773 | k=1/2/3/4/5 | 10/0/0/0/0 | 8/1/1/1/1 | 8/1/1/1/1 | 5/1/1/0/1 | 5/1/1/0/1 | 8/1/1/1/1 | 8/1/1/1/1 | 5/1/1/0/1 |
| 3, A 321 | k=1/2/3/4/5 | 10/0/0/0/0 | 8/1/1/1/1 | 8/1/1/1/1 | 5/1/1/0/1 | 5/1/1/0/1 | 8/1/1/1/1 | 8/1/1/1/1 | 5/1/1/0/1 |
| 4, A 330 | k=1/2/3/4/5 | 10/0/0/0/0 | 9/1/1/1/1 | 9/1/1/1/1 | 4/1/1/0/1 | 4/1/1/0/1 | 9/1/1/1/1 | 9/1/1/1/1 | 4/1/1/0/1 |
| 5, A 340 | k=1/2/3/4/5 | 10/0/0/0/0 | 9/1/1/1/1 | 9/1/1/1/1 | 3/1/1/0/1 | 3/1/1/0/1 | 9/1/1/1/1 | 9/1/1/1/1 | 4/1/1/0/1 |
Comparison of measured and modeled data on the example of A321 (N=65, averaged measured data for approach MP2 and departure MP4)_
| POINT | Modelled data | Measured data | Difference | Correction | Difference (corr) |
|---|---|---|---|---|---|
| LAmax, dBA | |||||
| MP2 | 89.4 | 95.2 | −5.8 | 91.8 | −3.4 |
| MP4 | 84.2 | 88.0 | −3.8 | 85.6 | −2.4 |
| SEL, dBA | |||||
| MP2 | 94.4 | 96.7 | −2.3 | 95.1 | −1.6 |
| MP4 | 91.1 | 90.9 | 0.2 | 90.9 | 0.0 |
Noise abatement procedures and implementation restrictions [11]_
| Category of procedure | Procedures | Implementation restrictions | ||
|---|---|---|---|---|
| Capacity | Airport configuration and residential areas | Environmental tradeoffs | ||
| Noise abatement flight procedures | CDA | + | ||
| NADPs | + | + | + | |
| Modified approach angles | + | |||
| Staggered, or displaced landing thresholds | + | + | ||
| Low power/low drag approach profile | + | |||
| Minimum use of reverse thrust after landing | + | |||
| Spatial management | Noise preferred arrival and departure routes | + | + | + |
| Flight track dispersion or concentration | + | + | + | |
| Noise preferred runways | + | + | + | |
| Ground management | Hush houses and engine run up management (location/aircraft orientation, time of day, maximum thrust level) | + | + | |
| APU management | + | + | + | |
| Taxi and queue management | + | + | ||
| Towing | + | |||
| Taxi power control (taxi with less than all engines operating) | + | |||