

Figure 1.
Distribution of failures by systems (with orange denoting total failures, and grey part removal).
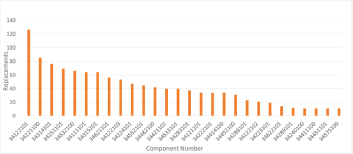
Figure 2.
Number of navigation system component failures.
Table 1.
The most frequently removed avionics devices.
| No. | Name of object | Part number | Number of components replaced | t (h) | ωt | P(t) |
|---|---|---|---|---|---|---|
| 1 | Mach Airspeed indicator | 2083-11-1 | 126 | 100 300 500 | 1.95 · 10–2 5.85 · 10–2 9.76 · 10–2 | 0.9807 0.9431 0.9070 |
| 2 | Transmission assay constant speed | 735511A | 103 | 100 300 500 | 1.60 · 10–2 4.79 · 10–2 7.98 · 10–2 | 0.9842 0.9533 x0.9233 |
| 3 | EFIS Control panel | 622-8001-350 | 70 | 100 300 500 | 1.08 · 10–2 3.25 · 10–2 5.42 · 10–2 | 0.9892 0.9680 0.9472 |
| 4 | Standby horizon indicator | H341ANM1 | 69 | 100 300 500 | 2.14 · 10–2 6.41 · 10–2 1.07 · 10–1 | 0.9789 0.9379 0.8987 |
| 5 | Panel audio select | 5145-1-64 | 61 | 100 300 500 | 6.30 · 10–3 1.89 · 10–2 3.15 · 10–2 | 0.9937 0.9813 0.9690 |
| 6 | VOR/ILS receiver | 822-0761-001 | 61 | 100 300 500 | 9.45 · 10–3 2.83 · 10–2 4.72 · 10–2 | 0.9906 0.9721 0.9539 |
| 7 | GCU | 948F458-5 | 56 | 100 300 500 | 5.78 · 10–3 1.73 · 10–2 2.89 · 10–2 | 0.9942 0.9828 0.9715 |
| 8 | generator | 976J498-2 | 54 | 100 300 500 | 5.58 · 10–3 1.67 · 10–2 2.79 · 10–2 | 0.9944 0.9834 0.9725 |
| 9 | Altimeter | 2057-01-1 | 53 | 100 300 500 | 8.21 · 10–3 2.46 · 10–2 4.10 · 10–2 | 0.9918 0.9757 0.9598 |
| 10 | Transponder | 822-1338-003 | 49 | 100 300 500 | 7.59 · 10–3 2.28 · 10–2 3.79 · 10–2 | 0.9924 0.9775 0.9628 |
| 11 | Symbol generator | 622-9436-101 | 49 | 100 300 500 | 7.59 · 10–3 2.28 · 10–2 3.79 · 10–2 | 0.9924 0.9775 0.9628 |
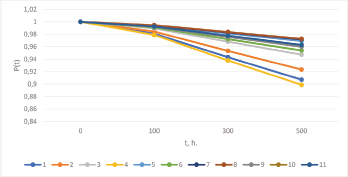
Figure 3.
Visual material of probability of safe operation.
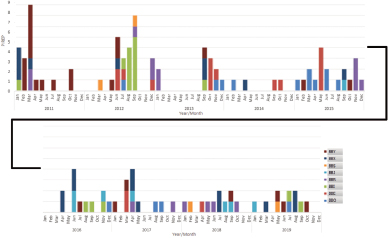
Figure 4.
Trends of the PIREP (pilot report) generator.
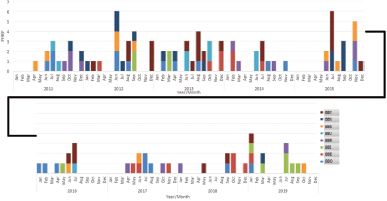
Figure 5.
Trends in the PIREP (pilot report) generator drive mechanism.
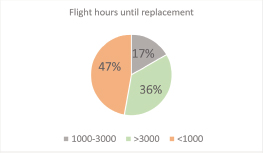
Figure 6.
Unscheduled replacement of the airplane speed indicator after flight hours.