
Table 1.
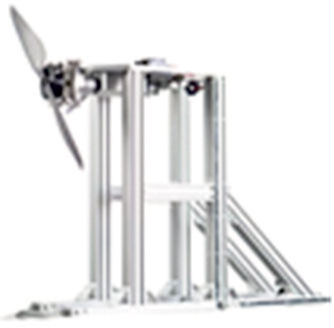
LY-70KGF Thrust Stand and Dynamometer Wing Flayng
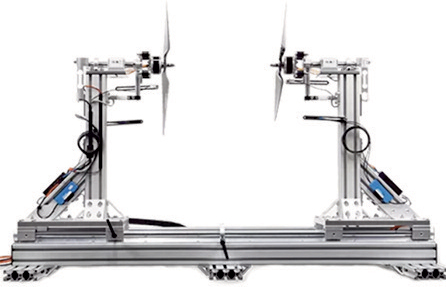
WF-CO-30KGF Coaxial Thrust Stand Wing Flayng
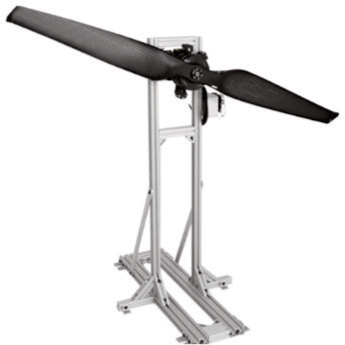
Series 1780 Test Stand TYTO Robotics
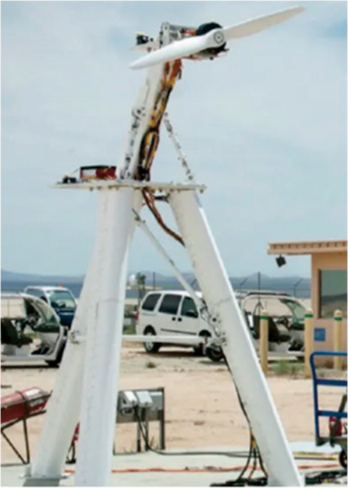
Modular Stand for testing aircraft electric propulsion systems NASA

Rotor/propeller test stand in Hover Institute of Aviation
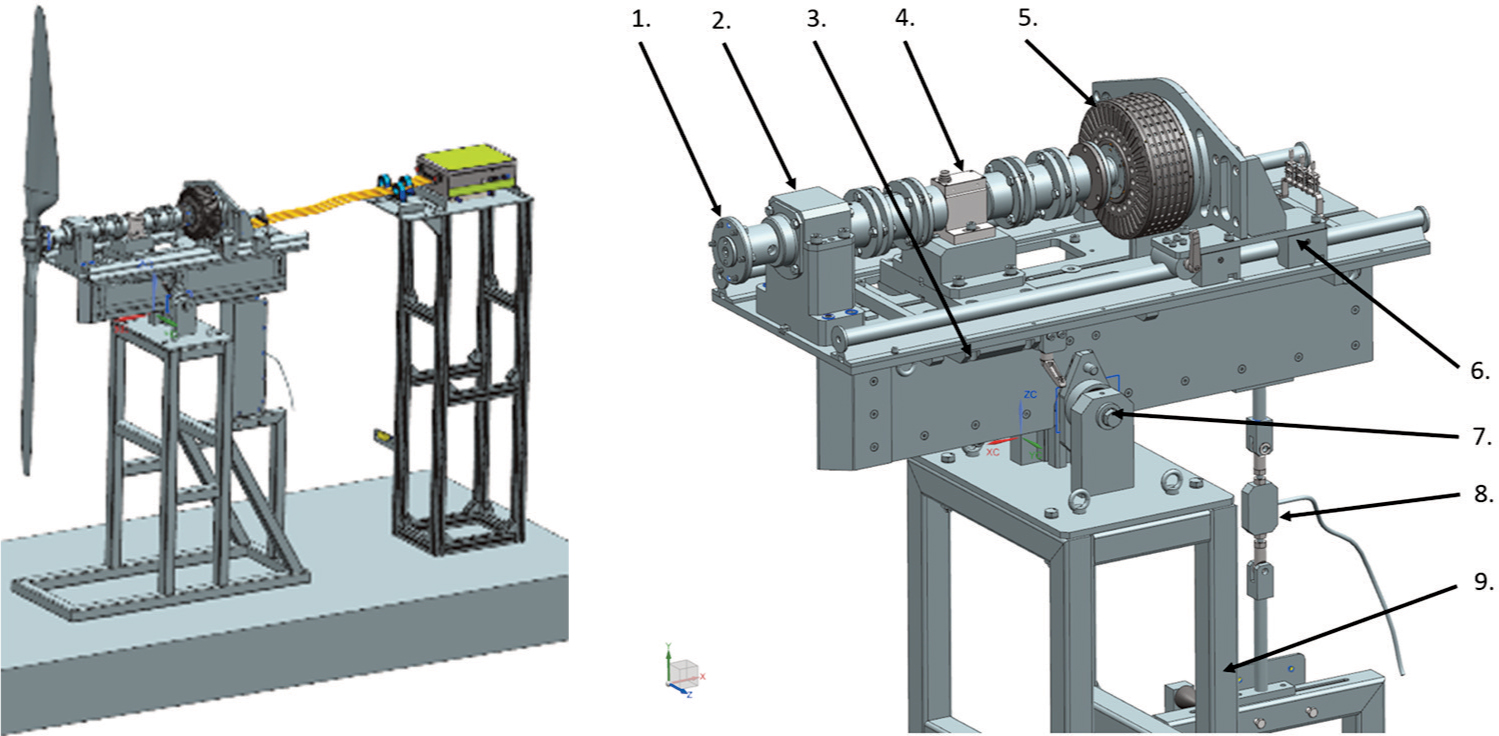
Figure 1.
Propeller thrust test stand – visualisation [own elaboration].
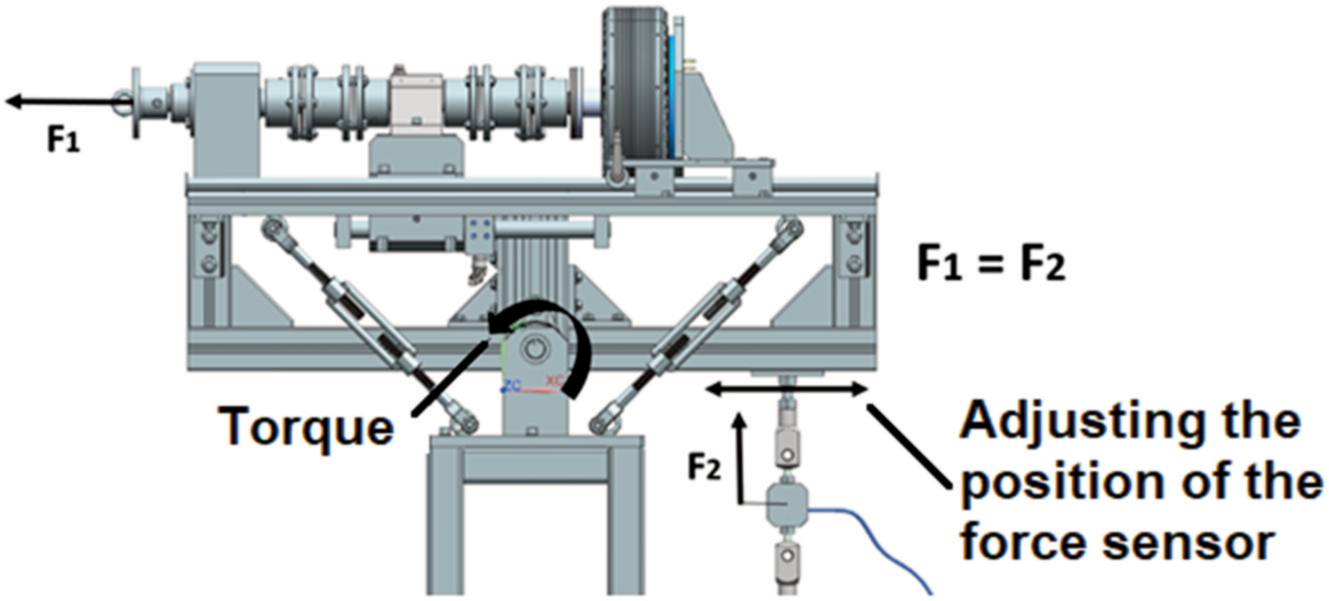
Figure 2.
The principle of measuring the propeller thrust on the presented stand [own elaboration].
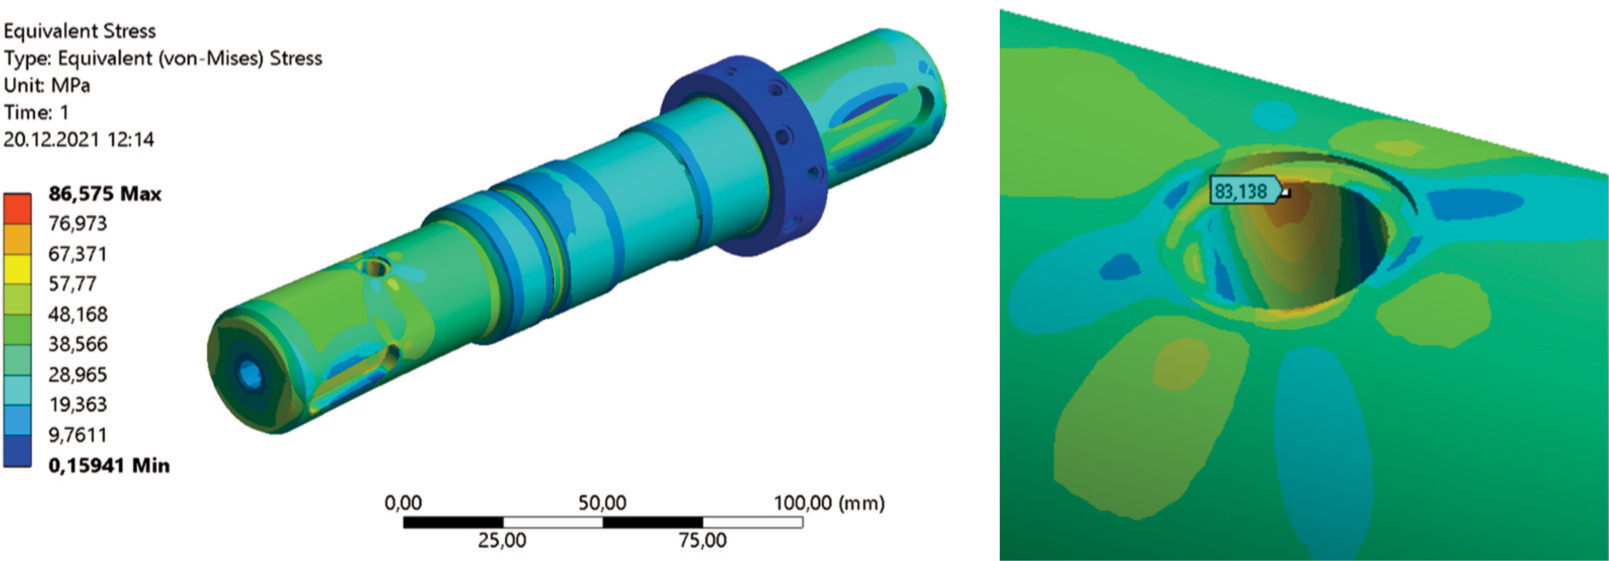
Figure 3.
Map of reduced stress according to the Huber-Von-Mises hypothesis with a point measurement in the vicinity of the calculated transverse opening [own elaboration].
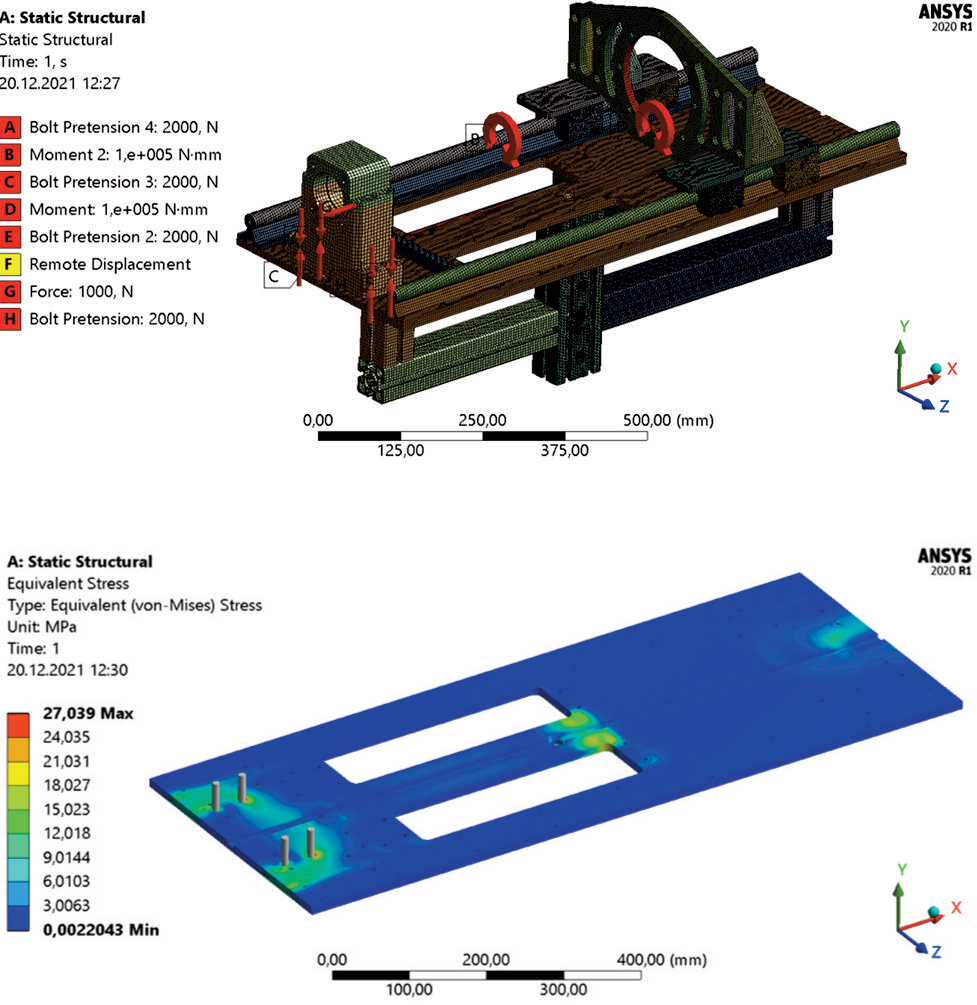
Figure 4.
Structural calculation: (top) mounting plate model; (bottom) map of the mounting plate effort according to the Huber-Von-Mises hypothesis [own elaboration].
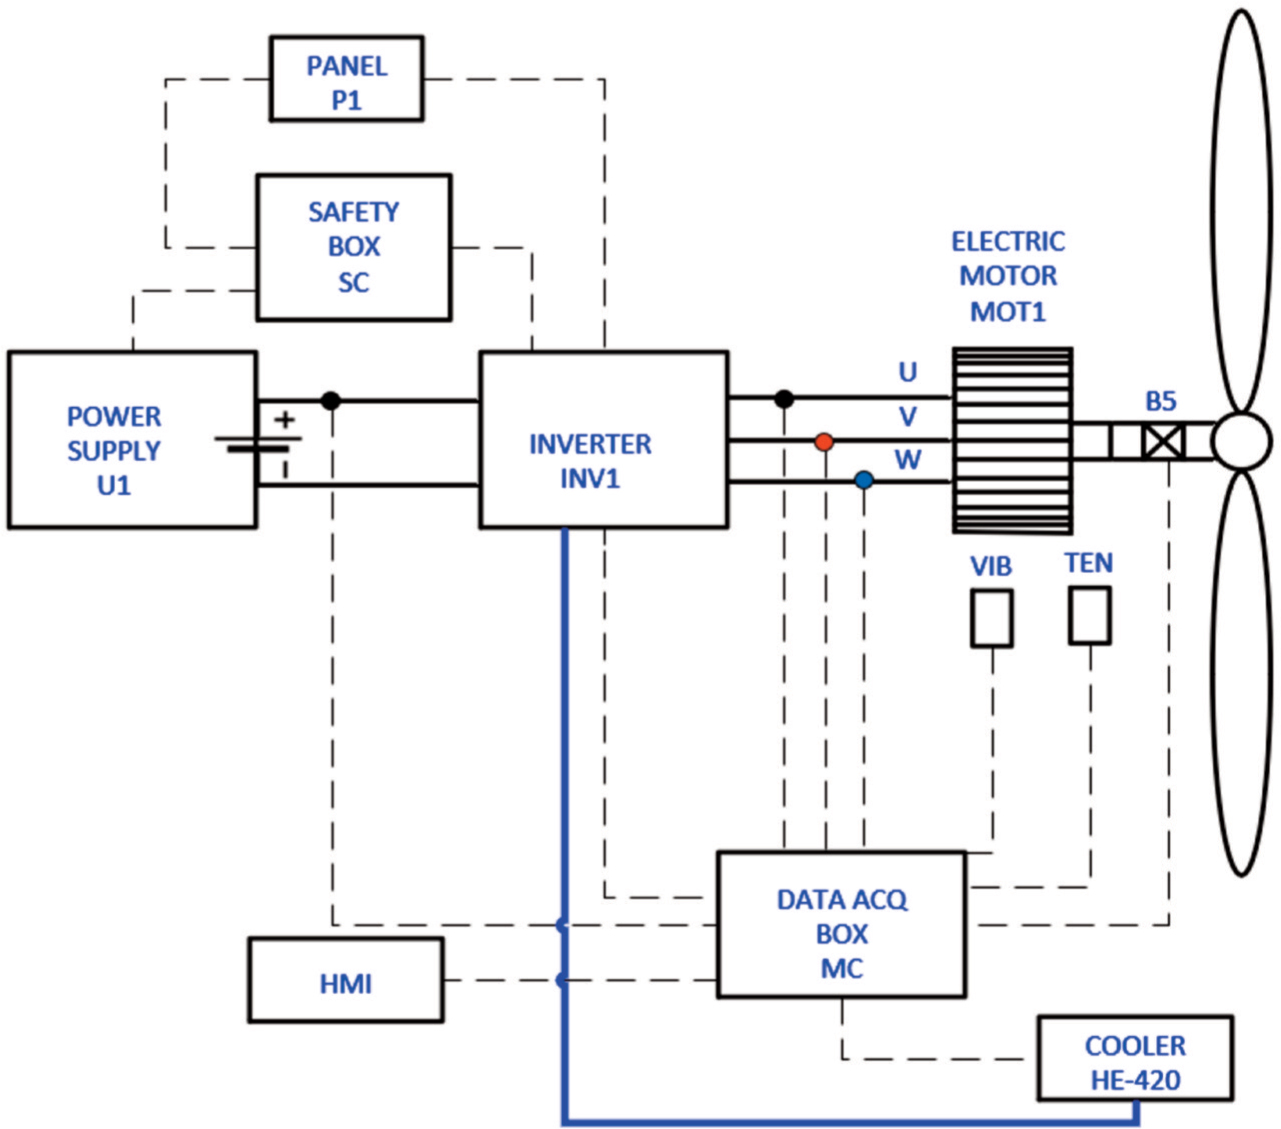
Figure 5.
Propeller thrust test stand – electrical diagram [own elaboration].

Figure 6.
Dynamic model – block diagram [own elaboration].
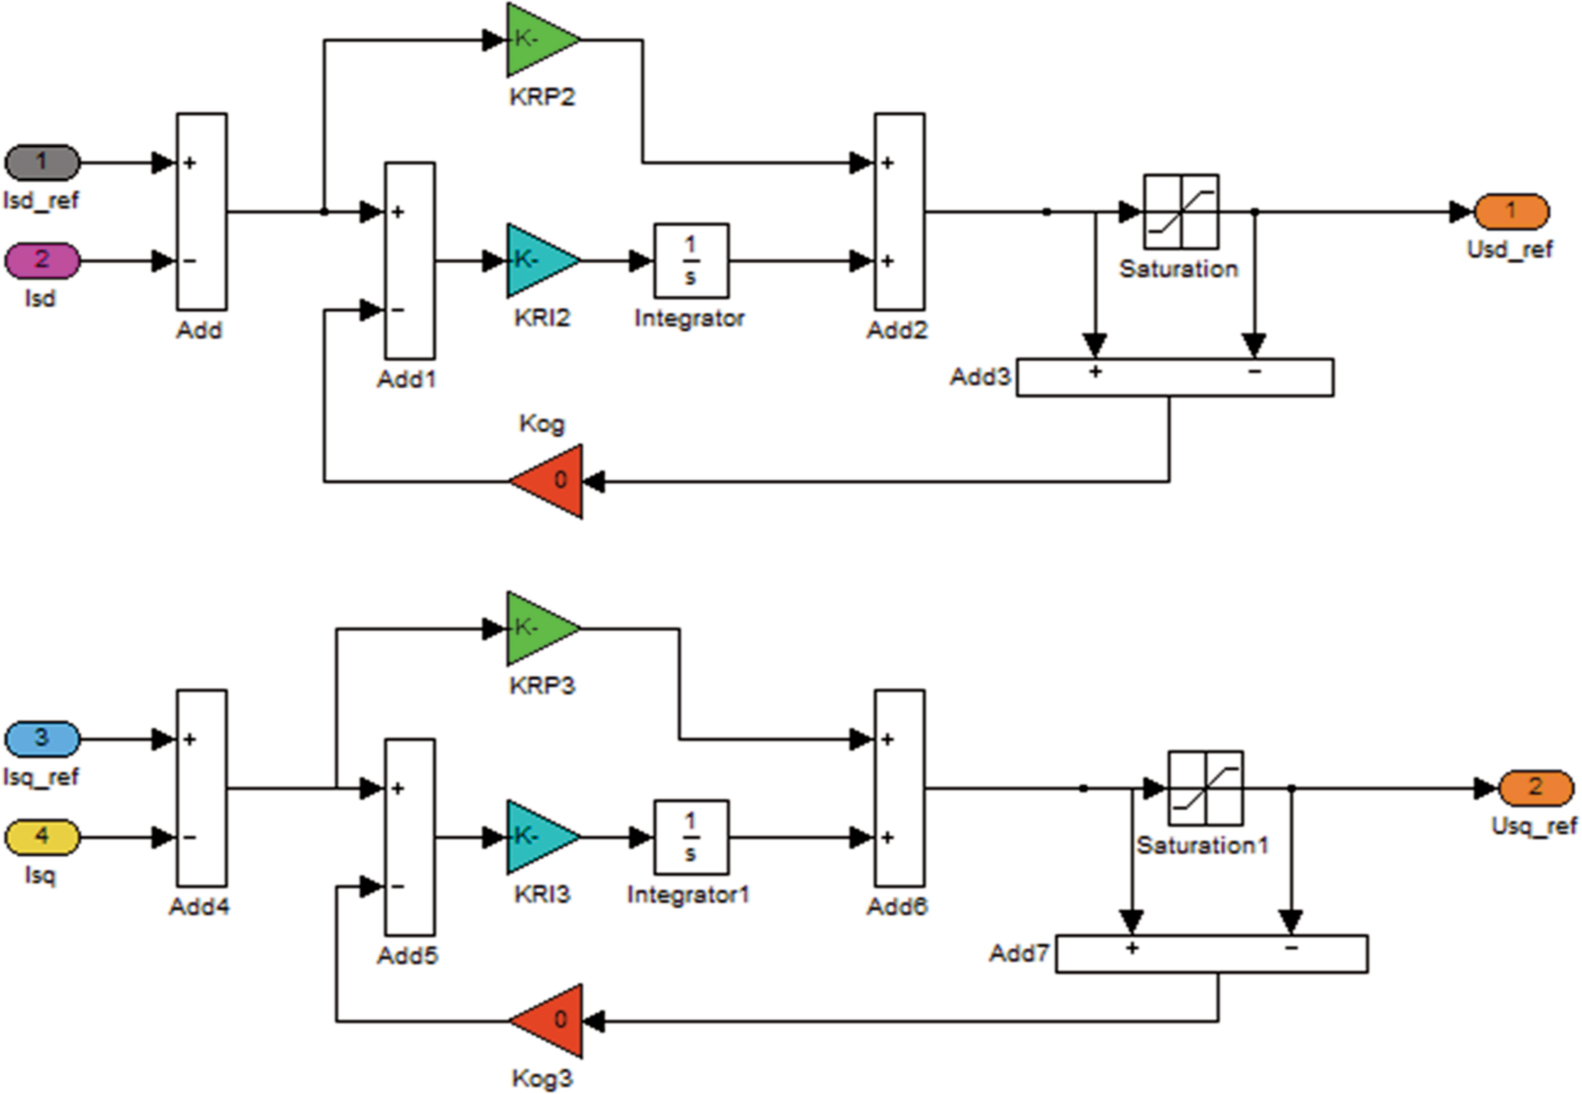
Figure 7.
Construction of regulators in the MATLAB Simulink program [own elaboration].
Table 2.
Moments of inertia of elements included in the model.
| I (kg mm2) | |
|---|---|
| The knot from the engine to the propeller attachment | 13,503 |
| Propeller mounting hub | 4,350 |
| Propeller | 246,083 |
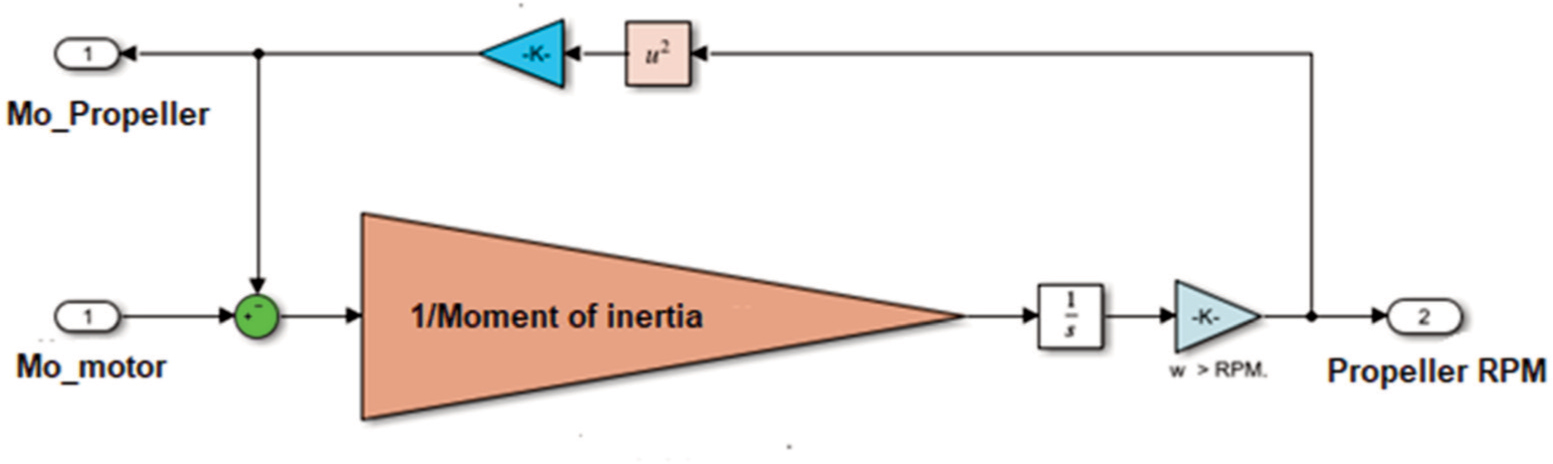
Figure 8.
Propeller model with moments of inertia [own elaboration].
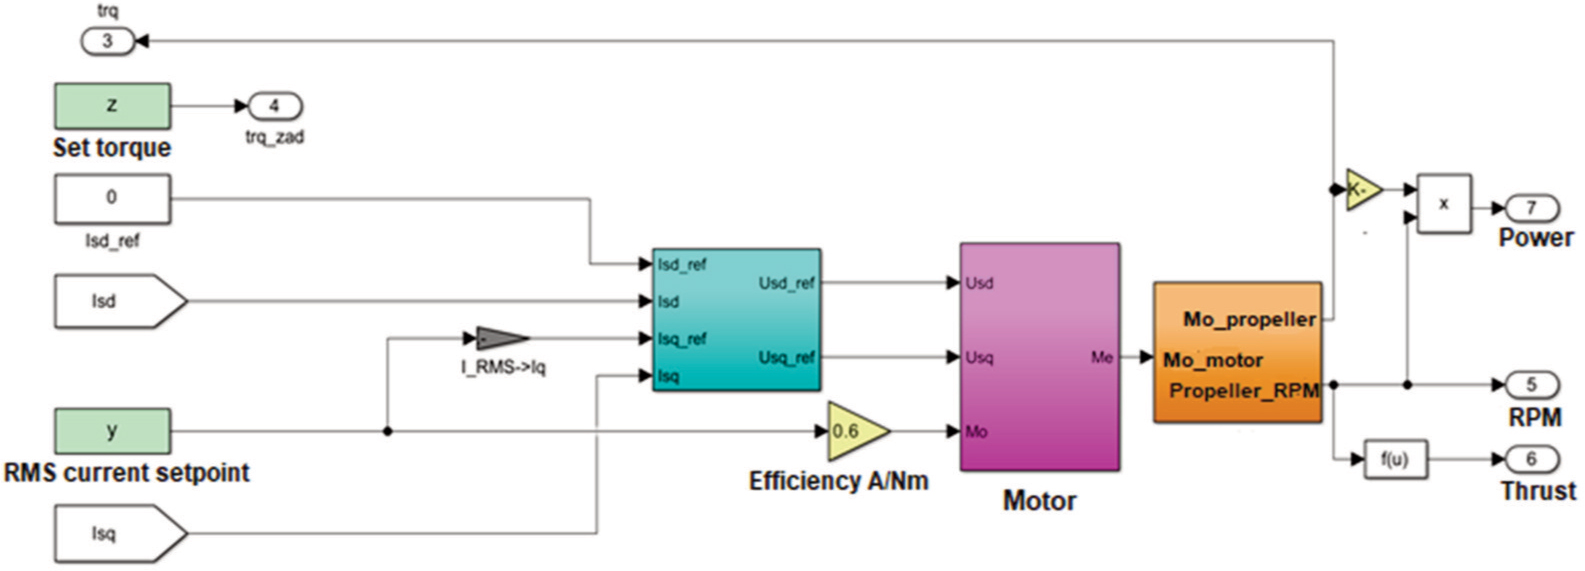
Figure 9.
Model of the entire system built in MATLAB Simulink [own elaboration].
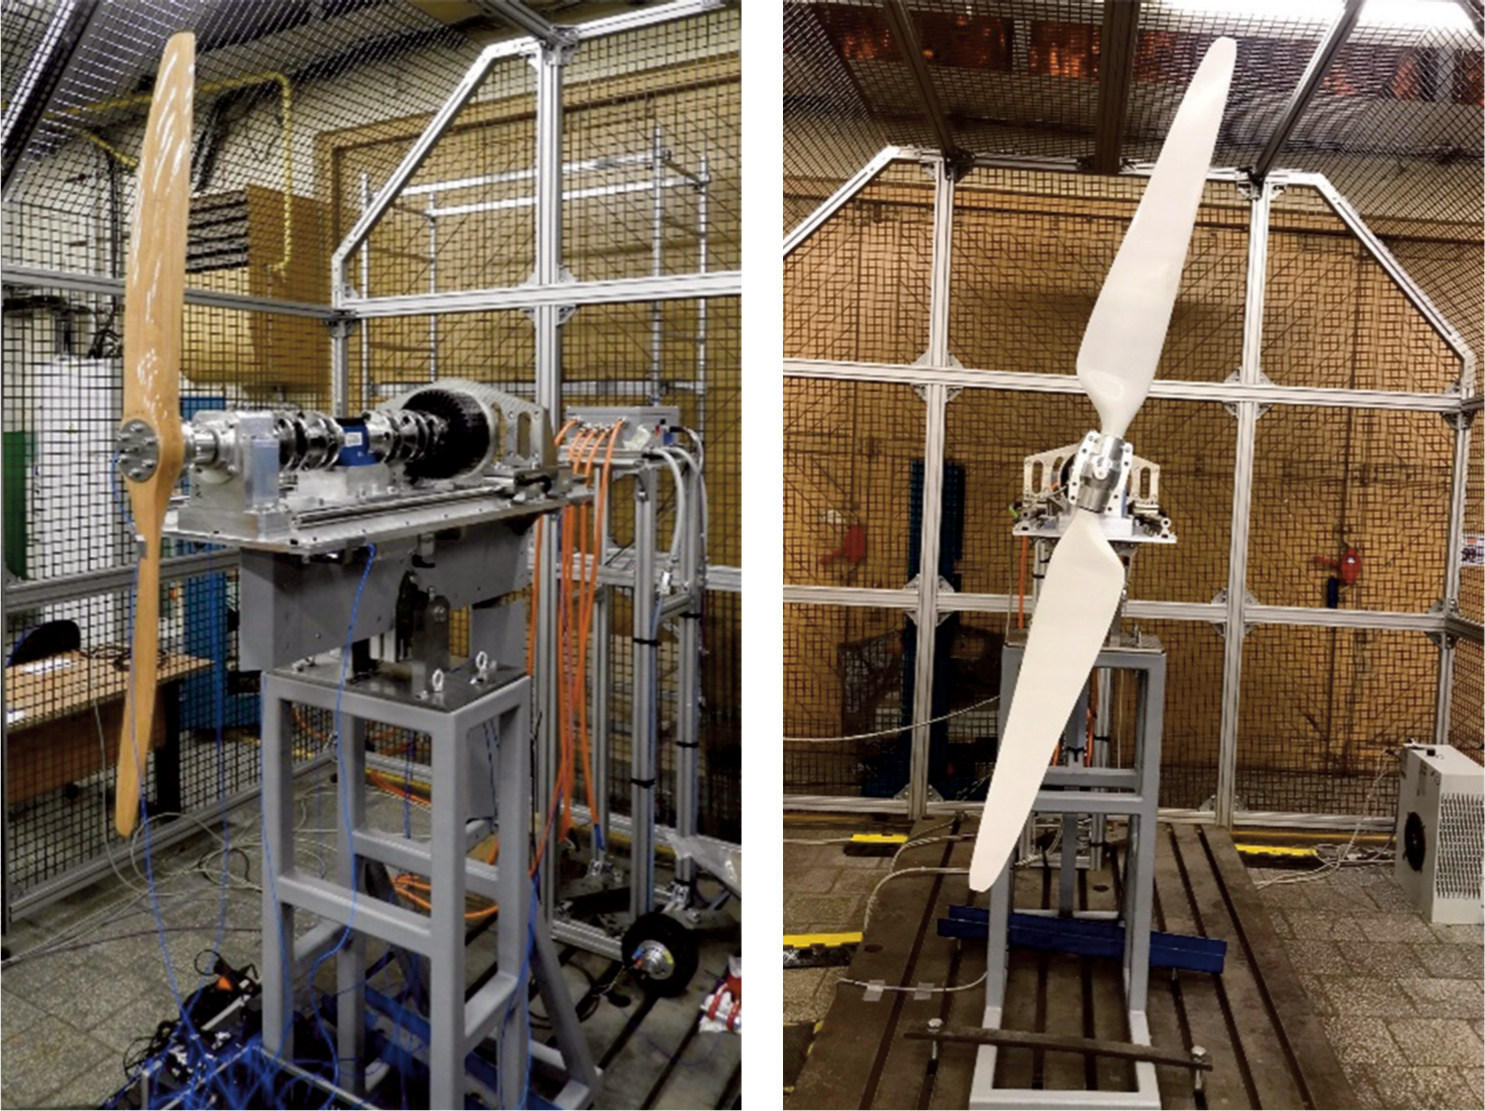
Figure 10.
Tests’ propellers: commercial wooden Aerobat (left), and carbon composite from the Łukasiewicz – Institute of Aviation (right).
Table 3.
Initial parameters, step function of the torque and the corresponding currents - 1st cycle.
| No. | Starting point - torque (Nm) | RMS current corresponding to torque (A) | Ending point - torque (Nm) | RMS current corresponding to torque (A) |
|---|---|---|---|---|
| 1 | 8.5 | 14.2 | ||
| 2 | 6.0 | 10.0 | 10.0 | 16.7 |
| 3 | 14.0 | 23.3 | ||
| 4 | 25.5 | 42.5 | ||
| 5 | 23.0 | 38.3 | 27.0 | 45.0 |
| 6 | 31.0 | 51.7 | ||
| 7 | 35.5 | 59.2 | ||
| 8 | 33.0 | 55.0 | 37.0 | 61.7 |
| 9 | 41.0 | 68.3 | ||
| 10 | 47.5 | 79.2 | ||
| 11 | 45.0 | 75.0 | 49.0 | 81.7 |
| 12 | 53.0 | 88.3 | ||
| 13 | 60.5 | 100.8 | ||
| 14 | 58.0 | 96.7 | 62.0 | 103.3 |
| 15 | 66.0 | 110.0 | ||
| 16 | 70.5 | 117.5 | ||
| 17 | 68.0 | 113.3 | 72.0 | 120.0 |
| 18 | 76.0 | 126.7 |
Table 4.
Initial parameters, step function of the torque and the corresponding currents — 2nd cycle.
| No. | Starting point - torque (Nm) | RMS current corresponding to torque (A) | Ending point - torque (Nm) | RMS current corresponding to torque (A) |
|---|---|---|---|---|
| 1 | 6.0 | 10.0 | 76.0 | 126.7 |
| 2 | 23.0 | 38.3 | ||
| 3 | 33.0 | 55.0 | ||
| 4 | 45.0 | 75.0 | ||
| 5 | 58.0 | 96.7 | ||
| 6 | 68.0 | 113.3 |
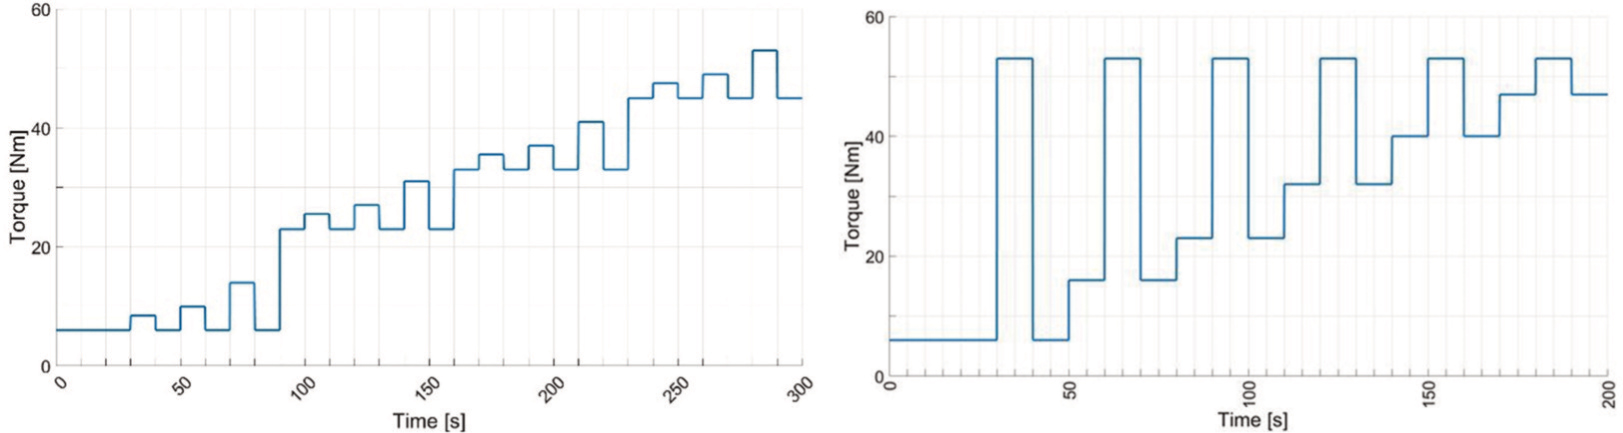
Figure 11.
Course of step excitations for: 1st cycle (left) and 2nd cycle (right) [own elaboration].
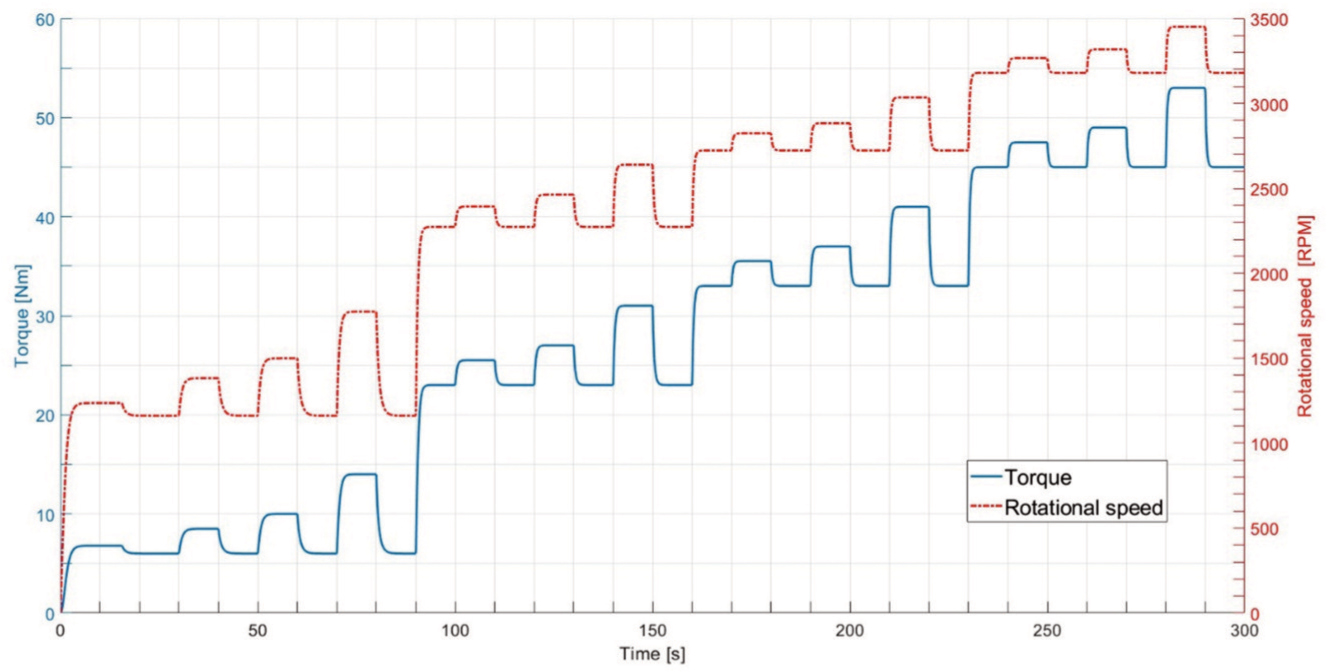
Figure 12.
Summary of Aerobat propeller rotational speed and torque in the 1st cycle [own elaboration].
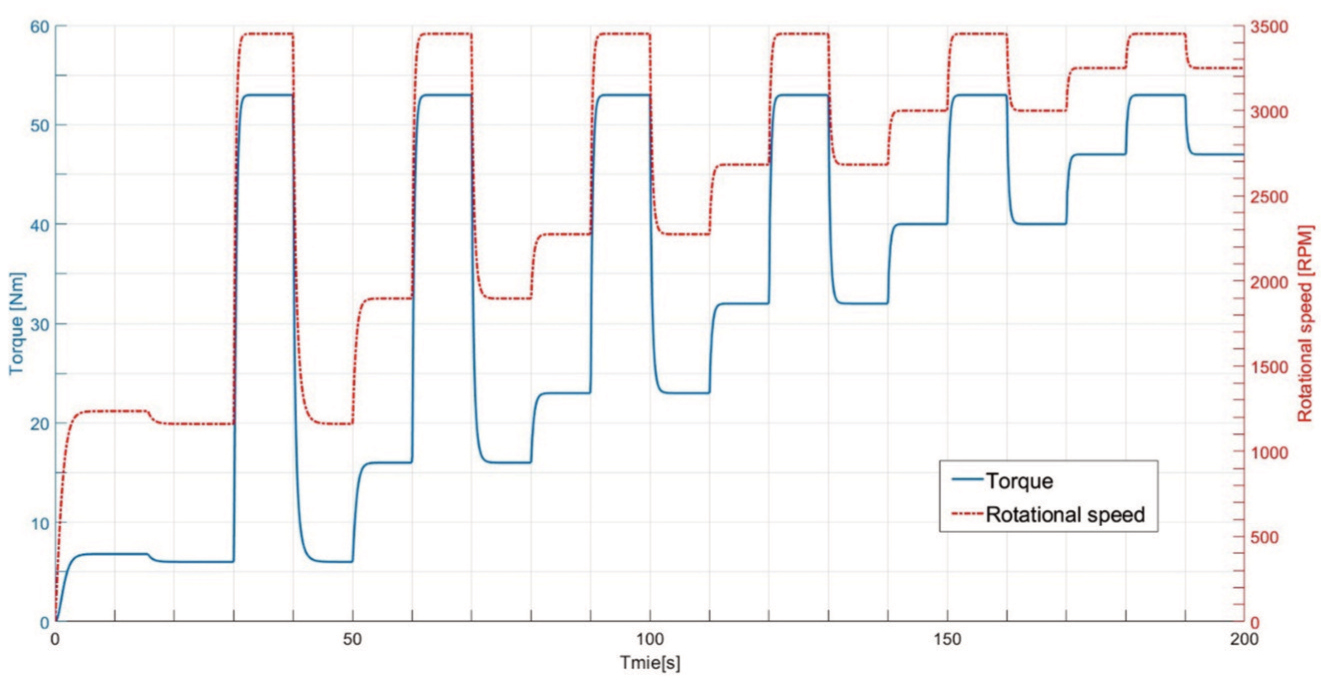
Figure 13.
Summary of Aerobat propeller rotational speed and torque in the 2nd cycle [own elaboration].
Table 5.
Adjustment time for Aerobat propeller — 1st cycle.
| No. | Starting point - torque (Nm) | Ending point - torque (Nm) | Adjustment time (s) |
|---|---|---|---|
| 1 | 6.0 | 8.5 | 3.9 |
| 2 | 10.0 | 3.9 | |
| 3 | 14.0 | 3.9 | |
| 4 | 23.0 | 25.5 | 2.5 |
| 5 | 27.0 | 2.5 | |
| 6 | 31.0 | 2.5 | |
| 7 | 33.0 | 35.5 | 2.1 |
| 8 | 37.0 | 2.1 | |
| 9 | 41.0 | 2.1 | |
| 10 | 45.0 | 47.5 | 2.0 |
| 11 | 49.0 | 2.0 | |
| 12 | 53.0 | 2.0 |
Table 6.
Adjustment time for Aerobat propeller — 2nd cycle.
| No. | Starting point - torque (Nm) | Ending point - torque (Nm) | Adjustment time (s) |
|---|---|---|---|
| 1 | 6.0 | 53.0 | 2.5 |
| 2 | 16.0 | 53.0 | 2.4 |
| 3 | 23.0 | 53.0 | 2.3 |
| 4 | 32.0 | 53.0 | 2.3 |
| 5 | 40.0 | 53.0 | 2.2 |
| 6 | 47.0 | 53.0 | 2.0 |
Table 7.
Comparison of actual results with the simulation results for the same RMS currents, Aerobat propeller.
| Experimental research | Numerical model research | |||
|---|---|---|---|---|
| Current (A) | Torque (Nm) | Rotational speed (RPM) | Torque (Nm) | Rotational speed (RPM) |
| 3.86 | 2.4 | 640.0 | 2.3 | 720.0 |
| 8.76 | 5.3 | 1,065.0 | 5.3 | 1,087.0 |
| 17.45 | 10.7 | 1,550.0 | 10.5 | 1,534.0 |
| 29.08 | 18.0 | 2,030.0 | 17.5 | 1,980.0 |
| 36.80 | 22.7 | 2,280.0 | 22.1 | 2,226.0 |
| 44.70 | 27.8 | 2,520.0 | 26.8 | 2,456.0 |
| 53.6 | 33.1 | 2,755.0 | 32.2 | 2,688.0 |
| 66.5 | 40.5 | 3,020.0 | 39.9 | 2,995.0 |
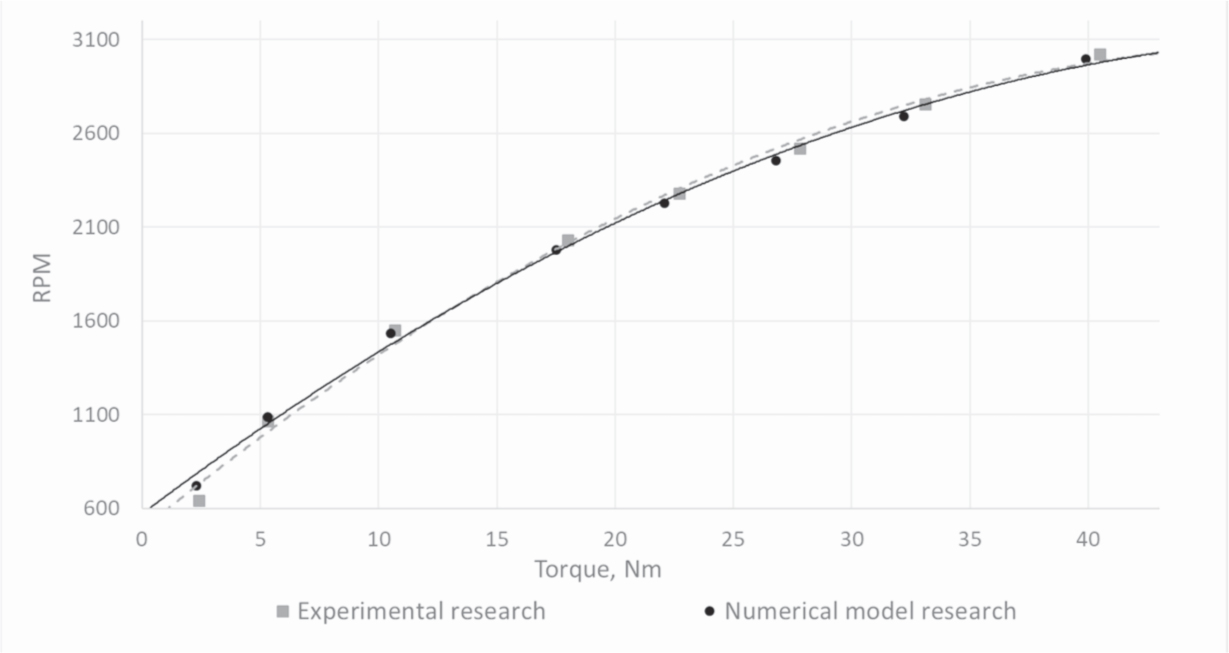
Figure 14.
Comparison of actual results with the simulation results for Aerobat propeller [own elaboration].
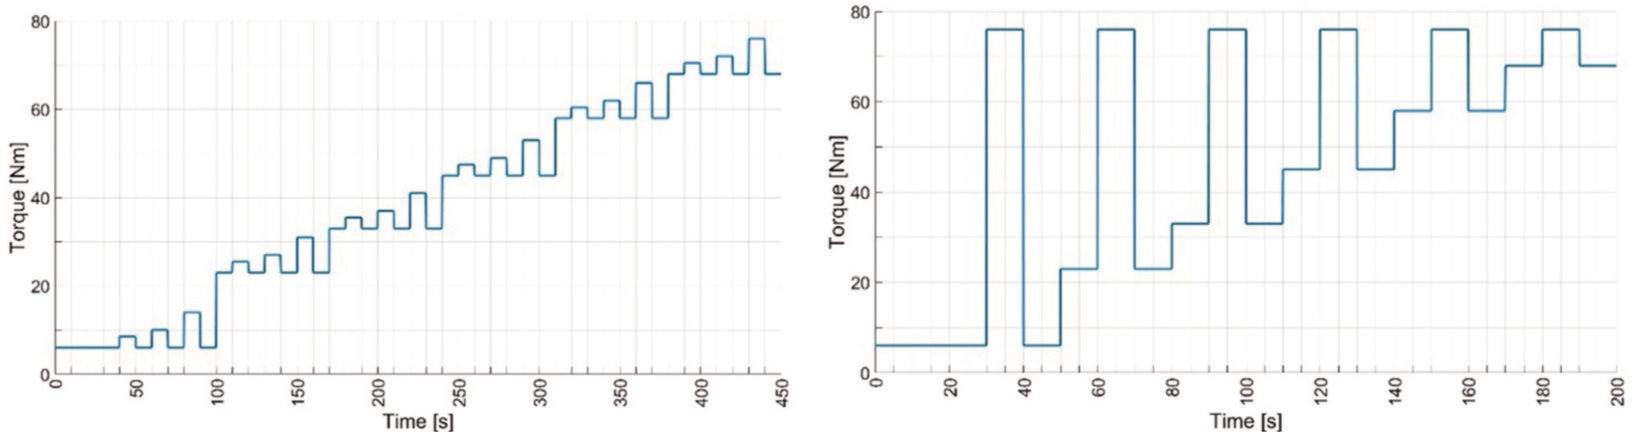
Figure 15.
Course of step excitations for 1st cycle (left) and 2nd cycle (right) [own elaboration].
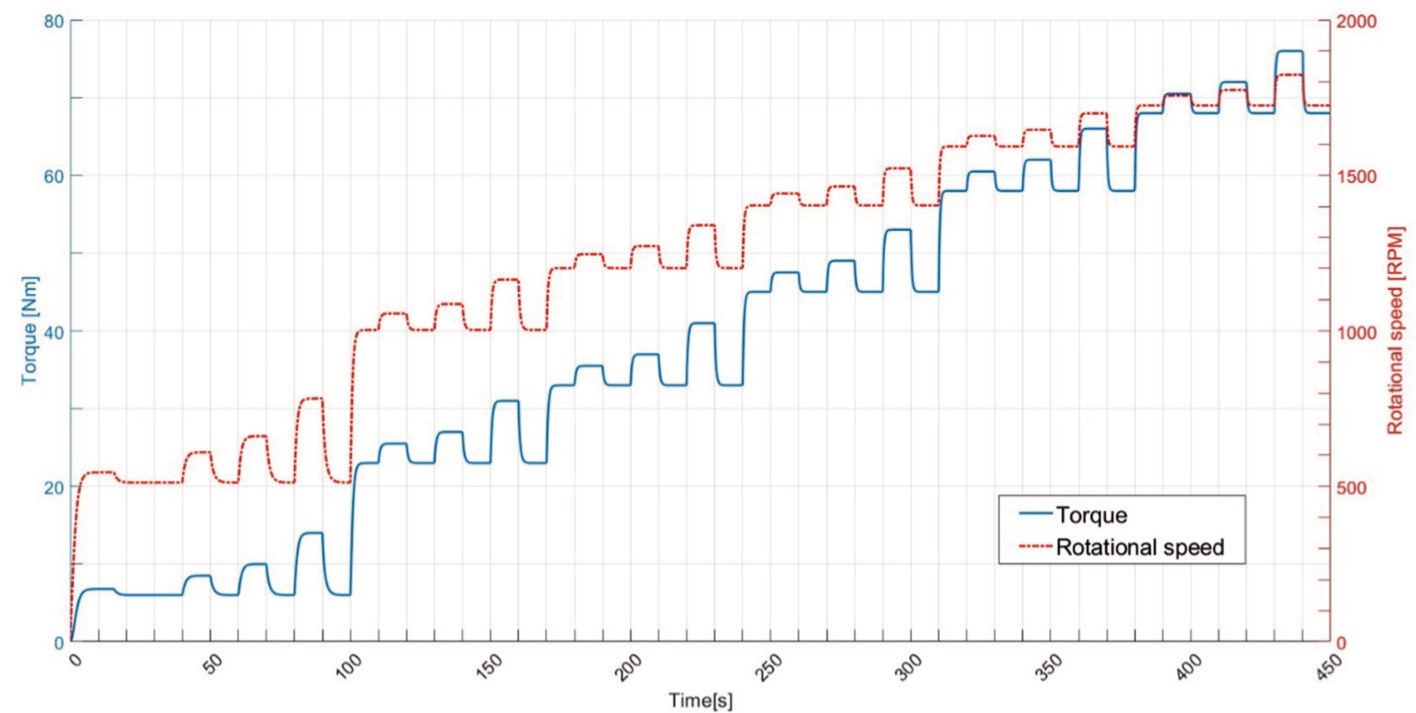
Figure 16.
Summary of Łukasiewicz – Institute of Aviation propeller rotational speed and torque in the 1st cycle [own elaboration].
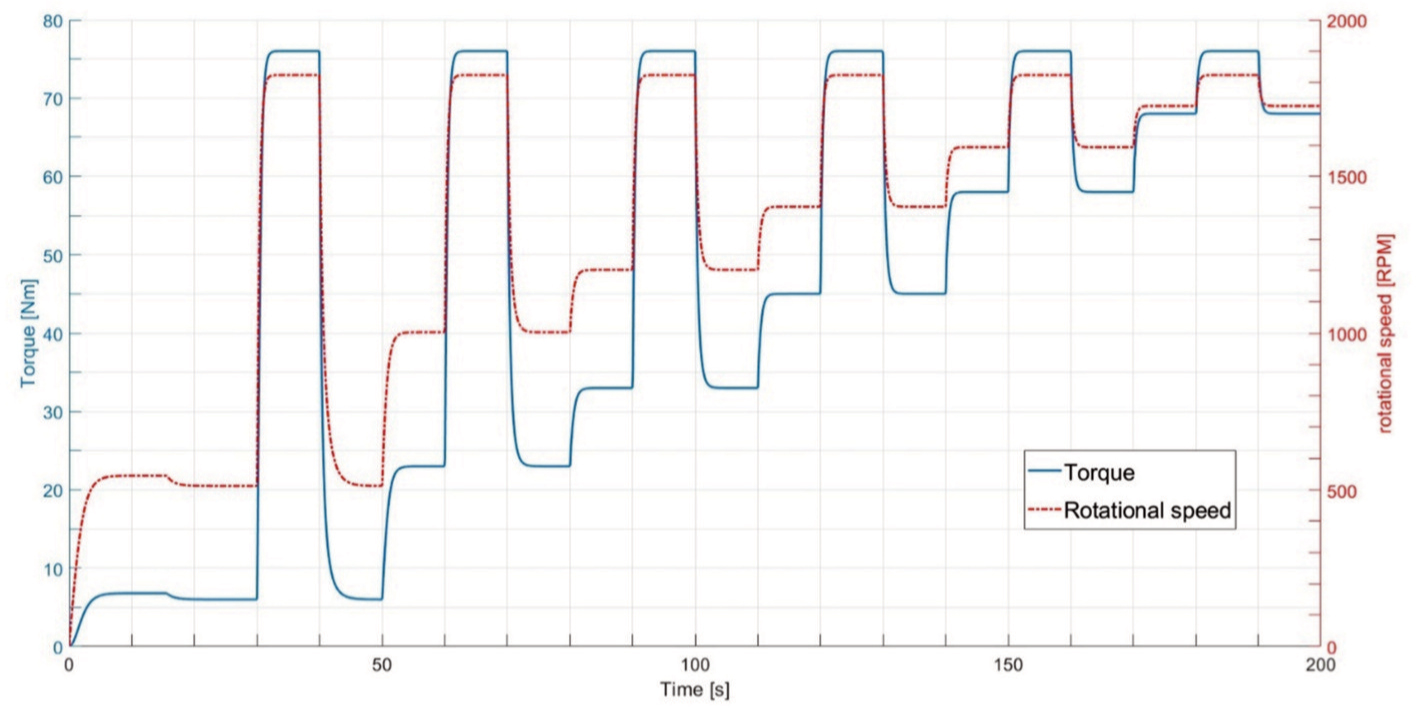
Figure 17.
Summary of Łukasiewicz – Institute of Aviation propeller rotational speed and torque in the 2nd cycle [own elaboration].
Table 8.
Adjustment time for Łukasiewicz — Institute of Aviation propeller — 1st cycle.
| No. | Starting point - torque (Nm) | Ending point - torque (Nm) | Adjustment time (s) |
|---|---|---|---|
| 1 | 8.5 | 6.0 | |
| 2 | 6 | 10.0 | 6.0 |
| 3 | 14.0 | 6.0 | |
| 4 | 25.5 | 4.7 | |
| 5 | 23 | 27.0 | 4.5 |
| 6 | 31.0 | 4.5 | |
| 7 | 35.5 | 3.7 | |
| 8 | 33 | 37.0 | 3.7 |
| 9 | 41.0 | 3.7 | |
| 10 | 47.5 | 3.0 | |
| 11 | 45 | 49.0 | 3.0 |
| 12 | 53.0 | 3.0 | |
| 13 | 60.5 | 2.8 | |
| 14 | 58 | 62.0 | 2.7 |
| 15 | 66.0 | 2.7 | |
| 16 | 70.5 | 2.2 | |
| 17 | 68 | 72.0 | 2.2 |
| 18 | 76.0 | 2.2 |
Table 9.
Adjustment time for Łukasiewicz — Institute of Aviation propeller — 2nd cycle.
| Lp. | Starting point - torque (Nm) | Ending point - torque (Nm) | Adjustment time (s) |
|---|---|---|---|
| 1 | 6.0 | 76.0 | 3.4 |
| 2 | 23.0 | 76.0 | 3.1 |
| 3 | 33.0 | 76.0 | 3.0 |
| 4 | 45.0 | 76.0 | 2.9 |
| 5 | 58.0 | 76.0 | 2.8 |
| 6 | 68.0 | 76.0 | 2.2 |
Table 10.
Comparison between the actual results and the simulation results for the same RMS currents, for the carbon composite Łukasiewicz — Institute of Aviation propeller.
| Experimental research | Numerical model research | |||
|---|---|---|---|---|
| Present current (A) | Torque (Nm) | Rotational speed (RPM) | Torque (Nm) | Rotational speed (RPM) |
| 11.09 | 7.62 | 565.0 | 6.65 | 540.0 |
| 23.99 | 15.35 | 825.0 | 14.39 | 794.0 |
| 38.96 | 24.40 | 1,045.0 | 23.38 | 1,011.0 |
| 54.32 | 33.37 | 1,215.0 | 32.69 | 1,195.0 |
| 63.99 | 38.73 | 1,305.0 | 38.39 | 1,296.0 |
| 75.37 | 45.15 | 1,405.0 | 45.22 | 1,406.0 |
| 89.29 | 52.30 | 1,515.0 | 53.57 | 1,531.0 |
| 103.81 | 59.35 | 1,615.0 | 62.29 | 1,651.0 |
| 121.99 | 66.91 | 1,715.0 | 73.19 | 1,789.0 |
| 137.16 | 72.61 | 1,770.0 | 82.30 | 1,897.0 |
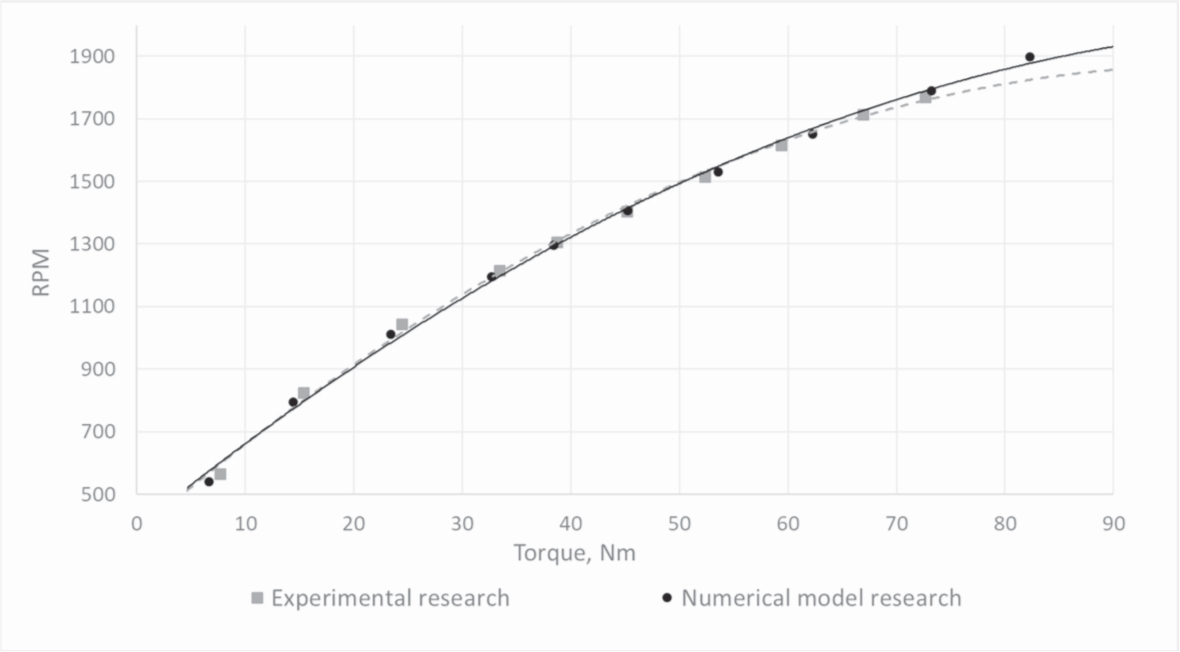
Figure 18.
Comparison of actual results with the simulation results for the carbon composite Łukasiewicz – Institute of Aviation propeller [own elaboration].