
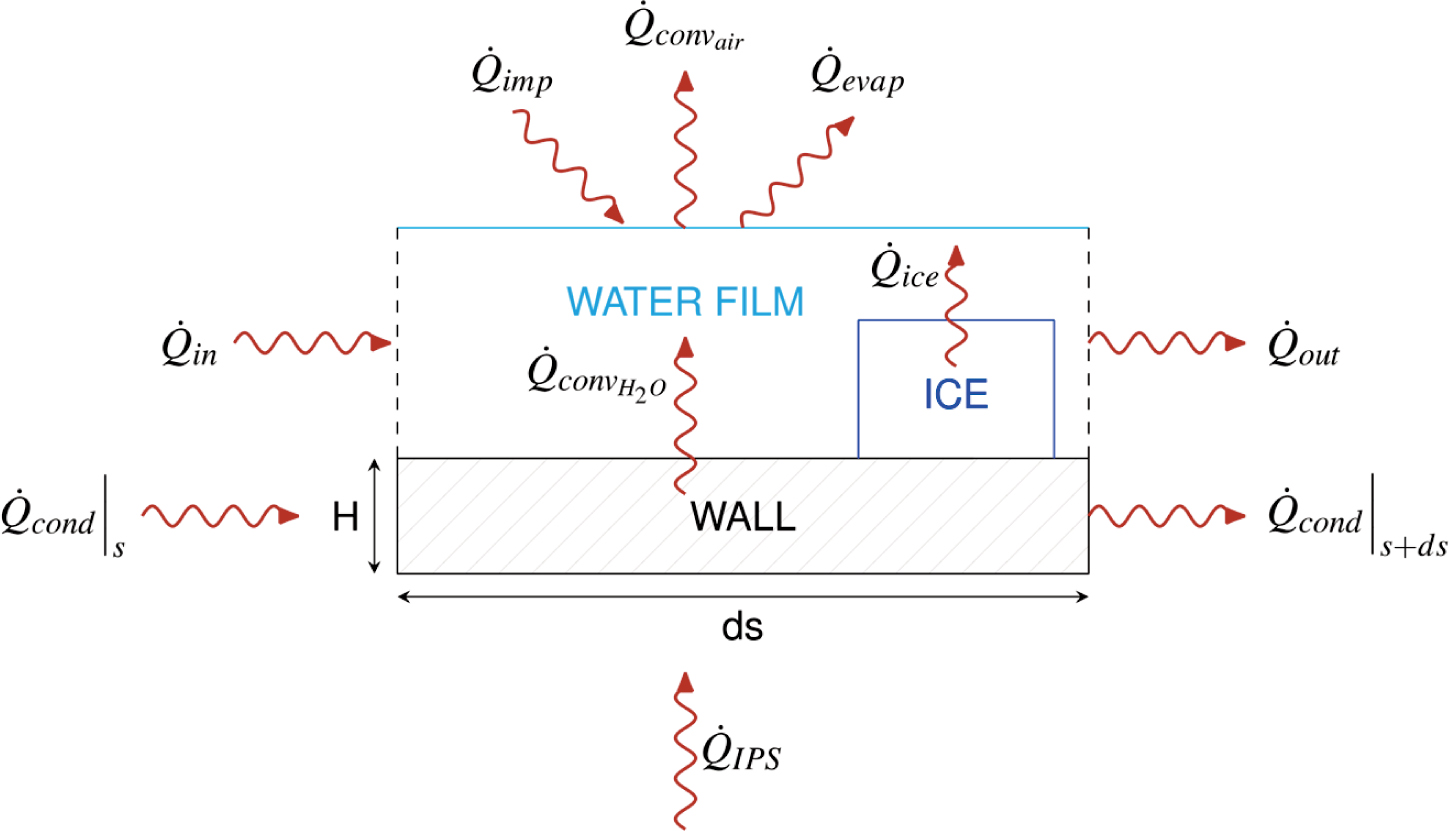
Figure 1.
Contributions to energy conservation in a finite volume [16].
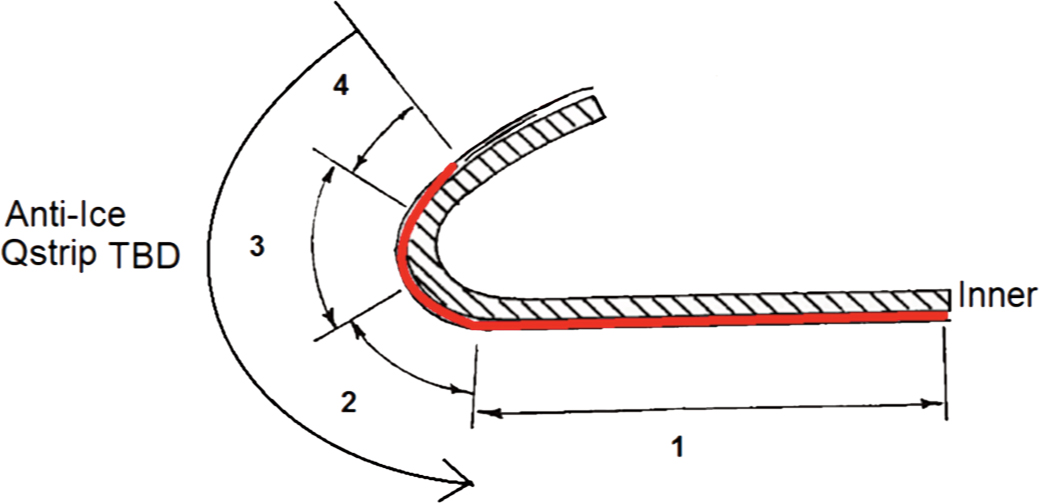
Figure 2.
Schematic representation of the ETIPS of the nacelle. ETIPS, electro-thermal ice protection systems.
Table 1.
Heating element layers with material properties [4].
| Material | |||
|---|---|---|---|
| Heating element (Alloy 90) | 41.02 | 8,906.26 | 385.19 |
| Erosion shield (SS 301 HH) | 16.27 | 8,025.25 | 502.42 |
| Elastomer (Cox 4300) | 0.256 | 1,384 | 1,256.04 ± 125.6 |
| Fibreglass/epoxy composite | 0.294 | 1,794.07 | 1,570.05 |
| Silicone foam insulation | 0.121 | 648.25 | 1,130.44 ± 125 |
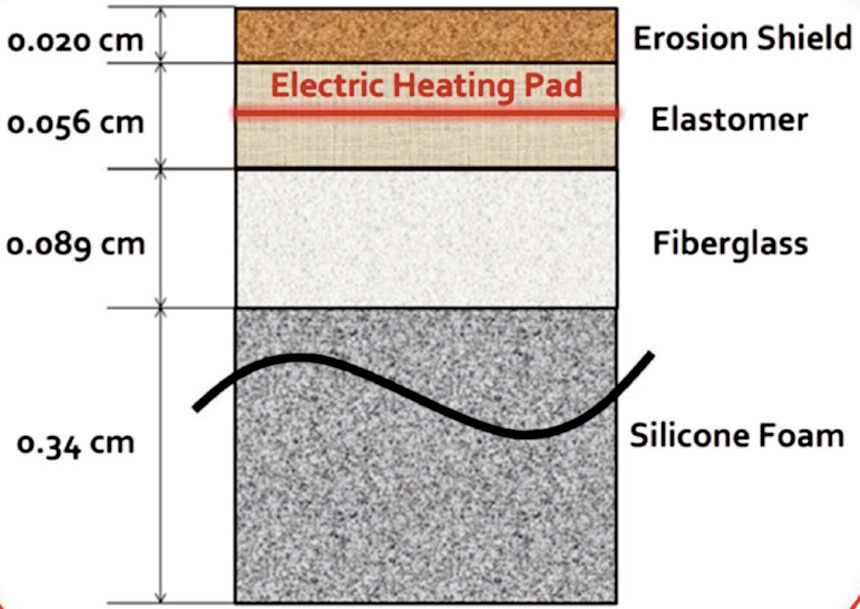
Figure 3.
Schematic view of the heater layers [11].
Table 2.
IWT parameters used for the design of the IPS.
| IWT parameters | |
|---|---|
| α [°] | 1.70 |
| 67.48 | |
| T∞[K] | 259.95 |
| 1.2886 | |
| P∞[Pa] | 101,325 |
| MVD [μm] | 28.0 |
| 0.583 | |
| Δt[s] | 594 |
Table 3.
Penalty for each constraint.
| Constraint | Description | Penalty ice | Penalty temp. |
|---|---|---|---|
| No ice | - | ||
| T ε [Tmin, Tmax] | Temp. | - | |
| No ice & temp. | |||
| B ≤ Bmax T ≤ Tmax | Ice & temp. |
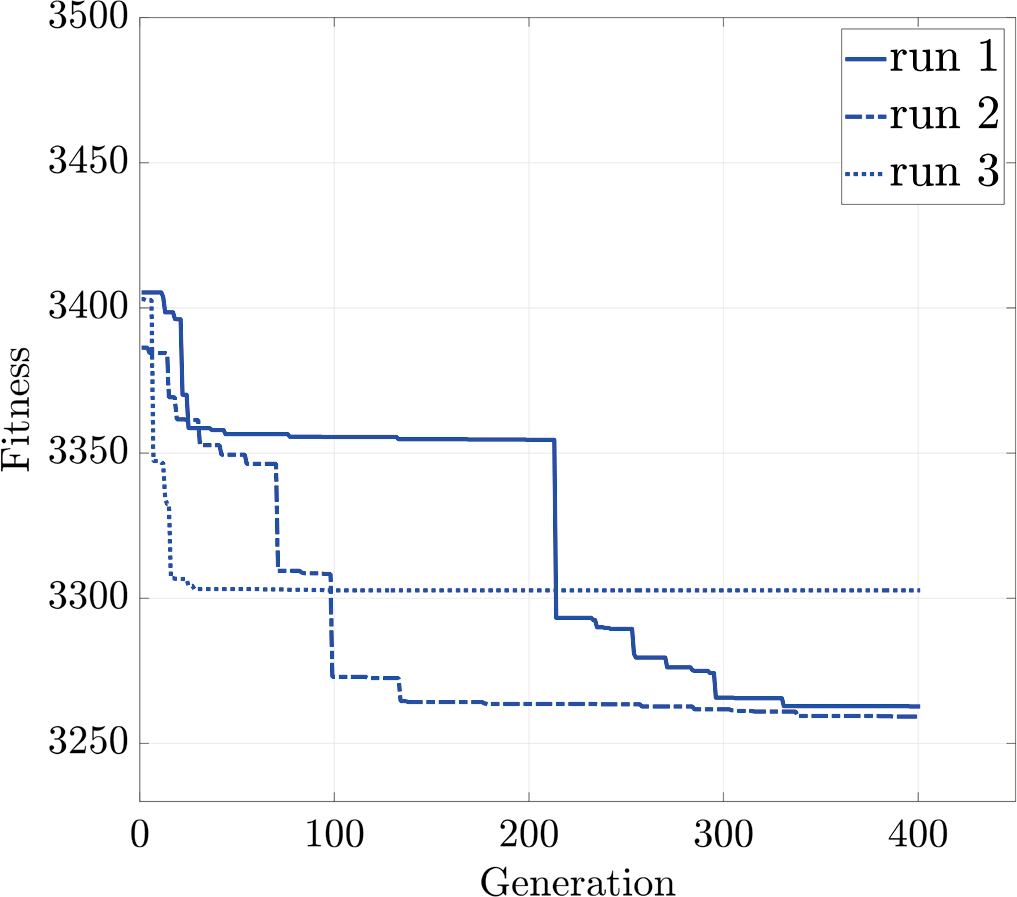
Figure 4.
Convergence history over the number of generations for no ice constraint runs.
Table 4.
Best design for each constraint.
| Constraint | Tmax [K] | Tmin [K] | GA | |||
|---|---|---|---|---|---|---|
| No ice | 3305.65 | 0 | 320.77 | 326.11 | 266.75 | CM-GA |
| Temp. | 1657.74 | 328.29 | 306.50 | 287.57 | 280.18 | C-GA |
| No ice & temp. | 3452.95 | 0 | 316.59 | 325.05 | 275.74 | M-GA |
| Ice & temp. | 1517.02 | 323.72 | 319.57 | 294.14 | 273.21 | CM-GA |
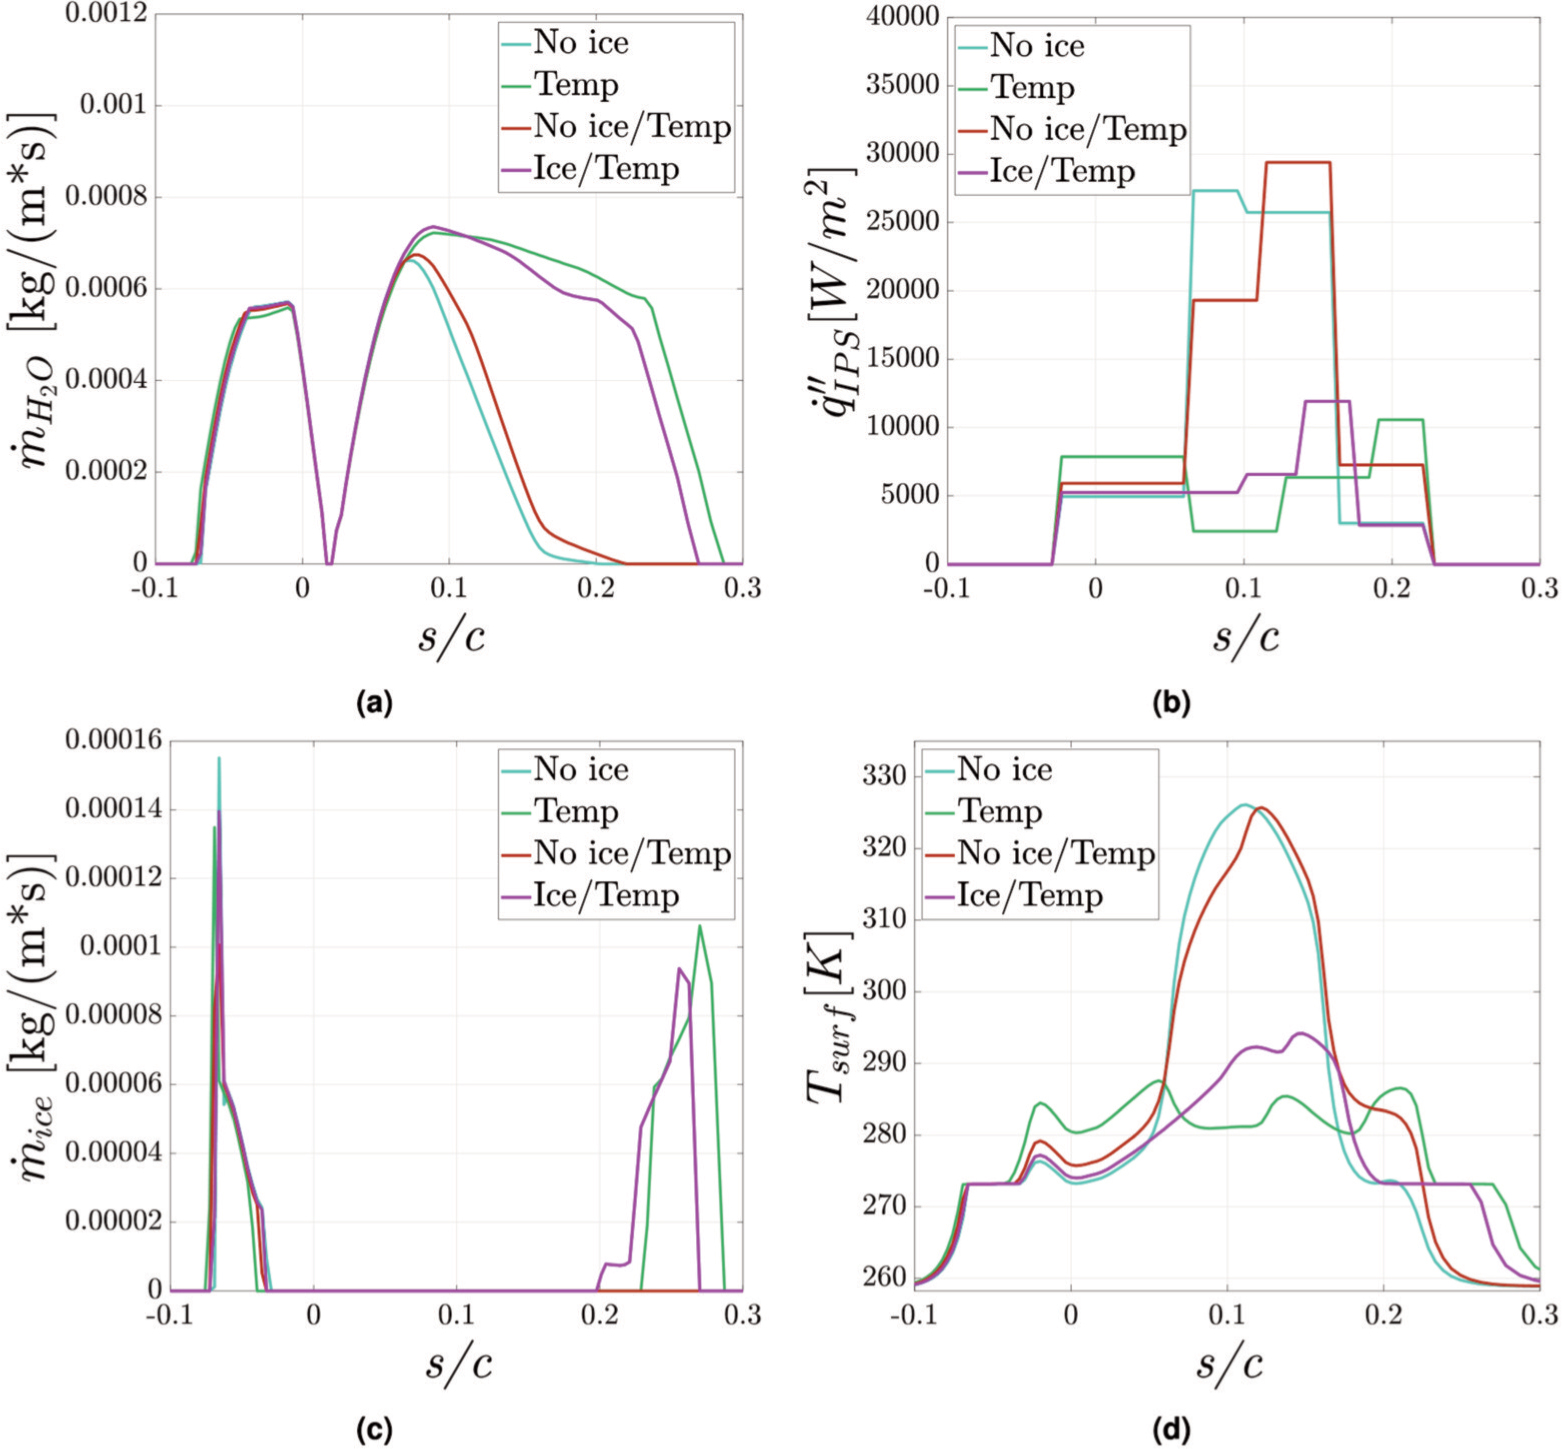
Figure 5.
Result comparison for the best designs for each constraint. (a) runback water; (b) heat fluxes; (c) ice accretion rate; (d) surface temperature. s/c < 0 represents the outboard, s/c > 0 the inboard.